| |
Unpublished CES Studies |
 |
|
Volume IX. Committee Publications |
|
The Need For Economic Security In United States |
THE NEED FOR
ECONOMIC SECURITY
IN UNITED STATES

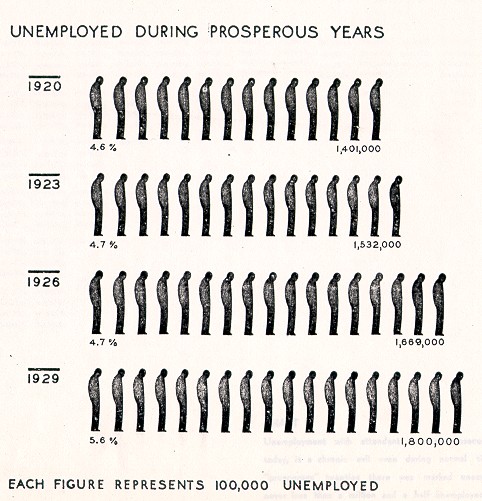
CHART I: The hazard of unemployment is not alone a depression phenomena. The years featured in this chart were relatively prosperous yet they represent approximate periodic lows of unemployment from 1920 to 1929 inclusive. The figures are for unemployed in all industries except agriculture.
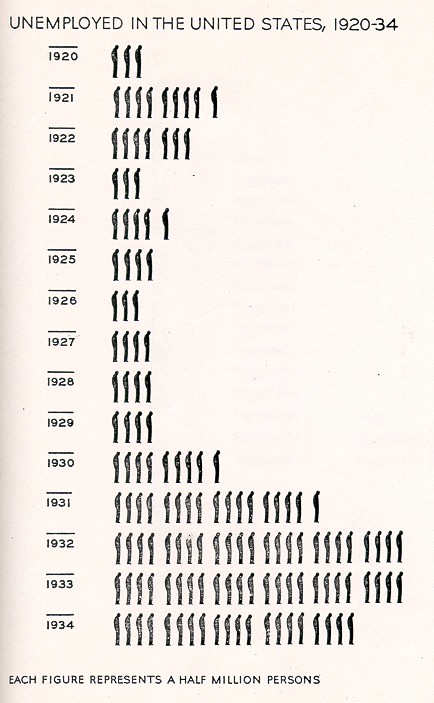
CHART II: Unemployment With attendant economic insecurity, a grave problem today, is a chronic evil even during normal times. Throughout the "prosperous" twenties there was marked unemployment. There was never less than a million and a half unemployed during this period.
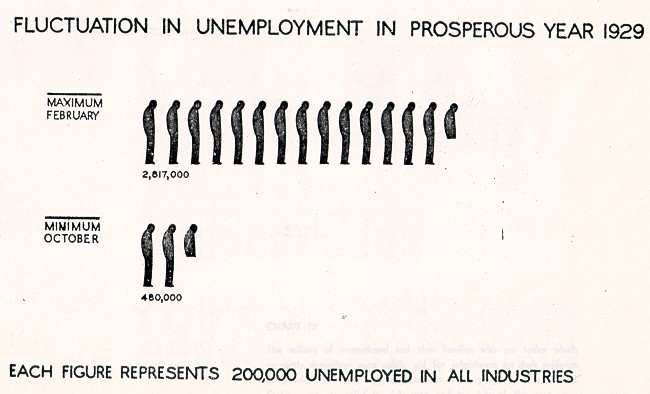
CHART III: The year 1929 was one of marked prosperity and even in that year estimates reveal nearly 3 million unemployed in February. Fluctuations in unemployment the same year were extremely wide--October showed slightly less than 1/2 million unemployed.
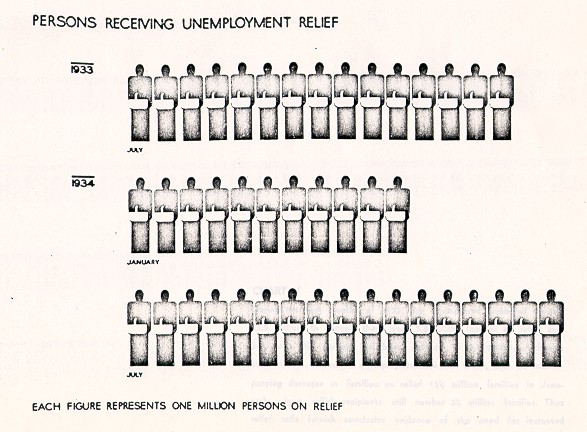
CHART IV: The millions of unemployed and their families who are today wholly or partly dependent upon public aid for subsistence are stark evidence of American insecurity. Approximately 15 million people in the United States were on relief in July, 1933 and by July of the next year, the number had increased to approximately 17 million. The decline in numbers on relief in January, 1934 was due almost entirely to the existence of C. W. A. during that month.
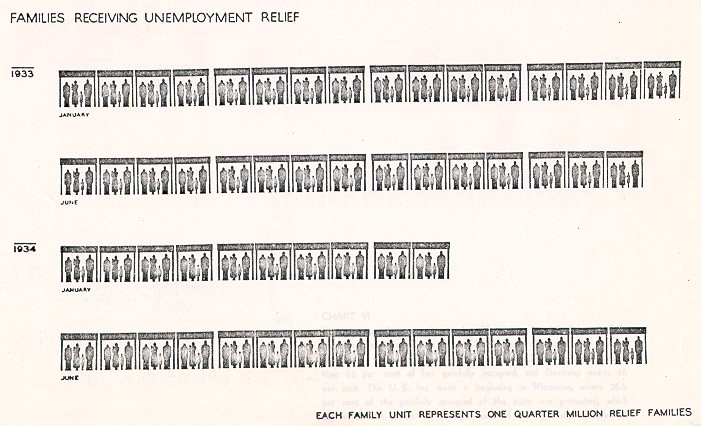
CHART V: During the first months of 1933, the unemployed numbered around 13.5 million. In January there were 3,859,000 families on relief and by June this number had been reduced to 3,789,000. Although 1934 saw a decrease in unemployment due to CWA, and an accompanying decrease in families on relief (2.5 million families in January), June relief recipients still number 3.75 million families. Thus relief rolls furnish conclusive evidence of the need for increased economic security.
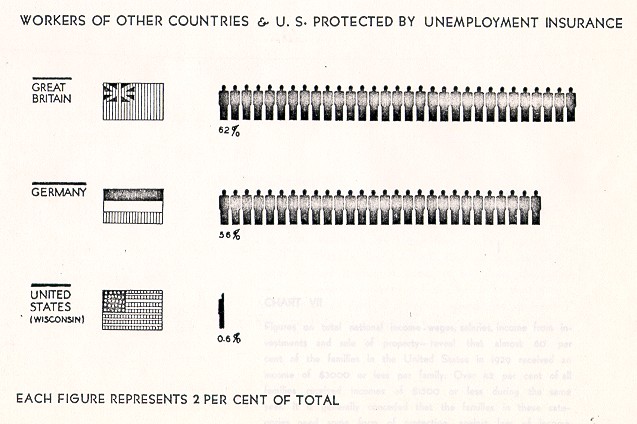
CHART VI: A comparison between the number of workers covered by compulsory unemployment insurance in Great Britain and Germany with that of the U. S. shows a marked contrast. Great Britain protects more than 62 per cent of her gainfully occupied, and Germany nearly 56 per cent. The U. S. has made a beginning in Wisconsin, where 26.6 per cent of the gainfully occupied of the state are protected, which represents six-tenths of one per cent of the gainfully occupied of the whole country.
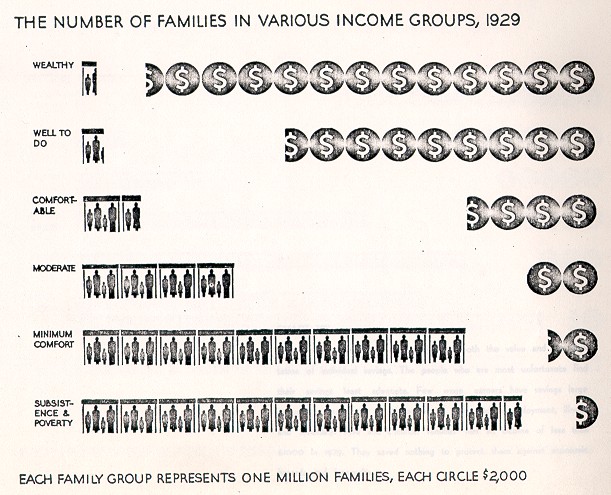
CHART VII: Figures on total national income--wages, salaries, income from investments and sale of property--reveal that almost 80 per cent of the families in the United States in 1929 received an income of $3000 or less per family. Over 42 per cent of all families received incomes of $1500 or less during the same year. It is generally conceded that the families in these categories need some form of protection against loss of income from such hazards as unemployment, old age, destitution, and sickness.
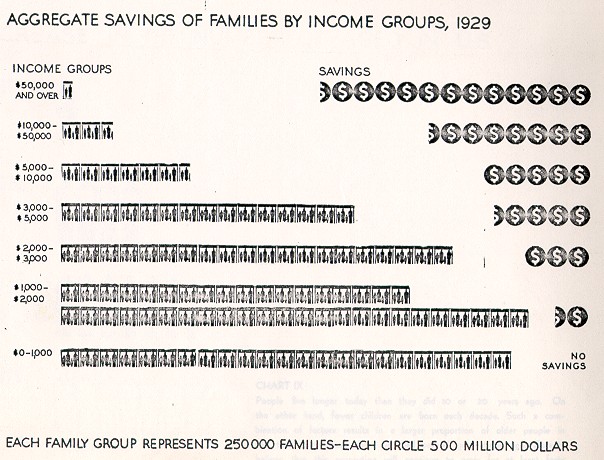
CHART VIII: The present depression has demonstrated both the value and the limitation of individual savings. The people who are most unfortunate find their savings least adequate. Few wage earners have savings large enough to meet the contingencies of prolonged unemployment, IIlness, and invalidity. Five and three-quarter million families had an income of less than $1000 in 1929. They saved nothing to protect them against economic hazards and insecurity.
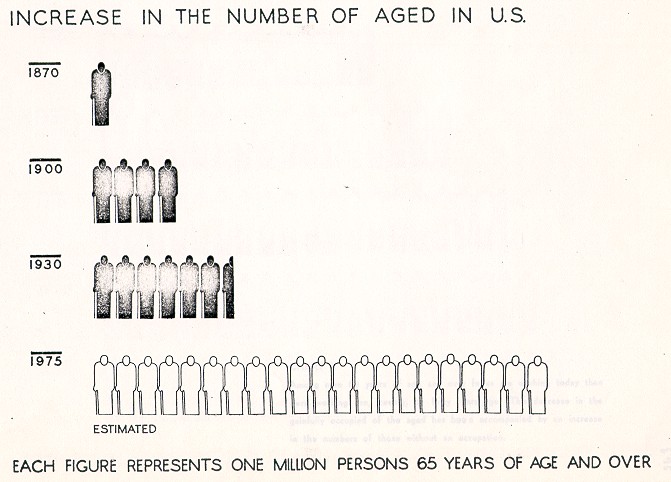
CHART IX: People live longer today than they did 10 or 20 years ago. On the other hand, fewer children are born each decade. Such a combination of factors results in a larger proportion of older people in the total population than we had several generations ago. Experts believe that this proportion will continue to grow for at least forty years.
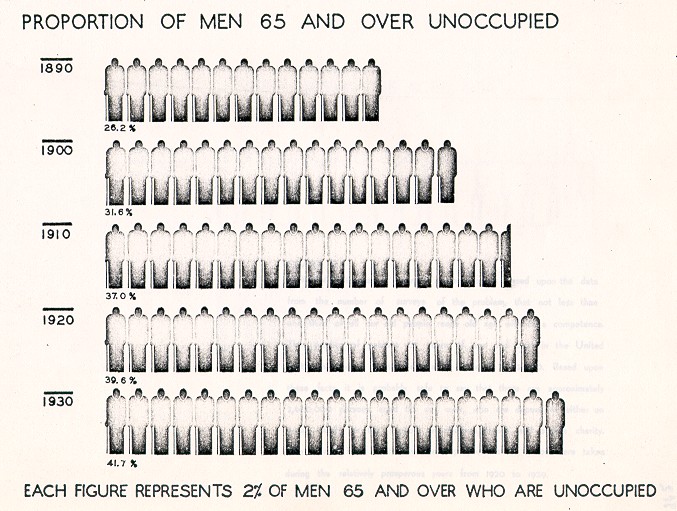
CHART X: Among men 65 years of age and over fewer are working today than were working ten, twenty, or forty years ago. This decrease in the gainfully occupied of the aged has been accompanied by an increase in the numbers of those without an occupation.
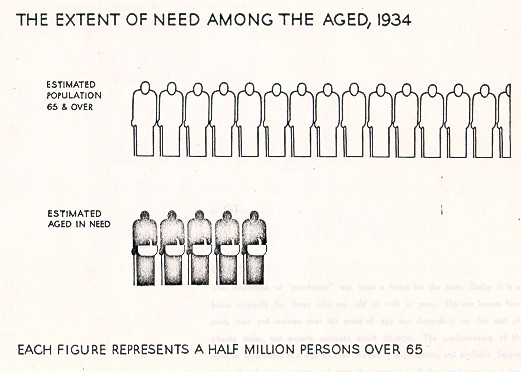
CHART XI: It is the consensus of opinion among experts based upon the data from the number of surveys of the problem, that not less than one third of all our old people reach old age without a competence. The number of persons 65 years of age and over in the United States has been recently estimated to total 7,200,000. Based upon these facts it is probably safe to say that there are approximately 2,400,000 persons, aged 65 and over, who are dependent either on public charity or the support of relatives, friends and private charity. The surveys upon which the above proportions are based were taken during the relatively prosperous years from 1920 to 1929.
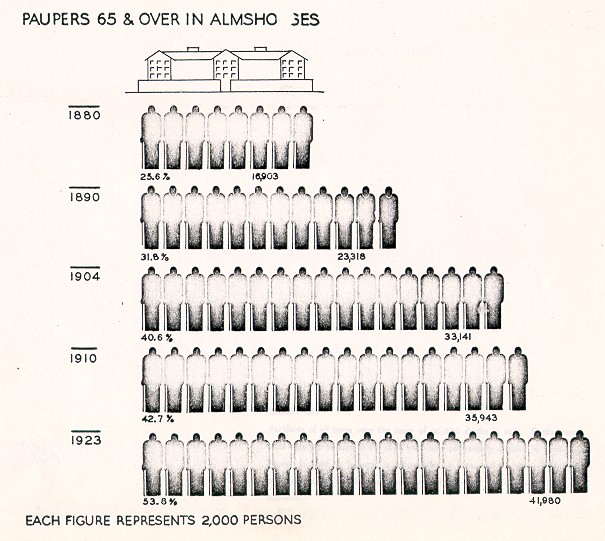
CHART XII: The almshouse or "poorhouse" was once a home for the poor. Today it is a home primarily for those who are old as well as poor. No one knows how many men and women over 65 years of age are dependent on this form of charity today, but experts estimate about 50,000. The predominance of the aged in almshouses is a sign of their increasing dependency, and available figures show that between 1880 and 1923 the proportion of the poorhouse population increased from about 23 per cent to nearly 54, although their increase in the population was much smaller.
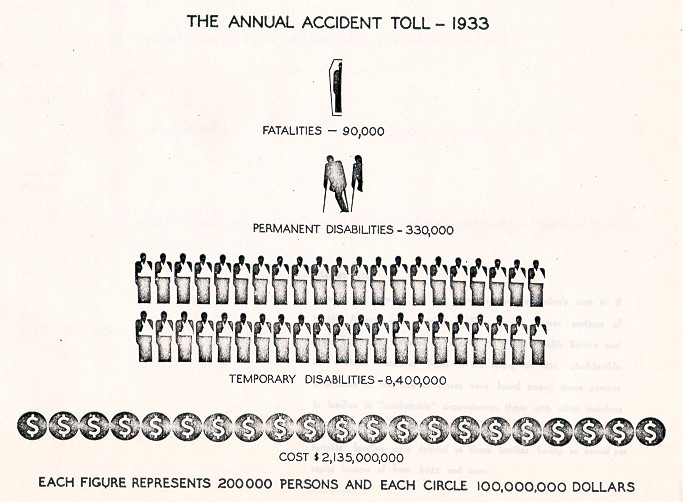
CHART XIII: Accidents of all types were the cause of 90,000 deaths in 1933. Furthermore, some 330,000 persons in the same year were permanently disabled by accidental injuries incurred in industry, in automobiles, in fires, and at home. The total costs estimated include wage loss, medical expense, and overhead costs of insurance.
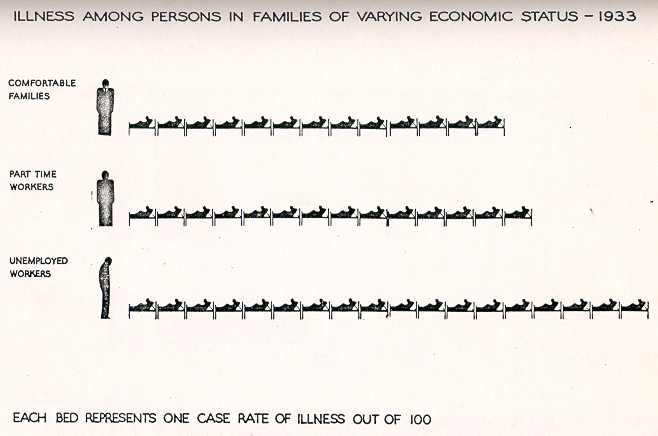
CHART XIV: Records of sickness tell the story of the depression's cost in ill health. Among wage-earning families in the poorer sections of three big cities, surveyed by the U. S, Public Health Service and the Milbank Memorial Fund in the spring of 1933, considerable differences in the rate of illness were found among those persons in families in "comfortable" circumstances, those with other membersemployed only part-time, and those without anyone employed. "Comfortable" families were defined as those families having an annual per capita income of from $425 and over.
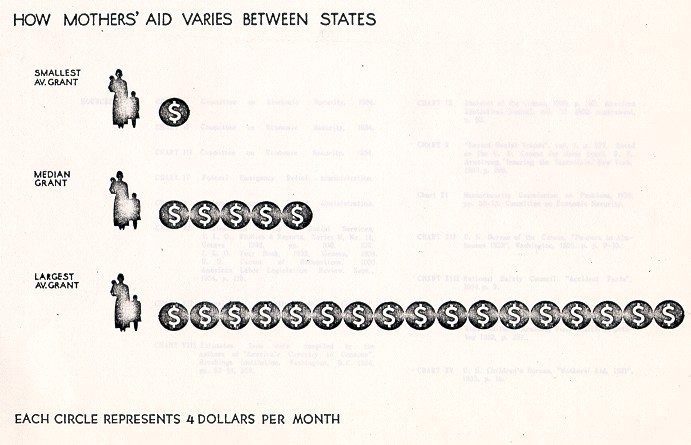
CHART XV: Of the forty-six states having mothers' aid legislation, only 20 have included all types of families needing mothers' assistance, besides widows and their dependents. The variations in amount granted in a single state are sometimes greater than between states. The small average grant of some states indicates that this form of aid is considered by those states as a pittance to keep the family alive, rather then as a means of maintaining family life--its original purpose.
SOURCES
CHART I: Committee on Economic Security, 1934.
CHART II: Committee on Economic Security, 1934.
CHART III: Committee on Economic Security, 1934.
CHART IV: Federal Emergency Relief Administration
CHART V: Federal Emergency Relief Administration
CHART VI: International Survey of Social Services, I. L. 0., Studies & Reports, Series M, No. 11,Geneva 1933, PP. 316, 326. I. L. 0. Year Book, 1933, Geneva, 1934.U. S. Census of Occupations, 1930. American Labor Legislation Review, Sept., 1934, p. 115.
CHART VII: "America's Capacity to Consume," Brookings Institution, Washington, D. C., 1934, p. 87.
CHART VIII: Estimates from data compiled by the authors of "America's Capacity to Consume", Brookings Institution, Washington, D.C. 1934, pp. 93-94, 258.
CHART IX: Abstract of the Census. P. 182. American Statistical Journal, vol. 27, 1932, supplement, P. 93.
CHART X: "Recent Social Trends", vol. 1, p. 277. Based on the U. S. Census for those years. B. N. Armstrong, 'Insuring the Essentials', New York 1932.p. 388.
Chart XI: Massachusetts Commission on Pensions, 1925, pp. 38-73. Committee on Economic Security.
CHART XII: U. S. Bureau of the Census, "Paupers in Almshouses 1923", Washington, 1925 p. 9-10.
CHART XIII: National Safety Council. "Accident Facts", 1934.p. 9.
CHART XIV: Perrot and Collins, "Sickness and the Depression", Milbank Memorial Find Quarterly. October 1933, p. 297.
CHART XV: U. S. Children's Bureau, "Mothers' Aid, 1931", 1933. p. 10.
Directed by: ALEX G. NORDHOLM
Edited by: M. B. SCHNAPPER
Staff: COMMITTEE ON ECONOMIC SECURITY |
|