Direct deposit of Social Security benefits
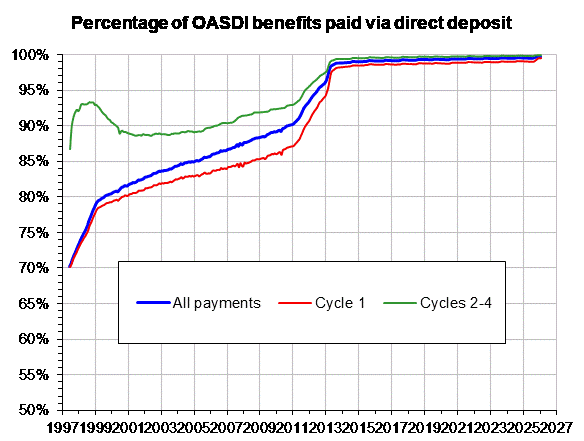
The graph below shows the percentage of Social Security benefit amounts
paid by direct deposit
to financial institutions. We show not only such
percentages for all payments, but we also show percentages applicable to
cycle 1 (third-of-month) payments and cycles 2, 3, 4 payments
(corresponding to payments made on the 2nd,
3rd, and 4th Wednesdays of
each month). Cyclical payments began in
June 1997, and the graph below begins with percentages for that month.
The graph shows that as of September 2017, for those receiving payments on the
2nd, 3rd,
and 4th Wednesdays of each month,
over 99 percent of their benefit payments are paid with direct deposit.
This percentage grew slowly from 2001 through the beginning of 2011.
Beginning in May 2011, the percentage grew faster due to a Department of
Treasury requirement to receive Federal payments via direct deposit for
individuals filing for benefits in May 2011 and later, and for all beneficiaries
beginning March 2013. The graph also shows that the cycle 1 percentage grew
similarly since May 2011 for the same reason. This percentage grew steadily,
though at a slower rate after 1998 through April 2011.
The line representing the percentage for all payments lies between
the other two lines. While initially indistinguishable from the cycle-1
payment percentage line, the line for all payments slowly diverged
from the cycle-1 line until early 2010 as a growing percentage of
beneficiaries received their benefits on the 2nd,
3rd, or 4th Wednesdays of each month.
Beginning in May 2011, these lines slowly converged, at an increasing rate through early 2013.
Since early 2013, the percentages have remained fairly steady.

Note: The monthly direct-deposit percentages shown in the above graph can be
seen by selecting the "cyclical payment" report
for both trust funds combined.
