Social Security: A Program and Policy History
Social Security Bulletin, Vol. 66, No. 1, 2005 (released September 2005)
The publication of this article coincides with the celebration of the 70th anniversary of the Social Security Act. The history and development of the Social Security program from its inception to the present is discussed. Special attention is given to historical debates that have relevance to today's policy discussions. In particular, the article discusses themes regarding program growth, pay-as-you-go financing, reserve funding, rates of return on payroll contributions, and the adequacy of benefits.
Patricia P. Martin and David A. Weaver are with the Office of Retirement Policy, Office of Policy, Social Security Administration.
Acknowledgments: The authors would like to thank Ed DeMarco, Larry DeWitt, Susan Grad, Joyce Manchester, Linda Martin, Scott Muller, and Paul Van de Water for helpful comments and suggestions.
Contents of this publication are not copyrighted; any items may be reprinted, but citation of the Social Security Bulletin as the source is requested. The findings and conclusions presented in the Bulletin are those of the authors and do not necessarily represent the views of the Social Security Administration.
Summary
Many of the federal and state programs that provide income security to U.S. families have their roots in the Social Security Act (the Act) of 1935. This Act provided for unemployment insurance, old-age insurance, and means-tested welfare programs. The Great Depression was clearly a catalyst for the Social Security Act of 1935, and some of its provisions—notably the means-tested programs—were intended to offer immediate relief to families. However, the old-age insurance program—the precursor to today's Old-Age, Survivors, and Disability Insurance, or Social Security, program—was not designed specifically to deal with the economic crisis of that era. Indeed, monthly benefit payments, under the original Act, were not scheduled to begin until 1942. In addition, from the beginning, the Social Security program has embodied social insurance principles that were widely discussed even before the onset of the Great Depression.
The first four decades of the Social Security program were, in general, ones of expansion. In fact, the program was expanded even before it became truly operational. In 1939, amendments added child, spouse, and survivor benefits to the retirement benefits authorized by the 1935 Act. Those amendments also allowed for monthly benefits to begin in 1940. Although the program was not changed substantially during the war years and the initial postwar period, the 1950s were a transformational decade in the program's history: benefit amounts were increased substantially, coverage under the program became close to universal, and a new disability insurance benefit was offered. The 1960s witnessed additional growth in Social Security, but the most important development in social insurance occurred in health insurance, with the creation of the Medicare program in 1965. Legislative actions in the 1970s had profound effects on the Social Security program and, indeed, set the stage for many of today's reform debates. Large benefit increases, a new benefit formula that was erroneously generous, and other changes in the early 1970s created a situation in which annual program costs, as a share of gross domestic product, increased during a 12-year period from about 3 percent to 5 percent. In 1977, amendments to the Act corrected the flawed benefit formula and made other changes in the financing of the system to shore up the program. Thus, the 1970s represent a watershed in the program's history—program growth gave way to increasing concerns about the program's finances.
Those concerns were reflected in the amendments to the Act in 1983, which were the last major changes to the program. These amendments, based largely on recommendations from a commission chaired by Alan Greenspan, adjusted benefits and taxes to address pressing near-term financing problems faced by the system. Although the Greenspan Commission focused to a large extent on short-range issues, the resulting reforms have generated large surpluses in the program and the buildup of a substantial trust fund. However, the looming retirement of the baby boomers and several other demographic factors will, according to projections, result in the exhaustion of the trust fund by 2042.
Introduction
The original Social Security Act, signed into law on August 14, 1935, grew out of the work of the Committee on Economic Security, a cabinet-level group appointed by President Franklin D. Roosevelt just one year earlier. The Act created several programs that, even today, form the basis for the government's role in providing income security, specifically, the old-age insurance, unemployment insurance, and Aid to Families with Dependent Children (AFDC) programs. The old-age program is, of course, the precursor to today's Old-Age, Survivors, and Disability Insurance, or Social Security, program. Unemployment insurance continues to this day, and AFDC is the forerunner to the current Temporary Assistance for Needy Families program. The original Act also provided federal support for means-tested old-age assistance programs run by the states, which were eventually transformed into the current Supplemental Security Income (SSI) program. The original Act also contained provisions allowing for research on the topic of health insurance, but the Medicare program would not come into existence until 30 years later.
Although the Great Depression was a catalyst for the creation of the Social Security program, the idea of social insurance predated the committee's work and the Depression. As early as the 1880s, Germany had built a social insurance program (one requiring contributions from workers) that provided for sickness, maternity, and old-age benefits.1 Some authors have linked Germany's early adoption of social insurance programs to its rapid industrialization in the latter half of the 19th century (Schottland 1963, 15; Schieber and Shoven 1999, 17). A significant period of industrialization and urbanization also preceded the advent of social insurance programs in the United States. In 1880, the populations of farm and nonfarm workers were about equally balanced, but by 1930, workers in farm occupations accounted for only 21 percent of the workforce (Census Bureau 1956, 195).
As the nation industrialized, increasing numbers of Americans depended on wage income (and less on family-based structures typical of a farm economy). Further, Schieber and Shoven (1999) argue that wage income, even before the Depression, was volatile. From 1905 to 1909, the nonfarm unemployment rate varied widely (ranging from 3.9 percent to 16.4 percent), with a similarly wide range (4.1 percent to 19.5 percent) occurring from 1920 to 1924 (Schieber and Shoven 1999, 19). Older workers, in particular, often bore the brunt of economic downturns.2 Cyclical swings in the economy were not the only concern. Lost wages due to disability, death, or retirement were also seen as problems not adequately dealt with by the structures of an industrial economy. Academic and political interest grew in social insurance plans that would smooth out the volatility of income or, said differently, insure against fluctuations in labor-market income.
The Great Depression no doubt crystallized these concerns (the nonfarm unemployment rate stood at 34 percent in 1932 [McSteen 1985, 37]) and made the creation of the Social Security program politically possible. Frances Perkins (who as secretary of labor headed the Committee on Economic Security) recalled:
I've always said, and I still think we have to admit, that no matter how much fine reasoning there was about the old-age insurance system and the unemployment insurance prospects—no matter how many people were studying it, or how many committees had ideas on the subject, or how many college professors had written theses on the subject—and there were an awful lot of them—the real roots of the Social Security Act were in the Great Depression of 1929. Nothing else would have bumped the American people into a social security system except something so shocking, so terrifying, as that depression (Perkins 1962).
It is interesting that the features of the old-age insurance program were not, however, generally designed to provide immediate relief from the effects of the Depression. As an explanation, it is useful to contrast the early Social Security program with its main "rival" of the time—a plan developed by Francis E. Townsend (a retired California doctor). The Townsend plan, which was noncontributory, offered persons 60 and older a pension of $200 a month, provided that they did not work and that they spent the entire pension each month (DeWitt 2001). The Townsend plan was unrealistic (among other things, costs were prohibitive) and was never enacted, but it was popular because it focused on the economic conditions of the day. The large $200 pension (average wages at the time were only $100 a month) and the spend-down requirement were meant to immediately end poverty among the elderly and to stimulate the economy. In contrast, as will be seen in the next section, the original Social Security program was small, contributory, and phased in. Thus, although the Depression led to the creation of the Social Security program, it did not, in general, shape its features.
In Chart 1, a timeline of key milestones in the history of the Social Security program is presented with an overview of selected program changes and demographic events, from the start of the program in 1935 up through 2003.
Overview of changes in the Social Security program, demographic events, and milestones
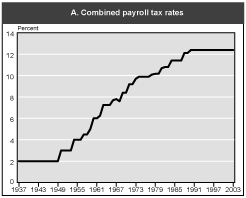
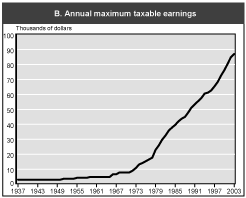
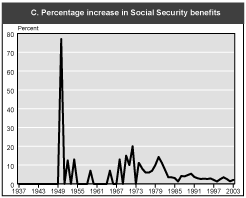
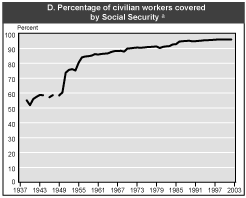
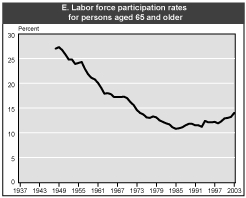
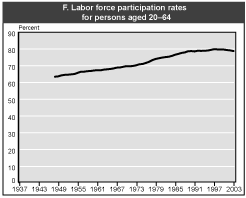
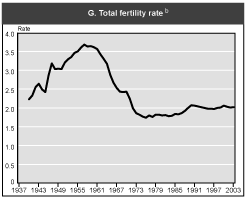
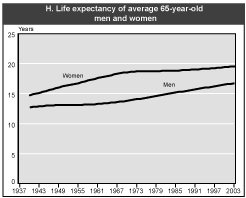
| Year | Combined payroll tax rates (%) | Annual maximum taxable earnings ($) | Percentage increase in Social Security benefits | Percentage of civilian workers covered by Social Security a | Labor force participation rates (%) for persons aged— | Total fertility rate (%) b | Life expectancy of average 65-year-old | ||
|---|---|---|---|---|---|---|---|---|---|
| 65 and older | 20–64 | Men | Women | ||||||
| 1937 | 2.00 | 3,000 | 0 | -- | -- | -- | -- | -- | -- |
| 1938 | 2.00 | 3,000 | 0 | -- | -- | -- | -- | -- | -- |
| 1939 | 2.00 | 3,000 | 0 | 55.1 | -- | -- | -- | -- | -- |
| 1940 | 2.00 | 3,000 | 0 | 51.9 | -- | -- | 2.23 | 12.7 | 14.7 |
| 1941 | 2.00 | 3,000 | 0 | 56.0 | -- | -- | 2.33 | 12.8 | 14.9 |
| 1942 | 2.00 | 3,000 | 0 | 57.5 | -- | -- | 2.55 | 12.8 | 15.0 |
| 1943 | 2.00 | 3,000 | 0 | 58.7 | -- | -- | 2.64 | 12.9 | 15.1 |
| 1944 | 2.00 | 3,000 | 0 | 58.6 | -- | -- | 2.49 | 12.9 | 15.3 |
| 1945 | 2.00 | 3,000 | 0 | -- | -- | -- | 2.42 | 13.0 | 15.4 |
| 1946 | 2.00 | 3,000 | 0 | 57.2 | -- | -- | 2.86 | 13.0 | 15.6 |
| 1947 | 2.00 | 3,000 | 0 | 58.6 | -- | -- | 3.18 | 13.0 | 15.7 |
| 1948 | 2.00 | 3,000 | 0 | -- | 27.0 | 63.5 | 3.03 | 13.1 | 15.9 |
| 1949 | 2.00 | 3,000 | 0 | 58.4 | 27.3 | 63.7 | 3.04 | 13.1 | 16.0 |
| 1950 | 3.00 | 3,000 | 77.0 | 60.5 | 26.7 | 64.3 | 3.03 | 13.1 | 16.2 |
| 1951 | 3.00 | 3,600 | 0 | 73.7 | 25.8 | 64.6 | 3.20 | 13.1 | 16.3 |
| 1952 | 3.00 | 3,600 | 12.5 | 75.6 | 24.8 | 64.7 | 3.29 | 13.1 | 16.4 |
| 1953 | 3.00 | 3,600 | 0 | 76.1 | 24.8 | 64.9 | 3.35 | 13.1 | 16.5 |
| 1954 | 4.00 | 3,600 | 13.0 | 75.2 | 23.9 | 65.1 | 3.46 | 13.1 | 16.6 |
| 1955 | 4.00 | 4,200 | 0 | 80.5 | 24.1 | 65.8 | 3.50 | 13.1 | 16.7 |
| 1956 | 4.00 | 4,200 | 0 | 84.0 | 24.3 | 66.5 | 3.60 | 13.1 | 16.9 |
| 1957 | 4.50 | 4,200 | 0 | 84.6 | 22.9 | 66.5 | 3.68 | 13.2 | 17.0 |
| 1958 | 4.50 | 4,200 | 0 | 84.8 | 21.8 | 66.8 | 3.63 | 13.2 | 17.2 |
| 1959 | 5.00 | 4,800 | 7.0 | 85.2 | 21.1 | 66.9 | 3.64 | 13.2 | 17.3 |
| 1960 | 6.00 | 4,800 | 0 | 86.2 | 20.8 | 67.2 | 3.61 | 13.2 | 17.4 |
| 1961 | 6.00 | 4,800 | 0 | 85.9 | 20.1 | 67.4 | 3.56 | 13.3 | 17.6 |
| 1962 | 6.25 | 4,800 | 0 | 86.3 | 19.1 | 67.3 | 3.42 | 13.3 | 17.7 |
| 1963 | 7.25 | 4,800 | 0 | 86.5 | 17.9 | 67.7 | 3.30 | 13.4 | 17.8 |
| 1964 | 7.25 | 4,800 | 0 | 86.7 | 18.0 | 67.9 | 3.17 | 13.4 | 17.9 |
| 1965 | 7.25 | 4,800 | 7.0 | 87.6 | 17.8 | 68.1 | 2.88 | 13.5 | 18.0 |
| 1966 | 7.70 | 6,600 | 0 | 88.2 | 17.2 | 68.4 | 2.67 | 13.5 | 18.2 |
| 1967 | 7.80 | 6,600 | 0 | 88.3 | 17.2 | 68.9 | 2.53 | 13.6 | 18.3 |
| 1968 | 7.60 | 7,800 | 13.0 | 88.4 | 17.2 | 69.0 | 2.43 | 13.7 | 18.4 |
| 1969 | 8.40 | 7,800 | 0 | 87.9 | 17.3 | 69.4 | 2.42 | 13.7 | 18.5 |
| 1970 | 8.40 | 7,800 | 15.0 | 89.9 | 17.0 | 69.8 | 2.43 | 13.8 | 18.5 |
| 1971 | 9.20 | 7,800 | 10.0 | 90.1 | 16.2 | 69.7 | 2.25 | 13.9 | 18.6 |
| 1972 | 9.20 | 9,000 | 20.0 | 90.4 | 15.6 | 69.9 | 1.99 | 14.0 | 18.6 |
| 1973 | 9.70 | 10,800 | 0 | 90.6 | 14.6 | 70.3 | 1.86 | 14.1 | 18.7 |
| 1974 | 9.90 | 13,200 | 11.0 | 90.5 | 14.0 | 70.9 | 1.82 | 14.1 | 18.7 |
| 1975 | 9.90 | 14,100 | 8.0 | 90.6 | 13.7 | 71.1 | 1.77 | 14.2 | 18.7 |
| 1976 | 9.90 | 15,300 | 6.4 | 90.9 | 13.1 | 71.7 | 1.74 | 14.3 | 18.7 |
| 1977 | 9.90 | 16,500 | 5.9 | 91.0 | 13.0 | 72.4 | 1.80 | 14.4 | 18.7 |
| 1978 | 10.10 | 17,700 | 6.5 | 91.2 | 13.3 | 73.4 | 1.76 | 14.5 | 18.7 |
| 1979 | 10.16 | 22,900 | 9.9 | 91.3 | 13.1 | 74.1 | 1.82 | 14.6 | 18.7 |
| 1980 | 10.16 | 25,900 | 14.3 | 90.3 | 12.5 | 74.5 | 1.82 | 14.7 | 18.7 |
| 1981 | 10.70 | 29,700 | 11.2 | 91.1 | 12.2 | 74.9 | 1.80 | 14.8 | 18.8 |
| 1982 | 10.80 | 32,400 | 7.4 | 91.4 | 11.9 | 75.2 | 1.81 | 14.9 | 18.8 |
| 1983 | 10.80 | 35,700 | 3.5 | 91.6 | 11.7 | 75.4 | 1.78 | 15.0 | 18.8 |
| 1984 | 11.40 | 37,800 | 3.5 | 92.7 | 11.1 | 75.9 | 1.79 | 15.1 | 18.8 |
| 1985 | 11.40 | 39,600 | 3.1 | 92.9 | 10.8 | 76.6 | 1.84 | 15.2 | 18.8 |
| 1986 | 11.40 | 42,000 | 1.3 | 94.6 | 10.9 | 77.1 | 1.83 | 15.3 | 18.8 |
| 1987 | 11.40 | 43,800 | 4.2 | 94.9 | 11.1 | 77.7 | 1.86 | 15.3 | 18.9 |
| 1988 | 12.12 | 45,000 | 4.0 | 95.0 | 11.5 | 78.0 | 1.92 | 15.4 | 18.9 |
| 1989 | 12.12 | 48,000 | 4.7 | 95.2 | 11.8 | 78.7 | 2.00 | 15.5 | 18.9 |
| 1990 | 12.40 | 51,300 | 5.4 | 94.8 | 11.8 | 78.8 | 2.07 | 15.6 | 19.0 |
| 1991 | 12.40 | 53,400 | 3.7 | 94.9 | 11.5 | 78.6 | 2.06 | 15.7 | 19.0 |
| 1992 | 12.40 | 55,500 | 3.0 | 95.1 | 11.5 | 79.0 | 2.04 | 15.8 | 19.0 |
| 1993 | 12.40 | 57,600 | 2.6 | 95.3 | 11.2 | 78.9 | 2.02 | 15.9 | 19.1 |
| 1994 | 12.40 | 60,600 | 2.8 | 95.6 | 12.4 | 79.0 | 2.00 | 16.0 | 19.1 |
| 1995 | 12.40 | 61,200 | 2.6 | 95.6 | 12.1 | 79.1 | 1.98 | 16.0 | 19.1 |
| 1996 | 12.40 | 62,700 | 2.9 | 95.7 | 12.1 | 79.5 | 1.98 | 16.1 | 19.2 |
| 1997 | 12.40 | 65,400 | 2.1 | 95.9 | 12.2 | 79.9 | 1.97 | 16.2 | 19.2 |
| 1998 | 12.40 | 68,400 | 1.3 | 96.0 | 11.9 | 79.8 | 2.00 | 16.3 | 19.3 |
| 1999 | 12.40 | 72,600 | 2.5 | 96.0 | 12.3 | 79.8 | 2.01 | 16.4 | 19.3 |
| 2000 | 12.40 | 76,200 | 3.5 | 96.0 | 12.9 | 79.7 | 2.06 | 16.5 | 19.4 |
| 2001 | 12.40 | 80,400 | 2.6 | 96.0 | 13.0 | 79.4 | 2.03 | 16.6 | 19.4 |
| 2002 | 12.40 | 84,900 | 1.4 | 96.0 | 13.2 | 79.2 | 2.01 | 16.6 | 19.5 |
| 2003 | 12.40 | 87,000 | 2.1 | -- | 14.0 | 78.8 | 2.02 | 16.7 | 19.5 |
| NOTE: -- = not available. | |||||||||
1930s: Program Beginnings
The original Social Security Act of 1935 was amended even before the program became truly operational, but some of the principles embodied in the Act still underlie the program today. In addition, the fundamental changes made by the amendments in 1939 are, to a surprising degree, reflective of current policy debates regarding Social Security.3
The original Act provided for monthly retirement benefits, payable to persons 65 and older who were no longer working. The benefit formula was based on cumulative wages (earned since 1937) in covered employment (initially covering only about half the jobs in the country, which were in commerce or industry). Specifically, monthly benefits equaled 1/2 of 1 percent of the first $3,000 of cumulative wages, plus 1/12 of 1 percent of the next $42,000, plus 1/24 of 1 percent of the next $84,000. So, for example, someone who retired in January 1942 (when benefits were scheduled to begin) after earning a total of $6,000 during the 5-year period from 1937 to 1941 would receive a benefit equal to $17.50 a month.4 This can be thought of, loosely speaking, as a typical benefit because the average worker at the time earned about $100 a month (which totals $6,000 after 5 years).5 Thus, although the Social Security Act was enacted in the middle of the Great Depression, it originally envisioned relatively small benefits that were not payable for several years.
This preceding benefit formula never became operational because of the amendments of 1939. Nevertheless, it does embody two important principles that still guide benefit payments today: benefits depend on work in covered employment, and benefits replace a higher proportion of earnings for low earners.
The 1939 amendments made a seemingly subtle but, in reality, a fundamental change to the benefit formula. Retirement benefits were to be based on average wages, not cumulative wages. Specifically, they equaled 40 percent of the first $50 of average monthly wages (AMW) in covered employment, plus 10 percent of the next $200 of AMW. This basic benefit was increased by a 1 percent bonus for each year the worker earned at least $200 in covered wages. To illustrate, consider again the worker who averages $100 a month during the period 1937 to 1941 (that is, AMW = $100). The monthly retirement benefit equals $26.25 in this case, or 50 percent more than was payable ($17.50) under the original Act. This specific result (more generous benefits) holds generally for persons reaching retirement in the early years of the program. However, because policymakers desired to make the amendments of 1939 cost neutral over the long term, the reverse is true for those who reached retirement after the Social Security program had matured. For example, a worker retiring in 1977 after 40 years in covered employment earning $100 per month would receive $51.25 under the Act of 1935 but only $35 under the amendments of 1939. In sum, with regard to retirement benefits, the amendments of 1939 shifted benefit amounts to early participants in the program and away from later participants.
Retirement benefits, under the 1935 Act, were to be paid only if the individual was no longer engaged in regular employment. The 1939 amendments defined the test of retirement (commonly referred to as the retirement earnings test) as earnings of less than $15 a month; earnings in excess of this amount precluded payment of benefits. Changes to the earnings test are an important policy theme in Social Security's history. In fact, in 2000, the retirement earnings test was completely repealed for beneficiaries older than the currently defined full retirement age. In 1939, the amendments to the Act also ended what some have called the "money-back guarantee" provision. Under the Act of 1935, a lump sum equal to 3.5 percent of cumulative wages was issued to workers who did not qualify for retirement benefits (because either they died before the age of 65 or they were not insured under the program rules). For persons who did receive retirement benefits, the lump sum paid to their estates upon death was equal to 3.5 percent of wages minus the sum of retirement benefits paid over the person's life. Because payroll taxes on the employee, under the 1935 Act, were not scheduled to rise above 3 percent of wages, the provision guaranteed that all workers in covered employment (or their estates) would, at minimum, have their payroll taxes refunded to them.
The amendments of 1939 also ushered in one of the most fundamental developments in the program's history, namely, the creation of dependent benefits and survivor benefits. A wife of a retired worker was eligible for a 50 percent benefit, provided she was at least 65. Aged widows (and those caring for dependent children) were eligible for benefits paid at a 75 percent rate. (Spouse and survivor benefits were not available to men until later in the program's history.) Dependent children of retired or deceased workers received a 50 percent benefit. The addition of these benefits, coupled with the switch from benefit computations based on cumulative wages to those based on average wages, reinforced the insurance principles of the program and downplayed a savings or money-back approach. (In fact, the specific money-back guarantee provision was replaced with a smaller lump-sum death payment to some survivors.) Consider a worker who died at a relatively young age and, because of that, had small cumulative wages under Social Security. Under the Act of 1935, such a worker would have had a small payment (3.5 percent of his small cumulative earnings) issued to his estate. According to the Act of 1939, monthly benefit amounts could be paid to members of his family (for many years) on the basis of his average monthly earnings, not on his relatively short cumulative earnings history.
The original Social Security Act assessed—on both employees and employers—a 1 percent payroll tax on the first $3,000 of annual earnings, starting in 1937. Beginning in 1940, the tax was scheduled to increase, reaching an ultimate rate in 1949 of 3 percent each on workers and employers (or a 6 percent combined rate). Because benefits were not scheduled to begin until 1942, the program was scheduled to build up a sizable reserve in the early years. The amendments of 1939 delayed the scheduled tax increases, and subsequent legislation further deferred them, with the result being that the 1 percent rate continued to be applied until 1950. Again, though, the 1935 Act set a basic framework for today's Social Security program, whereby benefits are largely financed by payroll taxes assessed equally on employees and employers.
In sum, the amendments of 1939 shifted benefits toward early participants and away from later participants in the Social Security program, the structure of benefits toward families rather than toward individuals, the focus of Social Security on insurance rather than on savings, and additional payroll taxes into the future. All of these changes would have important effects on the development of the program.
The shift in benefits to early participants, when coupled with delays in tax increases, prevented the buildup of a large reserve fund, which was a key goal of some policymakers. In fact, the Advisory Council on Social Security of 1938, whose work led to the 1939 amendments, was created in 1937 at the suggestion of Senator Arthur Vandenberg (R-MI). Vandenberg had a number of concerns regarding the large reserve funds that were being built up as a result of the original Social Security Act, one of which was that the government would not truly "save" the reserves but rather use them to finance spending on other federal initiatives.
The family benefit expansions were a priority of the Roosevelt administration and Social Security board chairman Arthur Altmeyer and led to protections for a number of economically vulnerable individuals. For example, since 1940, the Social Security program has awarded benefits to more than 41 million children, approximately half of whom have received benefits as a result of a parent's death. Approximately 25 million widow(er)s have been awarded benefits.6 Indeed, the concerns regarding adequate benefits for family members still resonate today. Many reform plans (from a variety of political viewpoints) call for increasing benefits paid to aged widow(er)s. The provision of family benefits, however, weakened the connection between contributions and benefits. For example, providing spouse or survivor benefits to persons who have not worked or paid taxes has generated considerable attention, in particular, with regard to how working women are treated relative to those who spend time out of the workforce to care for children or other family members.
The effort to shift benefits to early participants in the program and away from later participants was done for economic, distributional, and political reasons. Under the Act of 1935, Social Security benefits in the early years were projected, in many cases, to be quite low—often below amounts payable under some state old-age assistance programs. In addition, concerns about the overall economy in 1939 (which had slipped back into recession between 1937 and 1938) no doubt made policymakers reluctant to limit domestic spending (or to implement scheduled tax increases). Finally, there was probably substantial political appeal to shifting benefits to the early years (and postponing tax increases). In any event, this approach and, perhaps more importantly, other changes made later created a situation in which Social Security was a very good deal for participants in the start-up phase of the program but less so for future retirees.
1940s: The War Years and the Debate over Reserve Funding
The debate over whether the program should build up a large reserve (or trust fund) to pay future benefits continued in the 1940s. As previously discussed, the Act of 1939 was partly a result of Senator Vandenberg's explicit efforts to reduce the buildup of reserves. However, the robust wartime economy of the 1940s led to higher-than-expected payroll tax revenues and fewer-than-expected retirement claims, resulting in an accelerated trust fund buildup relative to projections. The congressional response to the acceleration of the reserve buildup was to prevent the scheduled increases in the payroll tax from taking effect. As a result, by the end of the 1940s, the payroll tax still stood at the 2 percent combined rate.
Although the Roosevelt administration agreed to the revisions of the tax schedule in the amendments of 1939, it generally opposed the payroll tax freezes that occurred during the 1940s (Schieber and Shoven 1999). Indeed, President Roosevelt vetoed the legislation in 1943 that prevented a scheduled tax increase from taking effect, but the veto was overridden in Congress. The Roosevelt administration argued that it was inappropriate to leave future administrations and Congresses with large benefit liabilities (once the program matured) and a limited reserve fund. However, a coalition of lawmakers who were opposed to reserve funding and tax increases prevailed. The paradox of the 1940s is that the robust economy led to a substantial buildup of reserves (even at the 2 percent combined payroll tax rate) but that proponents of the reserve approach to financing lost the political argument over tax increases. As a result, debates about reserve funding died down until the amendments of 1977 and 1983, and the Social Security program operated for many years as if it were approximately following a pay-as-you-go, or pay-go, approach to funding benefits.7
1950s: Toward a Universal Program
One of the most striking facts about Social Security on the eve of its 15th anniversary was its relatively small size. In 1949, the means-tested old-age assistance programs administered by the states actually had twice as many beneficiaries as did Social Security's retirement program and, further, typically paid higher benefits (Schieber and Shoven 1999, 89). Some proponents of the Social Security program feared that the not yet mature system would be replaced by an expanded means-tested program or a noncontributory Townsend-like plan (Ball 1985). By the end of the 1950s, however, the system had been transformed through a series of amendments to the Social Security Act. At the end of the decade, the system had become much closer to being universal. In 1950, 61 percent of civilian workers were in jobs covered by Social Security, but by 1959, the figure exceeded 86 percent (Committee on Ways and Means 1992, 115). In addition, by decade's end, the Social Security program was paying much higher benefits and had added a new Disability Insurance (DI) component.
The amendments of 1950 brought 9 million workers into covered employment (Christgau 1960), including regularly employed farm and domestic workers and, with some exceptions, self-employed persons. These new workers would generally not have much in the way of covered earnings from 1937 to 1950. Except for those just beginning their careers, newly covered workers would thus receive low retirement benefits. A "new start" formula was instituted that allowed the computation of benefits on the basis of average monthly wages after 1950 (if that yielded higher benefits). Similar to the 1939 amendments, this policy reflected a choice by policymakers to award adequate retirement benefits to persons who may have worked (and paid taxes) in covered employment for only a short period of time.
The 1950s also witnessed the beginning of increases to various amounts specified early in the program's history. The cost of living had increased 72 percent during the decade of the 1940s (Christgau 1960), but the benefit formula remained unchanged. In 1950, the first general benefit increase in the program's history occurred, which averaged 77 percent (Table 1). General benefit increases legislated in 1952, 1954, and 1958 further increased benefits by 12.5 percent, 13 percent, and 7 percent, respectively. Although these benefit increases were ad hoc, they set the stage for the automatic inflation adjustments applied to benefits today. In a pay-go framework, benefit increases require increases in payroll tax revenue. The taxable maximum (also referred to as the wage base), which is the maximum level of annual earnings to which the payroll tax is applied, rose by 60 percent during the 1950s, and the combined payroll tax rate climbed from 2.0 percent in 1949 to 3.0 percent in 1950 and reached 5.0 percent by 1959.
| Year | Average benefit increase (percent) |
Payroll tax rate, combined (percent) |
Taxable maximum (dollars) |
|---|---|---|---|
| 1950 | 77.0 | 3.0 | 3,000 |
| 1951 | . . . | 3.0 | 3,600 |
| 1952 | 12.5 | 3.0 | 3,600 |
| 1953 | . . . | 3.0 | 3,600 |
| 1954 | 13.0 | 4.0 | 3,600 |
| 1955 | . . . | 4.0 | 4,200 |
| 1956 | . . . | 4.0 | 4,200 |
| 1957 | . . . | 4.5 | 4,200 |
| 1958 | 7.0 | 4.5 | 4,200 |
| 1959 | . . . | 5.0 | 4,800 |
| SOURCES: Social Security Administration (SSA 2003, Tables 2.A3 and 2.A16) and Christgau (1960). | |||
| NOTES: "Average benefit increases" are listed by year of amendments; other figures are listed by year they were in effect.
. . . = not applicable.
|
|||
The payroll tax increase in 1957 was to fund the new Disability Insurance program. Initially, to hold down costs, disabled-worker benefits were limited to persons between the ages of 50 and 64 and were received by a relatively small number of persons (around 330,000 in 1959). Today, disabled workers can be of any age (under the full retirement age), and they number more than 5.5 million (SSA 2003, Table 5.A17).
Another change in the benefit structure, although affecting relatively small numbers of beneficiaries initially, occurred in the 1950s and set an important precedent. Women (but not men) were allowed to receive actuarially reduced retirement benefits as early as the age of 62.8 This option was later extended to men, and today most individuals claim benefits at the early retirement age of 62.9
1960s: Modest Changes in Cash Benefit Programs and the Birth of Medicare
The 1960s witnessed several changes to the Social Security program, but, in a sense, they followed the path laid out by the amendments of the 1950s.10 Several ad hoc increases were made to benefit levels, payroll taxes, and the taxable maximum. By the end of the decade, benefit levels had been increased twice (7 percent in 1965 and 13 percent in 1968), the combined payroll tax had reached 8.4 percent, and the taxable maximum stood at $7,800.11 In addition to the general benefit increases, which were designed to keep pace with inflation, the benefit rate for aged widow(er)s was increased from 75 percent to 82.5 percent of the deceased spouse's benefit. Finally, men were allowed to claim actuarially reduced retirement benefits at the age of 62, and the disability program was expanded to all ages under 65. Of course, the largest change in social insurance occurred not in the cash benefit programs, such as Social Security, but rather in the area of health insurance: the Medicare program was initiated in 1965.12
1970s: Program Expansion Gives Way to Financing Concerns
The 1970s were a watershed decade in program history. Benefit increases legislated by Congress accelerated sharply in the early 1970s, which when combined with difficult economic conditions and a fully mature Social Security program caused concern about the program's financial status. These concerns culminated in the first large-scale legislative efforts to control program size (the amendments of 1977). From that point forward, Social Security debates have no longer focused on expanding the program on a large scale but rather on limiting program growth or finding additional sources of revenue.
General benefits increased by 15 percent in January 1970 and by 10 percent in January 1971. Legislation in 1972 provided another 20 percent increase in benefits. A separate piece of legislation enacted that year increased the basic benefit rate for aged widow(er)s from 82.5 percent to 100 percent of the deceased spouse's benefit—in essence, a permanent increase of 21 percent in the benefit rate (over and above and separate from the general increases applying to all beneficiaries).13
In addition, in 1972, policymakers created a special minimum benefit, which was designed to help long-term, low-earning workers. A regular minimum benefit already existed (and had since the program's beginning), but it was often paid to workers who had short careers in covered employment rather than to workers who had low annual earnings. Legislation in 1977 froze the amount of the regular minimum benefit, and, 4 years later, it was abolished for newly eligible beneficiaries. The special minimum benefit continues to this day, although it affects a small and declining number of beneficiaries. It is important in a policy sense, however, because many current Social Security reform proposals have specific provisions that would increase benefits for low lifetime earners.
Although a 20 percent general benefit increase was paid in 1972, legislation in that year also incorporated provisions that would replace ad hoc increases with automatic adjustments based on price growth. Support for automatically linking benefit increases to inflation was provided by a variety of policymakers, including those who feared that the ad hoc approach led to a "political bidding up" of benefit levels (Myers 1993, 261). The legislation also called for adjusting taxable maximum amounts automatically (on the basis of wage growth). As it turned out, the technical approach to automatically adjusting benefit amounts was flawed, which provided successive cohorts of retirees with rapidly increasing benefit amounts. The flawed method was corrected by the amendments of 1977, but individuals eligible for benefits before 1979 were allowed to keep the windfall benefits, and those workers retiring as late as 1983 were partially protected under transitional guarantees.14 The amendments of 1977 also accelerated scheduled increases in the payroll tax and made near-term (ad hoc) increases to taxable maximum amounts.
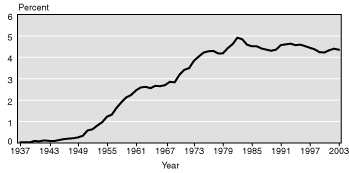
Program costs as a percentage of gross domestic product (GDP) peaked in 1982 at about 5 percent.15 Remarkably, just 12 years earlier, costs were approximately 3 percent of GDP. To put this in perspective, program costs as a percentage of GDP are projected to rise by about 2 percentage points during the next 25 years (Board of Trustees 2004, Table VI.F5)—a period that covers the retirement of the large baby-boom generation.
When discussing program expansion, it is worth mentioning the creation of the federal Supplemental Security Income program in 1972. This program replaced the means-tested old-age assistance programs that originated with the Social Security Act of 1935 (as well as the assistance programs for the disabled that occurred after 1935).16 The impetus for the new federal program was to provide a federal floor of protection (states can supplement federal SSI amounts) and to ensure consistency in eligibility rules. In 1980, 4.1 million persons received a total of $8 billion in SSI payments; the corresponding figures from the Social Security program for that year are 36 million and $120.5 billion (Census Bureau 2004, Tables 543 and 561). Thus, the Social Security expansions begun in the 1950s (along with the natural maturing of the program) ended any debate over whether income security for the elderly and disabled would primarily be handled through means-tested programs. By the end of the 1970s, and in reversal of the situation in 1950, means-tested programs for these groups had been eclipsed by a far more muscular Social Security program. Nevertheless, means-tested programs still serve an important role: they supplement the contributory social insurance programs by providing a minimum floor of income.
1980s: The Greenspan Commission and the Amendments of 1983
The last major amendments to the Social Security Act occurred in 1983.17 The amendments of 1983 are unusual in one sense: they were necessitated by severe short-term financial problems, but they have resulted in the long-run buildup of a large trust fund that will be drawn down as the baby boomers retire. The trust fund buildup has reignited debates, not heard since the 1940s, about reserve funding.
The amendments of 1983, to a large extent, followed the recommendation of the National Commission on Social Security Reform (commonly known as the Greenspan Commission after its chairman Alan Greenspan). The difficulties that led to the creation of the Greenspan Commission were economic in nature and largely unforeseen. Following the amendments of 1977, forecasts indicated that the system would be characterized by (marginally) adequate funds in the near term and surpluses in the 1990s and early 21st century. The economic conditions of the late 1970s and early 1980s exposed the near-term vulnerabilities of the amendments of 1977 (Myers 1996). This period was characterized by higher-than-expected inflation (which increased benefit payments) and lower-than-expected wages (which lowered payroll tax receipts). At the time of the Greenspan Commission, projections indicated that, by July 1983, revenues and trust fund assets would be insufficient to make benefit payments (National Commission on Social Security Reform 1983, Appendix J).
The Greenspan Commission acknowledged the short-term issues by explicitly adopting as its first goal the generation of $150 billion to $200 billion (from program savings or revenue increases) to get the system through the 1980s. It recommended (and Congress adopted) extending coverage to newly hired federal workers, subjecting a portion of Social Security benefits to income taxation (and dedicating the revenue to the trust fund), accelerating scheduled increases in the payroll tax rate, and delaying cost-of-living adjustments from June until December of each year. The commission concluded that, even without changes, the program would begin to run surpluses starting in the 1990s. The commission's recommendations, however, augmented those surpluses substantially. Finally, the commission discussed, but could not reach a consensus on, how to deal with long-range fiscal problems associated with the baby-boom generation. Some members supported an increase in the full retirement age under Social Security, while others supported future tax increases. Ultimately, Congress adopted a phased-in increase in the full retirement age beginning in 2000.
In the period following the 1983 amendments, the Social Security program has run annual surpluses (that is, payroll tax and other revenue exceed benefit payments and administrative costs), and a sizable ($1.5 trillion in 2004) and growing trust fund has materialized. The surpluses are invested in (and the trust fund holds) special-issue Treasury bonds. Echoing some of the debate in the early years of the program, considerable discussion has centered on whether the government truly saves the current Social Security surpluses.
The trust funds are clearly assets to the Social Security program and provide the legal authority to pay benefits once expenditures outstrip revenues, but debate remains concerning the economic significance of the surpluses. If, on the one hand, the surpluses have reduced government borrowing from the public, they can be linked to more funds available for private investment (thereby spurring economic growth) and, in addition, less public debt. Both outcomes put the government in a better position to deal with the retirement of the baby boomers, and thus, under this line of thought, the surpluses are saved. If, on the other hand, Congress reacts to the presence of the surpluses by spending more or taxing less than it would otherwise do, the surpluses do not reduce public borrowing and are not truly saved. Schieber and Shoven (1999, 207) argue that it is unlikely that the surpluses are fully saved, even when one accounts for the additional possibility that government has spent some of the surpluses on public investments (such as roads, education, and so on). The authors suggest that "maybe half, at best" of the surpluses represent savings in an economic sense. They acknowledge, however, that it is difficult to answer the question definitively. Thus, in the policy and research communities, a wide range of views on the topic exist.
An interesting side note to the debate over the surpluses concerns the initial and subsequent intent of policymakers. There is evidence that policymakers in 1983 did not discuss the trust fund accumulation in terms of the saving argument just outlined. Rather, to the extent that surpluses were considered, they may have been seen as safeguards from having to fix the program again in the near term. Policymakers were most likely stung by criticism in 1983 that the system needed an overhaul just 6 years after the amendments of 1977.18 The saving argument, however, has been discussed extensively since the amendments of 1983 and, unlike in the 1940s, Congress has allowed the scheduled payroll tax increases to take effect. The extent to which the Social Security surpluses increase national or aggregate saving is still an important (if unresolved) issue in the reform debate.
Recent Changes: The Retirement Earnings Test
Although relatively minor in the context of the overall program, the recent period has seen consistent policy action in one area: changes to Social Security's retirement earnings test (RET). As noted earlier, the RET was initially an all-or-nothing feature (that is, regular employment precluded benefit payment), which was applied at all ages. Over time, its features were liberalized, especially for older beneficiaries. The reasons for the liberalizations are many, but policymakers have shown a sustained concern over the long-run decline in labor force activity of older persons.19
By 1990, for persons aged 65 to 69, every $3 of annual earnings in excess of $9,360 reduced benefits by $1 (the test had already been eliminated by this time for those aged 70 and older). Earnings below $9,360 (the exempt amount) had no effect on benefits. In 1996, Congress sharply increased the exempt amounts for those at or above the full retirement age, and in 2000, it completely eliminated the test for this group.20 An earnings test still exists for early retirees and, importantly, for younger groups of beneficiaries, such as spouses and widow(er)s caring for dependent children.
Overview
Broadly, the history of the program can be divided into two periods: an expansionary period lasting approximately 40 years, which was followed by a period in which fiscal concerns were predominant. The original Act provided only for retired-worker benefits; today, benefits are payable to family members and divorced spouses. Further, Social Security originally covered only workers in commerce and industry (about half the workforce at the time), whereas more than 95 percent of jobs are now covered under the program. Benefit levels, which in the early years were often below amounts payable under old-age assistance programs administered by the states, have risen dramatically.
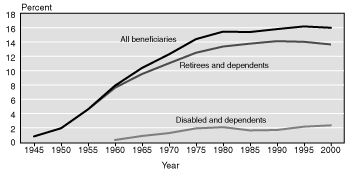
Before the 1950s, benefit payments were well under 1 percent of GDP, but thereafter they expanded rapidly. As a percentage of GDP, benefit payments peaked in 1982 at about 5 percent and now stand at 4.4 percent (Chart 2). By 2030, Social Security's claim on the economy is expected to rise to 6.3 percent of GDP (Board of Trustees 2004, Table VI.F5). In 1950, about 1 in 50 Americans received Social Security; currently, 1 in 6 does. After 1980, the number of beneficiaries relative to the total population begins to level off, however (Chart 3). Some authors have argued that the system reached maturity in the 1970s because the percentage of elderly receiving benefits (about 90 percent) matched the percentage of workers in covered employment (Schieber and Shoven 1999, 94–95).
Program costs as a percentage of gross domestic product, 1937–2003
| Year | Percent |
|---|---|
| 1937 | 0 |
| 1938 | 0 |
| 1939 | 0 |
| 1940 | 0.10 |
| 1941 | 0.08 |
| 1942 | 0.12 |
| 1943 | 0.10 |
| 1944 | 0.09 |
| 1945 | 0.13 |
| 1946 | 0.18 |
| 1947 | 0.20 |
| 1948 | 0.22 |
| 1949 | 0.26 |
| 1950 | 0.34 |
| 1951 | 0.59 |
| 1952 | 0.64 |
| 1953 | 0.82 |
| 1954 | 0.97 |
| 1955 | 1.23 |
| 1956 | 1.33 |
| 1957 | 1.65 |
| 1958 | 1.90 |
| 1959 | 2.13 |
| 1960 | 2.24 |
| 1961 | 2.46 |
| 1962 | 2.60 |
| 1963 | 2.62 |
| 1964 | 2.56 |
| 1965 | 2.67 |
| 1966 | 2.65 |
| 1967 | 2.70 |
| 1968 | 2.86 |
| 1969 | 2.83 |
| 1970 | 3.19 |
| 1971 | 3.42 |
| 1972 | 3.50 |
| 1973 | 3.84 |
| 1974 | 4.04 |
| 1975 | 4.22 |
| 1976 | 4.28 |
| 1977 | 4.30 |
| 1978 | 4.18 |
| 1979 | 4.19 |
| 1980 | 4.43 |
| 1981 | 4.62 |
| 1982 | 4.92 |
| 1983 | 4.84 |
| 1984 | 4.59 |
| 1985 | 4.52 |
| 1986 | 4.52 |
| 1987 | 4.41 |
| 1988 | 4.36 |
| 1989 | 4.31 |
| 1990 | 4.36 |
| 1991 | 4.57 |
| 1992 | 4.61 |
| 1993 | 4.64 |
| 1994 | 4.57 |
| 1995 | 4.59 |
| 1996 | 4.52 |
| 1997 | 4.44 |
| 1998 | 4.37 |
| 1999 | 4.24 |
| 2000 | 4.23 |
| 2001 | 4.33 |
| 2002 | 4.40 |
| 2003 | 4.35 |
Beneficiary populations as a percentage of the total U.S. population, by type of beneficiary, 1945–2000
| All beneficiaries | Retirees and dependents | Disabled and dependents | |
|---|---|---|---|
| 1945 | 0.79 | 0.79 | . . . |
| 1950 | 1.93 | 1.93 | . . . |
| 1955 | 4.58 | 4.58 | . . . |
| 1960 | 7.89 | 7.60 | 0.29 |
| 1965 | 10.37 | 9.53 | 0.85 |
| 1970 | 12.28 | 11.03 | 1.25 |
| 1975 | 14.41 | 12.50 | 1.91 |
| 1980 | 15.46 | 13.37 | 2.08 |
| 1985 | 15.40 | 13.78 | 1.63 |
| 1990 | 15.81 | 14.13 | 1.68 |
| 1995 | 16.19 | 14.04 | 2.15 |
| 2000 | 16.00 | 13.66 | 2.34 |
| NOTE: . . . = not applicable. | |||
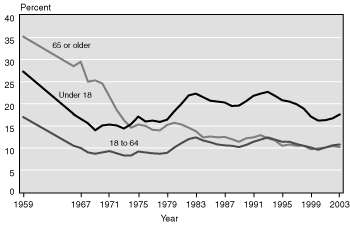
Although the system has become larger and more expensive, Social Security growth has very likely affected the incidence of poverty among the elderly. The poverty rate among the elderly has fallen from 35.2 percent in 1959 to 10.2 percent today, with sharp declines in poverty occurring in the 1970s. It has been on par with that of the working-age population since the early 1990s and below the rate for children since the mid-1970s (Chart 4). The poverty rate of the working-age population has not exhibited a strong trend since the mid-1960s, and today's poverty rate for that group (10.8 percent) is close to that which prevailed in 1966 (10.5 percent).
Poverty rates of various age groups, 1959–2003
| Year | Under 18 | 18 to 64 | 65 or older |
|---|---|---|---|
| 1959 | 27.3 | 17.0 | 35.2 |
| 1966 | 17.6 | 10.5 | 28.5 |
| 1967 | 16.6 | 10.0 | 29.5 |
| 1968 | 15.6 | 9.0 | 25.0 |
| 1969 | 14.0 | 8.7 | 25.3 |
| 1970 | 15.1 | 9.0 | 24.6 |
| 1971 | 15.3 | 9.3 | 21.6 |
| 1972 | 15.1 | 8.8 | 18.6 |
| 1973 | 14.4 | 8.3 | 16.3 |
| 1974 | 15.4 | 8.3 | 14.6 |
| 1975 | 17.1 | 9.2 | 15.3 |
| 1976 | 16.0 | 9.0 | 15.0 |
| 1977 | 16.2 | 8.8 | 14.1 |
| 1978 | 15.9 | 8.7 | 14.0 |
| 1979 | 16.4 | 8.9 | 15.2 |
| 1980 | 18.3 | 10.1 | 15.7 |
| 1981 | 20.0 | 11.1 | 15.3 |
| 1982 | 21.9 | 12.0 | 14.6 |
| 1983 | 22.3 | 12.4 | 13.8 |
| 1984 | 21.5 | 11.7 | 12.4 |
| 1985 | 20.7 | 11.3 | 12.6 |
| 1986 | 20.5 | 10.8 | 12.4 |
| 1987 | 20.3 | 10.6 | 12.5 |
| 1988 | 19.5 | 10.5 | 12.0 |
| 1989 | 19.6 | 10.2 | 11.4 |
| 1990 | 20.6 | 10.7 | 12.2 |
| 1991 | 21.8 | 11.4 | 12.4 |
| 1992 | 22.3 | 11.9 | 12.9 |
| 1993 | 22.7 | 12.4 | 12.2 |
| 1994 | 21.8 | 11.9 | 11.7 |
| 1995 | 20.8 | 11.4 | 10.5 |
| 1996 | 20.5 | 11.4 | 10.8 |
| 1997 | 19.9 | 10.9 | 10.5 |
| 1998 | 18.9 | 10.5 | 10.5 |
| 1999 | 17.1 | 10.1 | 9.7 |
| 2000 | 16.2 | 9.6 | 9.9 |
| 2001 | 16.3 | 10.1 | 10.1 |
| 2002 | 16.7 | 10.6 | 10.4 |
| 2003 | 17.6 | 10.8 | 10.2 |
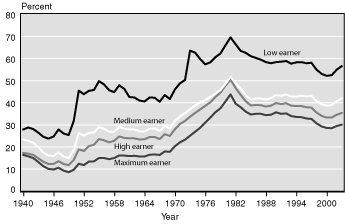
Replacement rates—the percentage of earnings replaced by benefits—rose through 1981 but have stabilized below peak values as a result of the amendments of 1977 (Chart 5). Today, replacement rates for medium earners retiring at the age of 65 are about 42 percent. The rates for high and low earners are 35 percent and 56 percent, respectively.21 Financial advisors often recommend having retirement income sufficient to replace 60 percent to 80 percent of preretirement earnings (EBRI 1996–2005), but even from the program's earliest days, policymakers have expected individuals to supplement Social Security with savings, pensions, and other income.
Replacement rates for scaled workers retiring at age 65, by type of earner, 1940–2003
| Year | Low Earner | Medium earner | High earner | Maximum earner |
|---|---|---|---|---|
| 1940 | 27.9 | 23.4 | 17.3 | 16.4 |
| 1941 | 28.8 | 22.8 | 17.0 | 15.8 |
| 1942 | 28.1 | 21.9 | 16.4 | 15.0 |
| 1943 | 26.5 | 19.9 | 14.9 | 13.2 |
| 1944 | 24.6 | 17.5 | 13.3 | 11.3 |
| 1945 | 23.8 | 16.1 | 12.3 | 10.1 |
| 1946 | 24.7 | 15.9 | 12.3 | 9.8 |
| 1947 | 27.9 | 17.5 | 13.6 | 10.6 |
| 1948 | 26.1 | 15.7 | 12.3 | 9.3 |
| 1949 | 25.4 | 15.0 | 11.8 | 8.6 |
| 1950 | 31.7 | 18.6 | 14.1 | 9.7 |
| 1951 | 45.5 | 26.3 | 18.9 | 12.4 |
| 1952 | 43.9 | 25.2 | 18.2 | 11.8 |
| 1953 | 45.4 | 26.4 | 20.4 | 13.4 |
| 1954 | 45.8 | 26.6 | 21.0 | 13.5 |
| 1955 | 49.8 | 29.0 | 23.6 | 15.0 |
| 1956 | 48.3 | 28.2 | 23.0 | 15.0 |
| 1957 | 45.7 | 26.9 | 22.1 | 14.5 |
| 1958 | 44.8 | 26.9 | 22.8 | 15.0 |
| 1959 | 47.9 | 29.1 | 24.8 | 16.2 |
| 1960 | 46.3 | 28.3 | 24.1 | 16.1 |
| 1961 | 42.6 | 27.9 | 23.9 | 15.9 |
| 1962 | 42.4 | 27.9 | 23.9 | 16.0 |
| 1963 | 41.0 | 27.1 | 23.4 | 15.7 |
| 1964 | 40.6 | 27.0 | 23.5 | 15.7 |
| 1965 | 42.4 | 28.3 | 24.5 | 16.5 |
| 1966 | 42.3 | 28.4 | 24.5 | 16.6 |
| 1967 | 40.5 | 27.3 | 23.6 | 16.4 |
| 1968 | 43.5 | 29.5 | 25.8 | 18.0 |
| 1969 | 41.7 | 28.4 | 25.0 | 17.8 |
| 1970 | 46.0 | 31.7 | 28.0 | 20.3 |
| 1971 | 48.8 | 33.8 | 30.4 | 22.1 |
| 1972 | 50.3 | 35.3 | 31.8 | 23.3 |
| 1973 | 63.6 | 37.1 | 33.7 | 25.1 |
| 1974 | 62.7 | 38.7 | 35.4 | 26.9 |
| 1975 | 59.8 | 40.2 | 37.0 | 28.7 |
| 1976 | 57.4 | 41.3 | 38.6 | 31.0 |
| 1977 | 58.3 | 42.6 | 40.2 | 33.3 |
| 1978 | 60.6 | 44.2 | 42.6 | 35.7 |
| 1979 | 62.3 | 45.7 | 44.6 | 37.5 |
| 1980 | 66.0 | 48.6 | 47.7 | 40.6 |
| 1981 | 69.6 | 51.7 | 50.5 | 43.8 |
| 1982 | 66.5 | 48.9 | 46.7 | 39.6 |
| 1983 | 63.5 | 46.4 | 43.6 | 38.0 |
| 1984 | 62.6 | 43.5 | 40.7 | 36.0 |
| 1985 | 61.1 | 41.5 | 38.8 | 34.7 |
| 1986 | 60.3 | 41.9 | 39.0 | 35.0 |
| 1987 | 59.5 | 42.0 | 38.9 | 35.0 |
| 1988 | 58.4 | 41.5 | 38.3 | 34.4 |
| 1989 | 57.9 | 42.1 | 38.7 | 34.6 |
| 1990 | 58.4 | 43.5 | 39.9 | 35.7 |
| 1991 | 58.6 | 43.1 | 39.4 | 35.0 |
| 1992 | 58.9 | 43.8 | 39.8 | 35.2 |
| 1993 | 57.7 | 42.8 | 38.7 | 34.0 |
| 1994 | 58.3 | 42.8 | 38.5 | 33.6 |
| 1995 | 58.4 | 43.2 | 38.5 | 33.5 |
| 1996 | 57.9 | 42.9 | 38.0 | 32.9 |
| 1997 | 58.1 | 43.1 | 37.8 | 32.7 |
| 1998 | 55.0 | 40.8 | 35.6 | 30.7 |
| 1999 | 53.1 | 39.4 | 34.1 | 29.3 |
| 2000 | 52.2 | 38.7 | 33.3 | 28.6 |
| 2001 | 52.5 | 39.0 | 33.3 | 28.5 |
| 2002 | 55.0 | 40.8 | 34.6 | 29.5 |
| 2003 | 56.6 | 42.0 | 35.4 | 30.1 |
Although expansion was the focus of policymakers in the first four decades of the program's history, the dominant concern in the modern period has been the long-range financial status of the program. The 1977 amendments mark the start of the second phase in the program's history, which focused on stabilizing costs and securing adequate revenue. Even during the second phase, however, relatively minor expansions of the program have taken place, and it is possible in the context of broader reform that additional expansion could occur if Congress were to address concerns regarding the economic status of particular beneficiary groups, such as widow(er)s or low lifetime earners.
There are some important historical subtexts to the current reform debate. For example, Social Security developed in such a way that many early participants (as well as many current beneficiaries) received a very good deal on their Social Security taxes (CBO 2004). This transfer of wealth to earlier program participants may or may not have been good social policy, but it cannot be undone and does influence today's reform discussions regarding rates of return on payroll taxes and system financing.
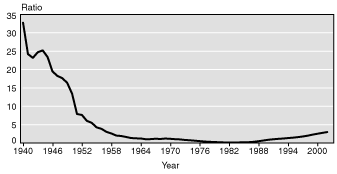
In addition, the issue over reserve funding has resurfaced in the modern era. Trust fund ratios, which are the ratios of the trust fund to annual benefit payments and other costs in a given year, are very high in the early years of the Social Security program but decline sharply in the 1940s (Chart 6). The decline in the 1940s is, to a large extent, the natural result of the start-up phase of the new system, when the number of beneficiaries grew rapidly. However, as discussed earlier, policy changes also helped put the system on the path of (approximate) pay-go financing. Large surpluses returned following the amendments of 1983, and, today, the $1.5 trillion trust fund is about three times the size of annual expenditures. The large trust fund has generated debate about reserve funding and whether the government truly saves the annual surpluses. As important as this debate is, it is worth noting that even with trust fund financing the current system is insolvent over the long term.22
Historical trust fund ratios of assets to expenditures, 1940–2002
| Year | Ratio |
|---|---|
| 1940 | 32.76 |
| 1941 | 24.23 |
| 1942 | 23.19 |
| 1943 | 24.72 |
| 1944 | 25.23 |
| 1945 | 23.42 |
| 1946 | 19.50 |
| 1947 | 18.28 |
| 1948 | 17.66 |
| 1949 | 16.39 |
| 1950 | 13.43 |
| 1951 | 7.90 |
| 1952 | 7.64 |
| 1953 | 6.05 |
| 1954 | 5.50 |
| 1955 | 4.27 |
| 1956 | 3.86 |
| 1957 | 3.05 |
| 1958 | 2.61 |
| 1959 | 2.04 |
| 1960 | 1.92 |
| 1961 | 1.66 |
| 1962 | 1.37 |
| 1963 | 1.28 |
| 1964 | 1.24 |
| 1965 | 1.03 |
| 1966 | 1.07 |
| 1967 | 1.17 |
| 1968 | 1.10 |
| 1969 | 1.23 |
| 1970 | 1.15 |
| 1971 | 1.05 |
| 1972 | 0.99 |
| 1973 | 0.84 |
| 1974 | 0.76 |
| 1975 | 0.64 |
| 1976 | 0.53 |
| 1977 | 0.41 |
| 1978 | 0.33 |
| 1979 | 0.28 |
| 1980 | 0.21 |
| 1981 | 0.17 |
| 1982 | 0.15 |
| 1983 | 0.15 |
| 1984 | 0.17 |
| 1985 | 0.22 |
| 1986 | 0.23 |
| 1987 | 0.33 |
| 1988 | 0.49 |
| 1989 | 0.69 |
| 1990 | 0.89 |
| 1991 | 1.02 |
| 1992 | 1.14 |
| 1993 | 1.23 |
| 1994 | 1.35 |
| 1995 | 1.46 |
| 1996 | 1.60 |
| 1997 | 1.78 |
| 1998 | 1.99 |
| 1999 | 2.28 |
| 2000 | 2.53 |
| 2001 | 2.76 |
| 2002 | 2.98 |
The history of the Social Security program provides some insight into today's debates regarding system financing, benefit adequacy, and return on payroll contributions. Policymakers, however, face some unique challenges with a fully mature program in which solutions, such as bringing in large groups of noncovered workers or raising fairly low payroll tax rates or taxable maximums, are no longer options. Also, at the time of the last major reforms to the program (the 1983 amendments), the retirement of the baby boomers was recognized as a problem but one that was not immediate. That issue is now at hand, as the first boomers will begin retiring in 2008. The large retirement wave facing Social Security is important in another respect. Cash benefit programs, such as Social Security, are not the only programs that will be under financial pressure. Most notably, the Medicare and Medicaid programs will also experience rapid growth. Thus, the natural problems that arise in reforming Social Security will be complicated by efforts to deal with the financial problems occurring in other entitlement programs.
Notes
1. Although social insurance programs in Europe developed before those in the United States, the United States had a large pension program after the Civil War for Union veterans and their survivors and dependents that provided economic security to many elderly persons in the late 1800s and early 1900s. In 1894, these pension payments represented 37 percent of the federal budget (DeWitt 2003).
2. Schieber and Shoven (1999, 22) note that, in 1930, a substantial majority of men 65 and older were out of work or on temporary layoff. They also argue that industrialization weakened the relative economic position of the elderly; in the agrarian economy, the elderly often "held the reins of economic power" through control over family assets (p. 19).
3. For a fuller discussion of the differences between the Acts of 1935 and 1939, see Schmitter and Goldwasser (1939).
4. The original Act promised benefits that ranged from $10 to $85 per month.
5. In 1932, wage earners averaged $1,199 annually (CES 1935).
6. For statistics on benefits awarded, see Social Security Administration (SSA 2003, Table 6A).
7. See Myers (1993) for a fuller discussion of issues related to reserve and pay-go financing. He argues that although the experience of the 1960s and early 1970s was consistent with a pay-go approach, the reports of the Social Security Trustees at the time reflected an "intention, for the future" (p. 392) of a long-run buildup of reserve funds.
8. This gender-based rule and others in the program have been changed over time, and today the program rules are gender neutral.
9. More than half of newly awarded retired-worker benefits in 2003 (excluding conversions from the disability program) went to persons who were aged 62 at the time the benefit was awarded (SSA 2003, Table 6.A4).
10. The 1960s did witness the creation of benefits based on marriages that ended in divorce. Today, certain divorced spouses and surviving divorced spouses can receive benefits similar to married and widowed spouses.
11. The Annual Statistical Supplement to the Social Security Bulletin (SSA 2003) contains histories of benefit increases, taxable maximums, and tax rates.
12. The program and policy history of the Medicare program is beyond the scope of this article, but interested readers can find research material at the history section of the Web site of the Centers for Medicare and Medicaid Services.
13. After these changes, widows, on average, needed only a small amount of income from sources other than Social Security to have income above the poverty line. By 1973, average widow benefits had reached $157.40 or, on an annual basis, about 89 percent of that year's poverty level. For further information on historical poverty thresholds and average widow benefits, see Social Security Administration (SSA 2003, Table 3.E1; 1973, respectively).
14. The correction in 1977 gave rise to the famous "notch" issue in Social Security, with retirees eligible for benefits after 1979 arguing that they had been unfairly treated. For a discussion of the flawed benefit formula and the "notch" issue, see "Notch" Commission (1994).
15. These figures are based on historical GDP numbers obtained from the Bureau of Economic Analysis and on program costs from the Board of Trustees (2004, Tables VI.A2 and VI.A4).
16. In 1950, the Aid to the Permanently and Totally Disabled (APTD) program was created, which provided federal support for state assistance programs for the disabled (Myers 1993, 798).
17. The amendments of 1980 and 1981 limited program benefits by reducing total benefits paid to families of disabled workers and by ending child benefits for college students.
18. For a discussion of the intent of policymakers in 1983, see Koitz (1997).
19. In the last half of the 20th century, the percentage of men 65 and older participating in the labor force fell from 45.8 percent to 16.9 percent (Purcell 2000).
20. Because of the amendments of 1983, the full retirement age, which has been age 65 for much of the program's history, is scheduled to increase gradually, reaching age 67 for persons born after 1959.
21. See Board of Trustees (2004, Table VI.F11) for projections of replacement rates for future retirees. As the scheduled increase in the full retirement age occurs, replacement rates for those retiring at the age of 65 (or other ages below the full retirement age) are projected to decline gradually.
22. Under intermediate assumptions, the Old-Age and Survivors Insurance and Disability Insurance Trust Funds will be exhausted in 2042 (Board of Trustees 2004). Chapter 2 of the Trustees Report also discusses other solvency measures, such as the actuarial deficit and unfunded obligations.
References
Ball, Robert M. 1985. "Restoring Financial Stability to Social Security." Social Security Bulletin 48(8): 16–18.
Board of Trustees of the Federal Old-Age and Survivors Insurance and Disability Insurance Trust Funds. 2004. 2004 Annual Report of the Board of Trustees of the Federal Old-Age and Survivors Insurance and Disability Insurance Trust Funds. March 23. Washington, DC: Social Security Administration. Available at http://www.socialsecurity.gov/OACT/TR/TR04.
[CBO] Congressional Budget Office. 2004. How Pension Financing Affects Returns to Different Generations. Long-Range Fiscal Policy Brief No. 12. Washington, DC: CBO. Available at http://www.cbo.gov/showdoc.cfm?index=5822&sequence=0.
Census Bureau. 1956. Statistical Abstract of the United States: 1956. Washington, DC: U.S. Government Printing Office.
______. 2004. Statistical Abstract of the United States: 2003. Washington, DC: U.S. Government Printing Office.
______. 2005. Historical Poverty Tables. Washington, DC: Census Bureau, U.S. Department of Commerce. Table 3. Poverty Status of People, by Age, Race, and Hispanic Origin: 1959 to 2003. (Note: data last revised on August 26, 2004).
[CES] Committee on Economic Security. 1935. Report to the President of the Committee on Economic Security. Washington, DC: U.S. Government Printing Office. Available at http://www.socialsecurity.gov/history/reports/ces/ces.html.
Christgau, Victor. 1960. "Old-Age, Survivors, and Disability Insurance After Twenty-Five Years." Social Security Bulletin 23(8): 20–30.
Committee on Ways and Means, U.S. House of Representatives. 1992. Green Book (Overview of Entitlement Programs: Background Material and Data on Programs Within the Jurisdiction of the Committee on Ways and Means). Washington, DC: U.S. Government Printing Office.
Congressional Research Service. 2000. Social Security: Summary of Major Changes in the Cash Benefits Program. Legislative History of the Social Security Act. CRS Legislative Histories, 2. Washington, DC: CRS, Library of Congress. Available at http://www.socialsecurity.gov/history/reports/crsleghist2.html.
DeWitt, Larry. 2001. The Townsend Plan's Pension Scheme. Research Note No. 17. Baltimore, MD: Office of the Historian, Social Security Administration. Available at http://www.socialsecurity.gov/history/townsendproblems.html.
______. 2003. Social Security Benefits as a Percentage of Total Federal Budget Expenditures. Research Note No. 19. Baltimore, MD: Office of the Historian, Social Security Administration. Available at http://www.socialsecurity.gov/history/percent.html.
[EBRI] Employee Benefit Research Institute. 1996–2005. The Power to Choose. Washington, DC: EBRI. Available at http://www.choosetosave.org/brochures/index.cfm?fa=choose.
Koitz, David. 1997. Social Security Financing Reform: Lessons from the 1983 Amendments. CRS Report 97-741. Washington, DC: Congressional Research Service.
McSteen, Martha A. 1985. "Fifty Years of Social Security." Social Security Bulletin 48(8): 36–44.
Myers, Robert J. 1993. Social Security. Philadelphia: University of Pennsylvania Press.
______. 1996. Oral History Interview. Washington, DC: Social Security Administration, Office of Library, Records, and Reprographics. Available at http://www.socialsecurity.gov/history/myersorl.html.
National Commission on Social Security Reform. 1983. Report of the National Commission on Social Security Reform. Washington, DC: U.S. Government Printing Office. Available at http://www.socialsecurity.gov/history/reports/gspan.html.
["Notch" Commission] Commission on the Social Security "Notch" Issue (1994). Final Report on the Social Security "Notch" Issue. Washington, DC: Social Security Administration. Available at http://www.socialsecurity.gov/history/notchbase.html.
Perkins, Frances. 1962. "The Roots of Social Security." Speech delivered at the headquarters of the Social Security Administration. Baltimore, MD: Office of the Historian, Social Security Administration. Available at http://www.socialsecurity.gov/history/perkins5.html.
Purcell, Patrick J. 2000. "Older Workers: Employment and Retirement Trends." Monthly Labor Review 123(10) October: 19–30.
Schieber, Sylvester J., and John B. Shoven. 1999. The Real Deal. New Haven, CT: Yale University Press.
Schmitter, Lyle L., and Betti C. Goldwasser. 1939. "The Revised Benefit Schedule Under Federal Old-Age Insurance." Social Security Bulletin 2(9): 3–12.
Schottland, Charles I. 1963. The Social Security Program in the United States. New York: Meredith Publishing.
[SSA] Social Security Administration. 1973. Annual Statistical Supplement to the Social Security Bulletin, 1973. Washington, DC: U.S. Government Printing Office.
______. 1985. Annual Statistical Supplement, 1984–85. Washington, DC: U.S. Government Printing Office.
______. 2003. Annual Statistical Supplement to the Social Security Bulletin, 2003. Washington, DC: Social Security Administration.