Cohort Changes in the Retirement Resources of Older Women
Social Security Bulletin, Vol. 68, No. 4, 2008 (released March 2009)
This article uses different sources of United States data to focus on the retirement resources of women aged 55–64 in 2004, 1994, and 1984. Notable changes have occurred with women's pathways into retirement resulting from increased education and lifetime work experience. There appear marked cohort differences in potential retirement outcomes.
Howard M. Iams is a senior research advisor, Lionel Deang is a social science research analyst, and Irena Dushi is an economist, all with the Office of Research, Evaluation, and Statistics, Office of Retirement and Disability Policy, Social Security Administration. John W. R. Phillips is an economist at the National Institute on Aging. Kristen Robinson is a senior policy consultant at the Altarum Institute.
Acknowledgments: The authors would like to thank Lynn Fisher, Susan Grad, Barbara Lingg, and Patricia Martin for very helpful comments on earlier drafts of this article. The authors also thank Thuy Ho and the late Jeffery A. Shapiro for computational assistance.
Contents of this publication are not copyrighted; any items may be reprinted, but citation of the Social Security Bulletin as the source is requested. The findings and conclusions presented in the Bulletin are those of the authors and do not necessarily represent the views of the Social Security Administration.
Summary
Dramatic changes in life expectancy, women's roles in the labor market, the structure of the workforce, and pension systems have occurred in recent decades, all influencing the well-being of future retirees. This article uses different sources of U.S. data to focus on the retirement resources of women aged 55–64. By comparing the resources for this age group in 2004 to their counterparts in 1994 and 1984, this analysis provides some indication of changes in the retirement preparedness of three different cohorts of women. Our findings indicate that notable changes have occurred with women's pathways into retirement that are due to increased education and lifetime work experience. As a consequence, there are marked differences in potential retirement outcomes. We find that women aged 55–64 today are better prepared in several respects than their counterparts of the same age 10 or 20 years ago.
Introduction
As the war babies and the leading edge of the baby boom approach retirement age, dramatic changes in the last half of the twentieth century have made it difficult to discern how people born during these eras will fare in retirement. Not only have the resources available to current preretirees changed, but so have the demographic characteristics of this group. Some guidance on how the future retirees will fare can come from comparisons with those who came before—in effect, a foreshadowing of what the aged will look like in the twenty-first century.
Because of interest in changing retirement risks, the Federal Interagency Forum on Aging-Related Statistics (the Forum)1 decided to bring information together on Americans aged 55–64 and the extent to which their retirement resources are changing. This study focuses on the dynamics of women's economic resources that comprise retirement income and the availability of employer-provided insurance against health risks at older ages. By comparing measures of well-being for this age group in 2004 to their counterparts in 1994 and in 1984, the article explores the preparedness of the current cohort with their counterparts from earlier birth cohorts at similar stages in the life cycle. Although many pre-retirees in 2004 were born just before the baby boom, change indictors of well-being for this group are suggestive for retirees in the near term and the coming baby boom.
The last half of the twentieth century witnessed dramatic and fundamental changes that will influence the coming war babies and the baby boomers in retirement (Farley 1996; Henretta and O'Rand 1999; Society of Actuaries 2006; Butrica, Iams, and Smith 2003; Goldin 2006). Fundamental shifts occurred in marital patterns and fertility rates. Baby boomers experienced relatively older ages of first marriage, higher divorce rates, and multiple marriages, coupled with relatively low fertility rates compared with their parents' generation. Longevity increased over the period as indicated by increasing life expectancy overall and among those aged 65 or older. To maintain current levels of consumption at older ages, an increased life expectancy must be paid for either through increased savings, increased pension benefits, or a delayed transition to full retirement. Perhaps the greatest changes occurred in women's roles in the labor market in the 1970s and continue today. Goldin (2006) defines this "quiet revolution" as changing horizons among women to include a lifetime of employment, shifting identities from home and family toward economic independence, and increasing job experience and earnings capacity. These changes have fundamentally altered the occupations and lifetime earnings of women.
In addition to the changes in women's roles in the labor market, the nature of work and the employer/employee relationship have changed greatly during this 30-year period. The economy has shifted from a manufacturing base toward services, and there is greater global competition. Employer costs and liabilities from traditional retirement-age support, such as defined-benefit pensions and retiree health insurance, have grown. Employers have responded by both shifting toward defined-contribution pension plans where the worker is more responsible for his or her financial well-being in retirement (Munnell and Sunden 2004) and reducing employer-provided retiree health insurance (Johnson 2007). These changes have resulted in shifting circumstances for many of the baby boomers, particularly women, approaching retirement. In this article, we infer about the impact of these changes by examining, from three birth cohorts in 1984, 1994, and 2004, the retirement resources of older women approaching retirement age. Our findings suggest that women aged 55–64 today are better prepared in several respects than the same age group 10 or 20 years ago.
Methodology and Data
The method of analysis is a cross-cohort comparison of well-being measures of three cohorts of women aged 55–64 in 1984, 1994, and 2004, just before they become eligible for Medicare and full Social Security benefits. More specifically, it compares the circumstances of women born in the 1920s (that is, those aged 55–64 in 1984) with the circumstances of women born in the 1930s and in the 1940s (that is, those aged 55–64 in 1994 and 2004, respectively). The well-being measures include demographic characteristics, retirement income, and retiree health insurance. We use different data sources. The demographic characteristics we consider, including educational attainment, marital status, and race and Hispanic origin, come from the Census Bureau's Current Population Survey (CPS).2 In addition, labor force participation rates at ages 55–61 and 62–64 are also based on an annual total of monthly data compiled from the CPS by the Bureau of Labor Statistics.
The World Bank (Holzman and Hinz 2005; World Bank 1994) recommends that retirement income be based on multiple pillars of income. In this article we focus on the three-legged stool of retirement income—Social Security benefits, financial wealth and assets from personal savings, and occupational pension participation. Social Security benefits, either through entitlement from covered earnings or from marriage to an entitled worker, are received by nearly 90 percent of married couples and nonmarried persons aged 65 or older in the United States (SSA 2006b, Table 1.1). In addition, incomes from occupational pensions are fairly widespread and received by about half of married couples and a third of nonmarried persons aged 65 or older. Furthermore, about two-thirds of married couples and half of nonmarried persons aged 65 or older receive income from assets. Some consider earnings from continuing work at older ages, among those partially retired, as an additional source of retirement income. About a third of couples and a seventh of nonmarried persons aged 65 or older have earnings (SSA 2006b, Table 1.1).
Social Security benefit data are taken from published statistical tables (SSA 1986, Table 84; 1995, Table 5.A16; 2005, Table 5.A16). Data on median net worth, net worth excluding home equity, and pension participation during working life come from the Health and Retirement Study (HRS)—a longitudinal survey of older Americans, supported by the National Institute on Aging. Insurance against health risks usually includes employer-based health insurance that may continue after retirement, in addition to government programs and individually purchased private health insurance. Data on retiree health insurance coverage also come from the HRS.3 Because the HRS started in 1992, the cohort comparison can only be made over a 10-year interval.4
Results
The findings of our research and the results of this analysis are presented in the subsections below.
Educational Attainment
Higher levels of education are associated with greater wealth, better health, and longer life (Waite and Gallagher 2000; Farley 1996). As expected, recent cohorts of women are more educated than their earlier counterparts. About 13 percent of women aged 55–64 in 2004 had less than a high school education compared with 32 percent in 1984 (Chart 1). In 2004, one-half (50 percent) of women aged 55–64 had at least some college education compared with only slightly more than a fifth (22 percent) in 1984. The percentage of women aged 55–64 with a college degree more than doubled over the past 20 years from 10 percent in 1984 to 24 percent in 2004.
Educational attainment of women aged 55–64: 1984, 1994, and 2004
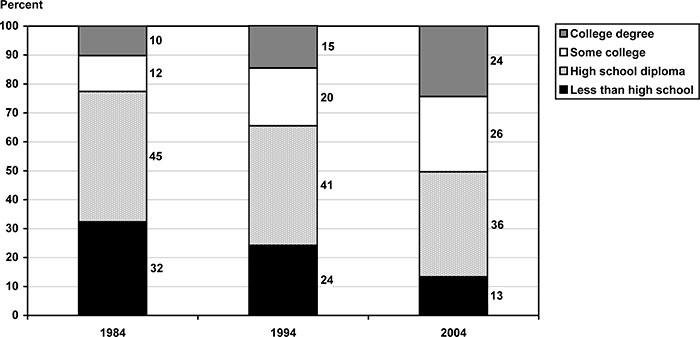
| Education | 1984 | 1994 | 2004 |
|---|---|---|---|
| Less than high school | 32 | 24 | 13 |
| High school diploma | 45 | 41 | 36 |
| Some college | 12 | 20 | 26 |
| College degree | 10 | 15 | 24 |
Marital Status
Marital status can affect many aspects of people's well-being including living arrangements, income, wealth, availability of caregivers, and overall health status. Marital status also affects access to future retirement income from auxiliary spouse and survivor Social Security benefits, survivor pension benefits, and couple's income and consumption sharing. Between 1984 and 2004, the proportion of women aged 55–64 who were married decreased slightly from 70 percent to 67 percent (Chart 2). The proportion of women aged 55–64 who were divorced doubled over the past two decades from 9 percent to 18 percent, whereas the proportion widowed declined from 17 percent to 10 percent.
Marital status of the population aged 55–64, by sex: 1984, 1994, and 2004
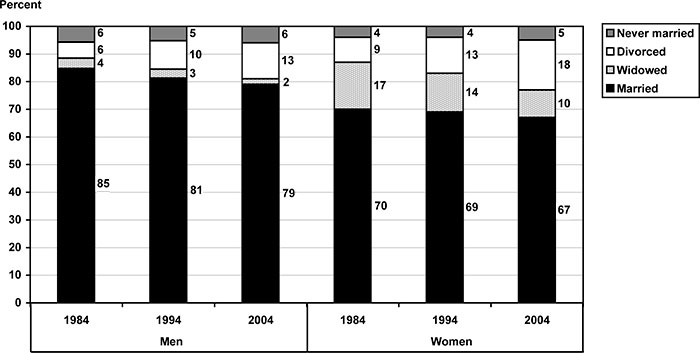
| Marital status | Men | Women | ||||
|---|---|---|---|---|---|---|
| 1984 | 1994 | 2004 | 1984 | 1994 | 2004 | |
| Married | 85 | 81 | 79 | 70 | 69 | 67 |
| Widowed | 4 | 3 | 2 | 17 | 14 | 10 |
| Divorced | 6 | 10 | 13 | 9 | 13 | 18 |
| Never married | 6 | 5 | 6 | 4 | 4 | 5 |
Race and Hispanic Origin
Women aged 55–64 became somewhat more diverse with respect to race and Hispanic origin over the past two decades. The percentage of non-Hispanic white women decreased from about 84 percent in 1984 to about 77 percent in 2004, and the percentage of Hispanics increased from 4 percent in 1984 to 8 percent in 2004 (Chart 3). The percentage of non-Hispanic black women remained relatively stable from 9 percent to 10 percent.
Percentage of women aged 55–64, by race and Hispanic origin: 1984, 1994, and 2004
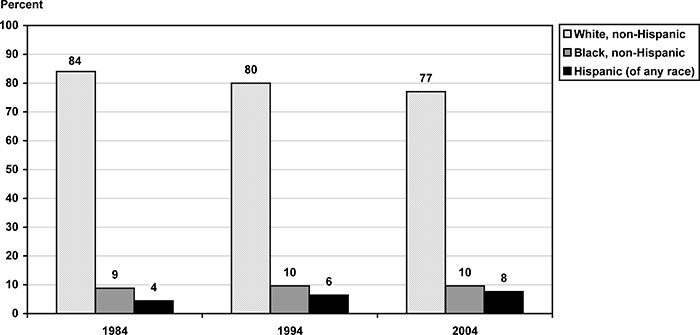
| Race and Hispanic origin | 1984 | 1994 | 2004 |
|---|---|---|---|
| White, non-Hispanic | 84 | 80 | 77 |
| Black, non-Hispanic | 9 | 10 | 10 |
| Hispanic (of any race) | 4 | 6 | 8 |
Labor Force Participation Rates
Individuals are considered to be in the labor force either if they are currently working or if they are looking for a job. People who exit the labor force before qualifying for full Social Security benefits at age 65 do so for a variety of reasons, including being eligible to collect reduced Social Security benefits, chronic health problems, or loss of a job.5 Continued employment after starting to receive Social Security retirement benefits provides an additional source of retirement income for many of the aged.6 Few return to work after retiring from the labor force (Warner, Haywood, and Hardy 2007). The labor force participation rates for women both at ages 55–61 and 62–64 have seen dramatic increases (Chart 4). Between 1984 and 2004, labor force participation rates increased from 47 percent to 62 percent for women aged 55–61 and from 29 percent to 39 percent for women aged 62–64. Studies of lifetime earnings patterns from Social Security administrative data find that the lifetime earnings of more recent cohorts of women markedly increased, reflecting both an increase in earnings levels and in overall years with earnings (Butrica, Iams, and Smith 2003, 2005).
Labor force participation rates of people aged 55–64, by sex and age group: 1984, 1994, and 2004
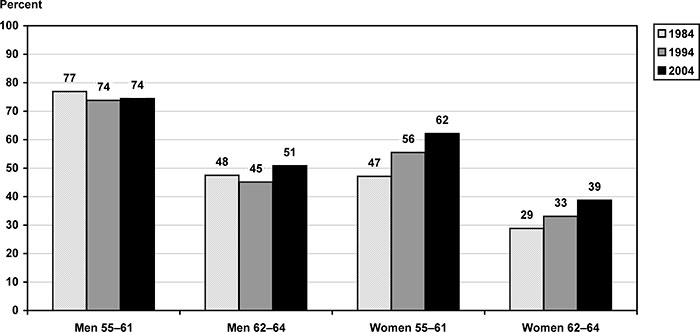
| Sex and age group | 1984 | 1994 | 2004 |
|---|---|---|---|
| Men 55–61 | 77 | 74 | 74 |
| Men 62–64 | 48 | 45 | 51 |
| Women 55–61 | 47 | 56 | 62 |
| Women 62–64 | 29 | 33 | 39 |
Median Income
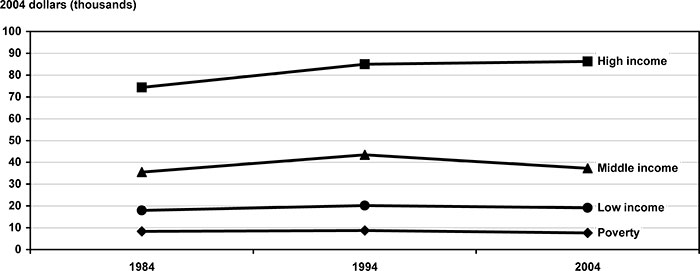
People with lower incomes are at greater risk of having inadequate resources for food, housing, health care, and other needs at retirement. Median household income for women aged 55–64 in the highest income category increased by 16 percent between 1984 and 2004, $74,400 to $86,300, respectively (Chart 5). In contrast, median household income of women aged 55–64 in the lowest two groups remained stable between 1984 and 2004.7
Median household income of women aged 55–64, by income category: 1984, 1994, and 2004
| Household income | 1984 | 1994 | 2004 |
|---|---|---|---|
| Poverty | 8,341 | 8,765 | 7,615 |
| Low income | 17,982 | 20,143 | 19,112 |
| Middle income | 35,536 | 43,461 | 37,234 |
| High income | 74,376 | 84,987 | 86,271 |
Median Net Worth
Net worth, which includes accumulated financial wealth and real estate and other assets minus debts, provides one of the pillars of retirement income. Financial wealth, such as stocks and bonds, can provide income through interest and dividends. Wealth holdings also can be sold to provide money for current spending and to smooth consumption patterns in the event of an income shock. Housing equity is a major source of wealth for the aged, but research indicates only a few of the aged households sell their houses or draw down their housing equity through reverse mortgages (Venti and Wise 2001; Fisher and others 2007). Thus, net worth other than home equity identifies the assets that are most likely to be spent first.
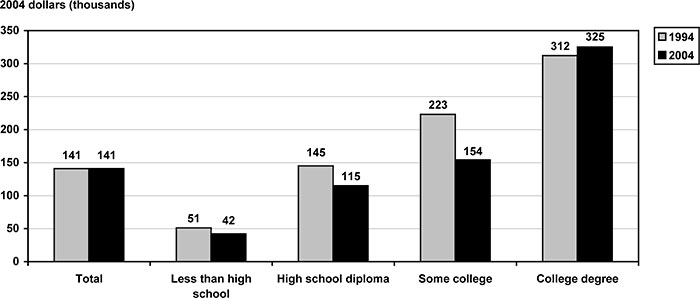
Median wealth increases with education level (Chart 6). In 2004, women aged 55–64 with less than a high school diploma had a median net worth of $42,000; high school graduates had over double that level ($115,000); women with some college had over triple that level ($154,000); and college graduates had over seven times that level ($325,000).8 Between 1994 and 2004, median total net worth of women aged 55–64 substantially decreased especially among high school graduates (from $145,000 to $115,000) and among women with some college education (from $223,000 to $154,000).
Median net worth of women aged 55–64 who report having assets, by educational attainment: 1994 and 2004
| Education | 1994 | 2004 |
|---|---|---|
| Total | 141 | 141 |
| Less than high school | 51 | 42 |
| High school diploma | 145 | 115 |
| Some college | 223 | 154 |
| College degree | 312 | 325 |
It should be noted that the proportion of married women declined between 1994 and 2004, while the proportion of divorced women increased, affecting median wealth levels.
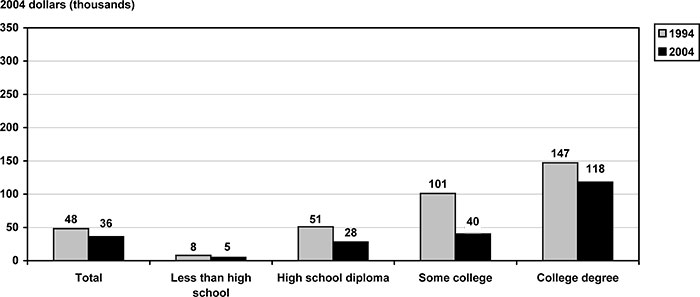
Median net worth excluding home equity also increases with higher levels of education (Chart 7). In 2004, women aged 55–64 with a college degree had a median net worth excluding home equity of $118,000 compared with only $5,000 among women without a high school diploma. Over the past decade, median net worth excluding home equity substantially decreased for women aged 55–64 from about $48,000 in 1994 to $36,000 in 2004. The decrease occurred within all education levels.
Median net worth (excluding home equity) of women aged 55–64 who report having assets, by educational attainment: 1994 and 2004
| Education | 1994 | 2004 |
|---|---|---|
| Total | 48 | 36 |
| Less than high school | 8 | 5 |
| High school diploma | 51 | 28 |
| Some college | 101 | 40 |
| College degree | 147 | 118 |
Pensions
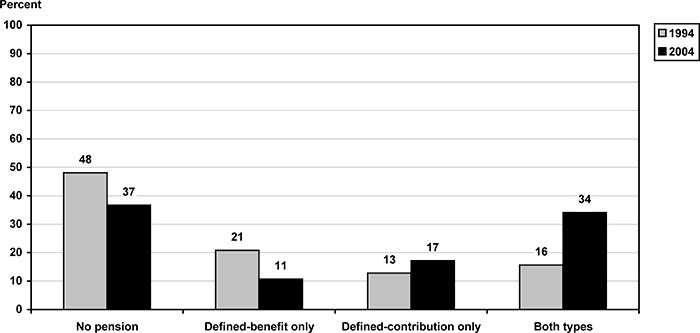
Between 1994 and 2004, the proportion of older women who ever participated in a pension plan dramatically increased, reflecting the increased lifetime labor force participation of more recent birth cohorts (Chart 8). In 2004, 63 percent of women aged 55–64 had participated in a pension plan during their working life compared with 52 percent of their counterparts in 1994. In contrast, the percentage of men who ever participated in a pension plan remained stable at about 75 percent, with a pension in both years.
Percentage of women aged 55–64 who ever had a pension, by pension type: 1994 and 2004
| Pension type | 1994 | 2004 |
|---|---|---|
| No pension | 48 | 37 |
| Defined-benefit only | 21 | 11 |
| Defined-contribution only | 13 | 17 |
| Both types | 16 | 34 |
Over the past few decades, there has been a shift in the type of pension offered by employers from defined-benefit only (in which a specified amount is typically paid as a lifetime annuity) to defined-contribution only (in which the amount of future benefit varies depending on contributions and investment returns). Both men and women experienced a shift in the type of pension they participated in during their working life. Between 1994 and 2004, women having had both defined-benefit and defined-contribution plans more than doubled from 16 percent to 34 percent. In contrast, the proportion of those with only defined-benefit pensions decreased, and of those with only defined-contribution pensions, the proportion slightly increased.9
Social Security Benefits
Social Security retirement benefits as a retired worker, or spouse of a worker based on age, are first available at age 62 on a reduced basis compared with the amount available at full retirement age (65 to 66, depending on birth year).10 Eligibility for disabled-worker benefits at any age requires an inability to work, recent employment (generally half of the past 10 years), and sufficient lifetime employment to be on track for eligibility for retired-worker benefits.
Among women receiving Social Security benefits, the percentage with their own earned-worker benefits increased over the past two decades (Chart 9). The proportion of beneficiary women aged 62–64 receiving retired-worker benefits increased from 48 percent in 1984 to 56 percent in 2004, while those receiving disabled-worker benefits doubled from 8 percent to 16 percent. This increase most likely reflects the greater lifetime labor force attachment and earnings of more recent cohorts of women. Increased insurance for disability benefits from more work and earnings may be particularly important because the majority of women born during the Depression lacked current insurance for disability before age 40, and at least a third of them lacked insurance in later life (Mitchell and Phillips 2001).
Percentage of current beneficiary women aged 62–64 receiving Social Security benefits, by type of benefit: December 1984, 1994, and 2004
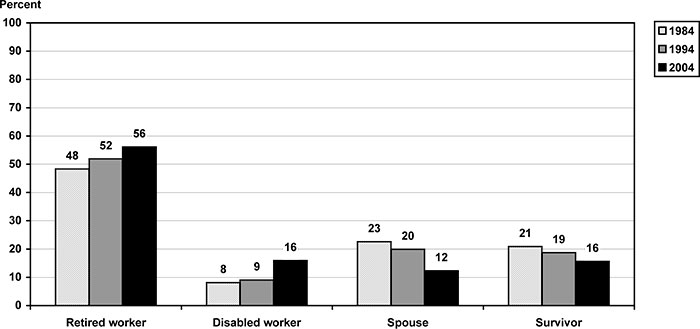
| Benefit type | 1984 | 1994 | 2004 |
|---|---|---|---|
| Retired worker | 48 | 52 | 56 |
| Disabled worker | 8 | 9 | 16 |
| Spouse | 23 | 20 | 12 |
| Survivor | 21 | 19 | 16 |
Retirement-age persons can also receive benefits as a spouse or a survivor of an insured worker. Divorced spouses can receive these benefits if the marriage lasted at least 10 years. Between 1984 and 2004, there was a drop in the receipt of spouse benefits and widow benefits among beneficiary women aged 62–64. The proportion of beneficiary women with spouse benefits decreased from 23 percent to 12 percent, while those with survivor benefits decreased from 21 percent to 16 percent. In addition to increasing eligibility for worker benefits, there were marital changes with a decline in currently married women and widows from 1984 through 2004.11
The average benefits of current retired workers aged 62–64 increased across 1984, 1994, and 2004 (Chart 10).12 Particularly notable is the almost 30 percent increase in the average level of women's benefits between 1984 and 2004. In all three years, the average of women's benefits remained about two-thirds the level of the average of men's benefits.
Average retired-worker benefits for current beneficiaries aged 62–64, by sex: 1984, 1994, and 2004
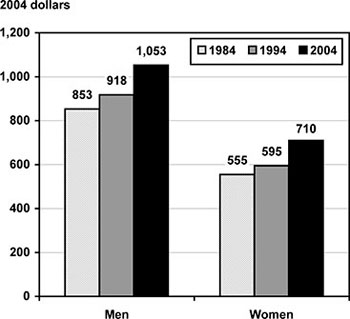
| Sex | 1984 | 1994 | 2004 |
|---|---|---|---|
| Men | 853 | 918 | 1,053 |
| Women | 555 | 595 | 710 |
Health Insurance
In the past, many employers allowed employees to continue their health insurance into retirement, either as the standard group policy or as a supplement to Medicare. The percentage of people with employer-based retiree health insurance,13 either through their own employer or through their spouse's employer, varies by sex. In 2004, 42 percent of men aged 55–64 had employer-based retiree health insurance compared with 35 percent of women (Chart 11). While the percentage of men with this type of health insurance has remained relatively stable, the corresponding percentage for women increased substantially from 20 percent in 1994 to 35 percent in 2004.
Percentage of people aged 55–64 with employer-based retiree health insurance, by sex: 1994 and 2004
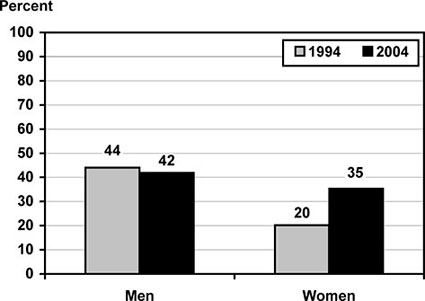
| Sex | 1994 | 2004 |
|---|---|---|
| Men | 44 | 42 |
| Women | 20 | 35 |
Conclusion
While there has been much concern about the retirement preparation of people approaching age 65, women aged 55–64 today are better prepared in several respects than their counterparts of the same age 10 or 20 years ago. Women are much more likely to be college educated. Over the past two decades, labor force participation rates for all women, but especially those aged 55–61, have risen dramatically. Because more women are working today than ever before, they now are better able to contribute to their own pension plans, earn eligibility for Social Security worker benefits (disabled-worker benefits as well as retired-worker benefits), acquire their own health insurance, and build their own net worth. This is a crucial development especially for the women who are entering retirement without a spouse to share the financial burden.
On the other hand, there are some indicators of increasing risks for women approaching age 65. The Government Accountability Office (2006) recently highlighted risks from increased reliance on investments, the future solvency of Social Security and Medicare, and the increases in health care costs. There has been a decreasing prevalence of marriage and rising prevalence of divorce. These marital changes may reduce the social support for the aged. Increasing longevity and life expectancy also increase the risk of needing long-term care and of exhausting financial resources. Although median net worth remained fairly stable in the past 10 years because of a slight increase in home equity, the value of other financial holdings has declined. Women's Social Security worker benefits have increased. The increase in women's pension coverage is also beneficial, but is potentially offset by the risks associated with pension income from defined-contribution pensions that depend on investment success over a lifetime. On the other hand, the risks faced by younger cohorts reaching age 65 may be different from those faced by older cohorts, and our analysis does not account for such dynamics.
Cohort comparisons from the selected measures of potential retirement resources suggest further research is needed. Differences across time for an age group could reflect cohort differences, the impact of aging, or the impact of changes across time periods. Because these data are under-identified statistically, we cannot distinguish the separate impact of cohort differences, the effects of aging, and time period changes. Further, more integrative analyses that longitudinally account for health, wealth, and family structure could provide a more comprehensive indication of retirement preparedness. The increased labor force participation of women could generate more equal earnings patterns between men and women. Rising earnings levels among more recent cohorts of women may contribute to their increase in pension plan participation. Increased labor force participation of women could increase pension coverage. Job shifts also could affect pension coverage because pension coverage by employers varies by occupation, industry, union status, and type of employment (private sector, public sector, nonprofit, and self-employed). Several factors could influence the increase in pension coverage of women.
This analysis began with the question, "How will future retirees fare in retirement?" It is impossible to answer this question definitively because of the dramatic changes that have occurred and an unknown future. Projections of future income adequacy have yielded mixed outcomes. Some have forecasted sharp decreases in wealth for preretirees (Wolff 2002) or sharply increased risks of not replacing preretirement income for more recent birth cohorts (Munnell, Webb, and Delorme 2006; Moore and Mitchell 1998). Others have projected more optimistic outcomes for future retirees (Scholz, Seshadri, and Khitatrakun 2006; Engen, Gale, and Uccello 1999). One objective of this article is to encourage more work in this critical area to inform the field and perhaps shape future policy.
Microsimulations designed and supported by the Social Security Administration suggest that baby boomers will be better off than current retirees with respect to real retirement income (per person) and poverty rates (Butrica, Iams, and Smith 2005; Butrica and others 2001; Toder and others 1999; Toder and others 2002). These increases are statistically projected for most subgroups defined by marital status, race and Hispanic origin, education, and lifetime earnings levels. Nevertheless, SSA's Modeling Income in the Near Term (MINT) microsimulation model also projects that some baby boomers will experience substantial reductions in income in retirement compared with their preretirement levels. Economically vulnerable subgroups include divorced women, never-married men, persons of Hispanic origin, high school dropouts, persons with the lowest lifetime earnings, and those with limited attachment to the labor force.
Notes
1 The Federal Interagency Forum on Aging-Related Statistics is a collection of federal agencies that share a common interest in improving aging-related data. The Forum has played a key role by critically evaluating existing data resources and limitations, stimulating new database development, encouraging cooperation and data sharing among federal agencies, and preparing collaborative statistical reports. For more information, the Forum's report (2008b), Selected Indicators of Retirement Resources Among People Aged 55–64: 1984, 1994, and 2004, is available at http://www.agingstats.gov.
2 The CPS contains sampled data. For a discussion of sampling variability, see SSA (2006a, Appendix).
3 Statistical significance tests on reported estimates were calculated using the SUDAAN statistical package, and only significant differences are highlighted in the text.
4 This article consists primarily of charts drawn from data on well-being collected or sponsored by federal agencies including the National Institute on Aging-Supported Health and Retirement Study and the Census Bureau's Current Population Survey. Those and other federal agencies participate in the Federal Interagency Forum on Aging-Related Statistics (the Forum), which is a group of several federal agencies involved in preparing or supporting statistics on the aged. Tables of sampling errors are available on the Forum's Web site. As part of the Forum's (2000, 2004, 2006, 2008a) activities, a periodic chartbook is produced on the health and well-being of the aged (see http://www.agingstats.gov). For the most part, these chartbooks compile information on the U.S. population aged 65 or older using selected data from the Forum agencies. The full set of charts and tables prepared by the Forum (2008a) agencies is available at http://www.agingstats.gov. The charts in this article use weighted statistics.
5 The age for full Social Security retirement benefits is 65 for those born before 1938. The full retirement age increases by 2 months for each birth year between 1938 and 1945, and it remains at age 66 for those born between 1945 and 1957 (SSA 2006a, Table 2.A17.1).
6 In 2004, the retirement earnings test (RET) reduced benefits by $1 for every $2 earned above $11,460 in the years prior to the year of reaching full retirement age and $1 for every $3 earned above $31,080 in the year of full retirement age for amounts earned in the months prior to attaining full retirement age (SSA 2006a, Table 2.A29.1). In 1994, the RET reduced benefits by $1 for every $2 earned above $8,040 at ages 62–64 and $1 for every $3 earned above $11,160 at ages 65–69 (SSA 2005, Table 2.A29).
7 The income levels are set as a ratio to the poverty level in the specific data period. Because the poverty levels are inflation-adjusted, the median income levels are more constant over time than would be observed with current-year dollars.
8 The education-level distribution changed over time (Chart 1). The wealth of married couples is divided in half to create a per capita measure.
9 If the focus was on current-job pensions rather than pensions during the entire work life, a much higher proportion of retirees would have only a defined-contribution pension rather than both types of pensions.
10 The Social Security age for full benefits gradually increased from 65 to 66 for those born after 1937. This change slightly reduced the benefits received in 2004 at ages 62–65 for those born in the 1938–1942 period.
11 The worker beneficiary category includes eligible workers who also receive spouse or widow benefits. Table 5.A14 (SSA 2005) indicates that the percentage of women solely receiving benefits as wives or widows has been declining over time. However, the percentage of women workers who are also eligible for wife or widow benefits (termed dually entitled) has increased substantially. Dually entitled women receive their own worker benefits supplemented by the net amount of the higher auxiliary benefit. Thus, auxiliary spouse or widow benefits continue to be important to the majority of beneficiary women.
12 Chart 10 displays the average retired-worker benefits for men and women. In this chart, benefits of married couples are not averaged or divided evenly between the husband and wife of each couple, as was done for assets.
13 Employer-based retiree health insurance continues after an employee leaves his or her job. The measure used here is based on respondent reports of current or future retiree health insurance coverage either from a former employer or from a current employer. The measure also counts coverage from a spouse's current or former employer that continues after employment stops.
References
Butrica, Barbara A., Howard M. Iams, James Moore, and Mikki Waid. 2001. Methods in Modeling Income in the Near Term (MINT). ORES Working Paper Series No. 93. Office of Policy, Social Security Administration.
Butrica, Barbara A., Howard M. Iams, and Karen Smith. 2003. Its all relative: Understanding the retirement prospects of baby boomers. Working Paper No. 2003-21. Chestnut Hill, MA: Center for Retirement Research at Boston College (November). Available at http://www.bc.edu/crr.
———. 2005. The changing impact of Social Security on retirement income. Social Security Bulletin 65(3): 1–13.
Engen, Eric M., William G. Gale, and Cori E. Uccello. 1999. The adequacy of household saving. Brookings Papers on Economic Activity, No. 2, 65–165.
Farley, Reynolds. 1996. The new American reality: Who we are, how we got here, where we are going. New York, NY: Russell Sage Foundation.
[the Forum] Federal Interagency Forum on Aging-Related Statistics. 2000. Older Americans 2000: Key indicators of well-being. Washington, DC: Government Printing Office.
———. 2004. Older Americans 2004: Key indicators of well-being. Washington, DC: Government Printing Office.
———. 2006. Older Americans update 2006: Key indicators of well-being. Washington, DC: Government Printing Office.
———. 2008a. Older Americans 2008: Key indicators of well-being. Washington, DC: Government Printing Office.
———. 2008b. Selected indicators of retirement resources among people aged 55–64: 1984, 1994, and 2004. Washington, DC: Government Printing Office.
Fisher, Jonathan D., David S. Johnson, Joseph T. Machand, Timothy M. Smeeding, and Barbara Boyle Torrey. 2007. No place like home: Older adults and their housing. Journal of Gerontology: Social Sciences 62B(2): S120–S128.
Goldin, Claudia. 2006. The quiet revolution that transformed women's employment, education, and family. American Economic Review 96(2): 1–21.
Government Accountability Office. 2006. Baby boom generation: Retirement of baby boomers is unlikely to precipitate dramatic decline in market returns, but broader risks threaten retirement security. Report No. GAO-06-718. Washington, DC: Government Accountability Office.
Henretta, John C., and Angela M. O'Rand. 1999. Age and inequality: Diverse pathways through later life. Boulder, CO: Westview Press.
Holzman, Robert, and Richard Hinz. 2005. Old-age income support in the 21st century: An international perspective on pension systems and reform. Washington, DC: World Bank.
Johnson, Richard W. 2007. What happens to health benefits after retirement? An Issue in Brief Series 7. Chestnut Hill, MA: Center for Retirement Research at Boston College (February).
Mitchell, Olivia S., and John W. R. Phillips. 2001. Eligibility for Social Security Disability Insurance. Presentation at the Third Annual Conference of the Retirement Research Consortium. Washington, DC (May).
Moore, James F., and Olivia S. Mitchell. 1998. Projected retirement wealth and savings adequacy in the Health and Retirement Survey. Pension Research Council Working Paper No. 98-1. Philadelphia, PA: The Wharton School, University of Pennsylvania. Available at http://www.pensionresearchcouncil.org/publications/papers.php?year=1998.
Munnell, Alicia H., and Annika Sunden. 2004. Coming up short: The challenge of 401(k) plans. Washington, DC: Brookings Institution Press.
Munnell, Alicia H., Anthony Webb, and Luke Delorme. 2006. A new national retirement index. An Issue in Brief No. 48. Chestnut Hill, MA: Center for Retirement Research at Boston College. Available at http://www.bc.edu/crr/ib_48.
Scholz, John Karl, Ananth Seshadri, and Surachai Khitatrakun. 2006. Are Americans saving "optimally" for retirement? Journal of Political Economy 114(41): 607–643.
[SSA] Social Security Administration. 1986. Annual Statistical Supplement to the Social Security Bulletin, 1986. Washington, DC: Government Printing Office.
———. 1995. Annual Statistical Supplement to the Social Security Bulletin, 1995. Washington, DC: Government Printing Office.
———. 2005. Annual Statistical Supplement to the Social Security Bulletin, 2004. Washington, DC: Government Printing Office.
———. 2006a. Annual Statistical Supplement to the Social Security Bulletin, 2005. Washington, DC: Government Printing Office.
———. 2006b. Income of the population aged 55 or older, 2004. Washington, DC: Office of Policy, Office of Research, Evaluation, and Statistics.
Society of Actuaries. 2006. Longevity: The underlying driver of retirement risk: 2005 risks and process of retirement survey report. Schaumburg, IL: Society of Actuaries.
Toder, Eric, Cori Uccello, John O'Hare, Melissa Favreault, Caroline Ratcliffe, Karen Smith, Gary Burtless, and Barry Bosworth. 1999. Modeling Income in the Near Term: Projections of retirement income through 2020 for the 1931–1960 birth cohorts. Final report, SSA Contract No. 600-96-27332. Washington, DC: Urban Institute Press.
Toder, Eric, Lawrence Thompson, Melissa Favreault, Richard Johnson, Kevin Perese, Caroline Ratcliffe, Karen Smith, Cori Uccello, Timothy Waidmann, Jillian Berk, and Romina Woldemariam. 2002. Modeling Income in the Near Term: Revised projections of retirement income through 2020 for the 1931–1960 birth cohorts. Final report, SSA Contract No. 600-96-27332. Washington, DC: Urban Institute Press.
Venti, Steven, and David Wise. 2001. Aging and housing equity: Another look. In Analyses in the economics of aging. Volume 9, David A. Wise, ed. Chicago, IL: University of Chicago Press.
Waite, Linda, and Maggie Gallagher. 2000. The case for marriage: Why married people are happier, healthier, and better off financially. New York, NY: Doubleday.
Warner, David F., Mark D. Hayward, and Melissa A. Hardy. 2007. Retirement in America: Working life table estimates for the population over age 50, by sex and race/ethnicity. Presentation at the Population Association of America 2007 Annual Meeting. New York, NY.
Wolff, Edward N. 2002. Retirement insecurity: The income shortfalls awaiting the soon-to-retire. Washington, DC: Economic Policy Institute.
World Bank. 1994. Averting the old-age crisis: Policies to protect the old and promote growth. New York, NY: Oxford University Press.