B. NUMBER OF OLD-AGE AND SURVIVORS INSURANCE (OASI) BENEFICIARIES
1. Fully Insured Beneficiaries Aged 60 or Older
Tables III.B1 through III.B3 show, respectively, the Social Security area population, the fully insured population, and the percentage of the population that is fully insured, all for ages 60 or older. Of the fully insured OASI beneficiaries aged 60 or older, about 99.75 percent consist of retired workers, aged spouses of retired workers, or aged widow(er)s of deceased workers. (The remainder are primarily disabled widow(er)s, but young widow(er)s and young spouses are also represented.) As a first step, entitlements for these three beneficiary groups are processed together, on an age- and gender-specific basis. More details on the projection process for this combined group are presented in the following subsections, with relevant data appearing in tables III.B4 through III.B23.
Although the insured aged spouses and widow(er)s could become retired workers at any time (after age 62), many choose to delay that conversion. This may result in a higher ultimate benefit.
a. In Force
Persons who have received an OASI benefit award and not been terminated for any reason are described as being in force, or, alternately, as being entitled to an OASI benefit. The number in force for the combined fully insured group described above (retired workers, aged widow(er)s, and aged spouses) is projected on a cohort basis for single years of age 60 through 94, where ages 60 and 61 consist only of aged widow(er)s, and ages 95 or older are handled as a single group. The method is to take the number in force at the end of any given calendar year, add projected awards, apply projected termination rates, and arrive at a number in force for the end of the following calendar year. Termination rates are determined based on historical trends, and on the projected mortality rates of the aged population, since a large proportion of the latter is insured and receives a benefit in one of our three categories. The final step of the process is to redistribute the single year of age number in force among the three separate beneficiary types, and proportions needed for this purpose are based on historical trends in the observed proportions among the three groups. Tables III.B4, III.B5, and III.B6 show the number in force by age group for, respectively, retired workers, insured widow(er)s, and insured spouses. At the end of 2004, the retired workers formed about 93.9 percent of the combined group, aged widow(er)s about 5.6 percent, and aged spouses only 0.5 percent.
The number of male retired workers in force is projected to grow 30 percent over the next 10 years, from 15.5 million in 2004 to 20.1 million in 2014. Female retired workers in force are expected to grow 34 percent over the same period, from 14.6 million to 19.5 million in 2014, when they will form 49 percent of the total. Among the insured widow(er)s and insured spouses in force, females form the overwhelming majority, or currently 98 percent in each category. Insured widows in force are expected to grow 13 percent, from 1.8 million at the end of 2004 to 2.0 million by the end of 2014. Insured wives in force are expected to grow 36 percent, from 163 thousand in 2004 to 222 thousand in 2014. For insured widowers, the comparable figures are from 35.5 thousand in 2004 to 51.8 thousand by 2014; for insured husbands, from 2.7 thousand in 2004 to 3.4 thousand by 2014.
Table III.B7 shows, by 5-year age groups, the total number of fully insured, 60 or older individuals who are in force either as a disability beneficiary or as one of the three beneficiary types considered above. Table III.B8 shows the analogous in force percentages, for the same combined group, out of the fully insured population. The figures are less than 100 percent at ages under 70, since many workers delay their retirement beyond the first possible date (age 62 for retired workers or aged spouses; age 60 for aged widow(er)s). The figures are near 100 percent for virtually all ages 70 or older. Percentages occasionally are not exactly 100 percent due to discrepancies in the underlying population and fully insured worker data.
b. Awards: Establishing the Fully Insured Population
In projecting the number of fully insured awards for our combined group of retired workers, aged widows, and aged spouses, the most important task is to determine the fully insured population, since this is precisely our exposure group, restricted to those of sufficient age who have not yet received an award. The steps in the development of the fully insured population were discussed earlier.
Table III.B2 shows the fully insured population by age groups, and table III.B3 shows the analogous fully insured rates. The overall male fully insured rate for those 60 or older has been in excess of 92 percent since 1980, and is projected to grow from 93.8 percent at the end of 2004 to 94.9 percent by the end of 2014. The female rate has grown continuously from 60.2 percent in 1980 to 73.7 percent at the end of 2004, and it is expected to reach 81.6 percent by the end of 2014.
c. Awards: Establishing Retirement Rates
Awards to retired workers, insured widow(er)s, and insured spouses are covered in tables III.B9 through III.B12. The number of awards for the combined group is calculated at each year of age by applying a rate of "retirement" to the fully insured population, after subtracting the number of workers who are already entitled. The term "retirement", as used here and in the sequel, refers simply to a benefit award of one of these three types, and not necessarily to an end of labor force participation. In determining the number eligible at the end of any calendar year, we must subtract from the fully insured population not only the number who have already retired, but also the number who have received a disabled worker benefit. Table III.B9 shows retirement rates for retired workers, insured widow(er)s, and insured spouses combined. Tables III.B10, III.B11, and III.B12 show actual awards for the three groups separately.
Retirement rates by single year of age are developed by analysis of historical trends. Especially significant in recent years is the effect of the elimination of the earnings test in 2000, for those of full retirement age or older. In table III.B9, note the sharp spike in retirement rates which occurs in 2000 for ages 65 through 69; for age 65, this spike persists through 2003 with only a slight reduction, but for ages 66 through 69, we see a drop, almost back to pre-2000 levels, for the years 2001 to 2003. Significant for the years 2004-10 is the effect of the legislated increase in NRA (normal retirement age); this can be seen in table III.B9 as a crossover in the age of maximal retirement rate from 65 to 66, starting abruptly in 2004, especially for males, and continuing over the years 2005-10.
The retirement rates in table III.B9 are far lower for ages 60 and 61 than for higher ages, since only insured widows and widowers may retire at these ages. At age 62, when retired worker and aged spouse benefits are first available, the table shows that in 2004, about 37 percent of males and 45 percent of females chose to retire, and these rates are expected to remain roughly at the same levels throughout the projection period. Retirement rates are sharply lower for ages 63 and 64, as compared to age 62, for both the historical and the projection period. But at normal retirement age, already in the process of advancing from 65 to 66, at least three-quarters of those eligible to retire choose to do so.
d. Withheld
Benefits to retired workers (and most other beneficiaries) who have not reached NRA may be withheld if beneficiaries have earnings in excess of the exempt amounts. (Prior to 2000, any beneficiary under age 70 could be withheld for the same reason.) In addition, benefits at any age may be withheld for other reasons, such as an unknown address or receipt of a government pension. Table III.B13 summarizes the number of retired workers with benefits withheld at the end of each year, while table III.B14 shows the number withheld as a percentage of retired workers in force. Tables III.B15, III.B16, III.B17, and III.B18 show comparable figures for insured widow(er)s and insured spouses. For each type of beneficiary, projected withheld numbers are obtained, for each sex and single year of age, by subtracting projected numbers in current-payment status (discussed below) from projected numbers in force.
As indicated in table III.B14, the number of retired workers with benefits withheld relative to the size of the total number of workers with benefits in force has experienced several drops over the past 25 years. These drops have generally been in response to legislation that provided a more generous treatment of earnings for beneficiaries who have attained NRA. In 1983 the maximum age for the application of the earnings test dropped from 72 to 70. In 1990, the rate at which earnings above the exempt amount are withheld from benefits changed from $1 withheld for each $2 of earnings over the exempt amount to $1 for every $3 of such earnings. Finally, in 2000, the maximum age for the application of the earnings test was reduced from 70 to NRA. The fraction of retired workers with benefits withheld is projected to gradually increase in the future along with the scheduled increases in the NRA.
e. Current-Payment Status
Projected numbers of retired workers, insured widow(er)s, and insured spouses in current-payment status are shown, respectively, in tables III.B19, III.B20, and III.B21. These numbers are derived separately for the three beneficiary types, on a single year of age basis, and are based largely on historical in current-payment to in force ratios.
The total number of retired workers in current-payment status is projected to increase steadily from 30.0 million at the end of 2004 to 39.4 million by the end of 2014. The number of insured widow(er)s in current-payment status decreased sharply in 1997 (table III.B20), as a result of an administrative effort to identify and inform widow(er) beneficiaries who would receive a higher benefit on their own earnings. The above change is also reflected as a decrease in the number of insured widow(er)s in force (table III.B5). A corresponding increase in the number of retired workers in current-payment status took place at the same time, even though it is not noticeable due to the relative large magnitude of the number of retired workers. The total number of insured widow(er)s in current-payment status is also projected to increase steadily over the years 2004-14, from 1.8 million at the end of 2004 to 2.0 million by the end of 2014. The number of insured spouses is expected to grow from about 163,000 at the end of 2004 to 220,000 by the end of 2014.
f. Semiannual Retired Worker Projections
Tables III.B22 and III.B23 show the projected numbers of retired workers in force and in current-payment status, respectively, at the end of each six-month period. The projected end-of June numbers are determined by analyzing historical end-of-June numbers, especially as these numbers compare to the corresponding numbers from the previous December and the following December. For each table, the last column for males, and similarly for females, shows the percentage of the annual change, in either in force or in current-payment status numbers, which occurred during the previous six months. It is striking that during the years 1975-99, most of the new beneficiaries in current-payment status, in any given year, joined the rolls during the second half of the year. In fact, over the period 1990-99, 70 percent of the males did so, on average, and 67 percent of the females. In 2000, though, these percentages plummeted to 28 percent for males and 38 percent for females, with a gradual return to 56 or 57 percent over the next four years. The 2000 effect is attributable to the repeal of the retirement earnings test, for those 65 or older; starting then, workers 65 or older could retire, yet still work with no withholding of benefits. The percentage gradually goes back up, once the 65 or older group have chosen to retire, because the earnings test is still in effect for those under age 65. Of course, over the years 2004-10, the minimum age for no retirement test penalties is increasing with NRA, and by 2010 will reach 66.
2. Minor Children
Numbers of minor children of retired and deceased workers are related to the non-orphan and orphan populations, respectively. Table III.B24 shows the population under age 18, split into non-orphan and orphan groups, in four age groups (0-4, 5-9, 10-14, and 15-17).
The number in force for minor children of retired workers, often referred to as "minor life" children, is projected by single year of age, at the end of each calendar year, by adding awards for minor life children to the number of such children in force at the end of the previous year, and applying termination rates. Table III.B25 summarizes the number of minor life children in force, by age group.
The projected number of awards to minor life children is based on award rates relative to the non-orphan population. These rates are shown in table III.B26. The number of awards to minor life children, shown in table III.B27, is projected to remain relatively stable throughout the projection period.
The derivation of the number of minor life children in current-payment status from the number in force is summarized in tables III.B28 and III.B29. Single year of age withheld rates from recent history are applied against projected numbers in force, to obtain projected withheld numbers; the latter are subtracted from projected in force numbers to arrive at projected numbers in current-payment status.
The number of minor life children in current-payment status is projected to increase gradually, from 277 thousand at end of 2004 to 281 thousand by the end of 2014.
In force numbers for minor children of deceased workers, or "minor survivor" children, are projected by single year of age using methods similar to those used for minor life children. Table III.B30 shows the projected number of minor survivor children in force, and that number as a percentage of the orphan population.
The projected number of awards to minor survivor children is based on award rates relative to the orphan population. These rates, shown in table III.B31, decreased from 1996 through 1998, possibly due to the dependency test for stepchildren. The number of awards to minor survivor children (shown in table III.B32) is projected to remain close to its 2004 level of slightly under 200 thousand.
The derivation of the number of minor survivor children in current-payment status from the number in force is summarized in tables III.B33 and III.B34. Projected numbers in those tables are determined in a manner similar to that for minor life children.
The number of minor survivor children in current-payment status is projected to decrease from 1,339 thousand currently to 1,223 thousand by the end of 2014.
3. Disabled Children
Disabled children of retired and deceased workers, often known as "disabled life" and "disabled survivor" children, respectively, are processed in relation to the uninsured population aged 18 or older. This population is shown in table III.B35. In force numbers for both groups are projected by single year of age, at the end of each calendar year, by adding disabled-child awards to the number in force at the end of the previous year, and applying termination rates. Tables III.B36 and III.B37 show the results, by 5-year age groups, for disabled life children and disabled survivor children, respectively.
Projected award numbers for disabled life or survivor children are based upon historically established award rates, relative to the uninsured population. Award rates for disabled life children (shown in table III.B38) as well as the number of awards (shown in table III.B39) are projected to remain fairly stable during the next 10 years. Likewise, award rates for disabled survivor children (shown in table III.B40) as well as number of awards (shown in table III.B41), are projected to remain close to recent levels.
The derivation of the numbers of disabled life and disabled survivor children in current-payment status from the numbers in force is shown in tables III.B42, III.B43, and III.B44 (for disabled life children) and in tables III.B45, III.B46, and III.B47 (for disabled survivor children). Projected numbers in those tables are determined in a manner similar to that for minor life and minor survivor children.
The number of disabled life children in current-payment status is projected to increase slightly from the present level of 191 thousand to 199 thousand by 2014. Disabled survivor children are projected to increase from 503 thousand currently to 573 thousand by the end of 2014.
4. Student Children
Tables III.B48 and III.B49 show a variety of historical and projected data on "student life" children and "student survivor" children, respectively. These terms, as well as the projection methods used, are similar to those discussed above for minor and disabled children. Note that over the period from 1981 to 1985, award numbers, as well as numbers in force and in current-payment status, dropped precipitously to 30 percent (or less) of their former values. This occurred because of a gradual phasing out of student child benefits for children aged 19 through 21; now, almost all student children are aged 18. As a result, the relative turnover in the student child population is quite large as compared to other beneficiary types; in fact, the number of awards in recent years has exceeded the number in force. Award rates for student children of both types are projected to remain close to their current levels over the next 10 years. Current-payment status numbers are expected to increase very slightly.
5. Semiannual Child Projections
Tables III.B50 and III.B51 show the semiannual projected number of children of retired workers in force and in current-payment status, respectively. Projected end-of-June numbers are found by determining the "excess" of each recent end-of-June number (whether positive or negative) as compared to the average of the numbers from the preceding and the following Decembers. The historical trend in these excesses is then carried into the future and applied against projected December averages. The semiannual number of children of deceased workers is projected in a similar manner and shown in tables III.B52 and III.B53.
6. Young Spouses
Young wife and young husband beneficiaries are spouses of retired workers who are entitled to a benefit because they are the parents of an eligible child, that is, a child of a retired worker who is either under 16 or disabled. Young spouses are projected by sex and single year of age, at the end of each calendar year, by adding the young spouse awards to the number of young spouses in force at the end of the previous calendar year, and applying termination rates. Table III.B54 summarizes the number of young spouses of retired workers in force, by age group.
Awards to young wives and young husbands are projected using award rates that relate the number of young spouse awards to the number of awards to eligible children (defined above). The award rates (awards per 1,000 eligible child awards) are shown in table III.B55. The number of awards to young spouses (shown in table III.B56) is projected to remain stable throughout the projection period.
The derivation of the number of young spouses of retired workers in current-payment status from the number in force is shown in tables III.B57, III.B58, and III.B59. Projected withheld rates are based upon rates from the most recent historical year, as can be seen in table III.B57. These rates are multiplied against projected numbers in force, by single year of age, to produce projected withheld numbers. The analogous 5-year age group version appears in table III.B58. Finally, withheld numbers are subtracted from in force numbers to produce current-payment numbers, and table III.B59 shows the 5-year age group version.
The number of young wife beneficiaries with benefits in current-payment status, as shown in table III.B59, has undergone a 25-year period of decline, but is projected to stabilize during the projection period at a figure close to 50 thousand. Numbers of young husbands in current-payment status are extremely small by comparison, never over 200, and fewer than 100 for the projected years.
7. Mothers and Fathers
Mother and father beneficiaries, also referred to as young widows and widowers, are widows or widowers of deceased workers who are entitled to a benefit because they are the parents of an eligible child, that is, a child of a deceased worker who is either under 16 or disabled. Mothers and fathers are projected by sex and single year of age, at the end of each calendar year, by adding mother or father awards to the number of mothers or fathers in force at the end of the previous calendar year, and applying termination rates. Table III.B60 summarizes the number of mothers and fathers in force by age group.
Awards to mothers and fathers are projected using award rates that relate the number of such awards to the number of corresponding awards to eligible children (defined above). These rates, given as awards per 1,000 eligible child awards, are shown in table III.B61. The number of awards to mothers and fathers, shown in table III.B62, has been declining over the past 25 years, especially for females, but is projected to stabilize during the projection period.
The derivation of the number of mothers or fathers in current-payment status from the number in force is shown in tables III.B63, III.B64, and III.B65. Projected withheld rates are based upon rates from the most recent historical year, as can be seen in table III.B63. These rates are multiplied against projected in force numbers, by single year of age, to produce projected withheld numbers. The analogous 5-year age group numbers appear in table III.B64. Finally, the number withheld is subtracted from the number in force to produce the number in current-payment status. Table III.B65 shows the number in current-payment status by 5-year age groups.
The number of mother beneficiaries with benefits in current-payment status has historically been about three times the analogous number for young wives, and has also been declining over the last 25 years. Declines are projected to continue, although at a reduced rate, over the next 10 years, from 173 thousand at the end of 2004 to 149 thousand by the end of 2014 (see table III.B65.) The number of father beneficiaries in current-payment status has remained fairly stable at about 10 or 11 thousand since 1996, and is projected to continue in this range through 2014.
8. Semiannual Young Spouses and Mothers and Fathers
Semiannual numbers for young wives, young husbands, mothers, and fathers are projected using the same method as that used for children of retired or deceased workers. Tables III.B66 and III.B67 show the projected number of young wife and young husband beneficiaries, respectively, and that number as a percentage of the eligible child beneficiaries. Tables III.B68 and III.B69 show the projected number of mother and father beneficiaries, respectively, and that number as a percentage of the eligible child beneficiaries.
9. Disabled Widows and Widowers
A disabled individual who is at least 50 years old but not yet full retirement age, and who is the survivor of an insured worker, is eligible for an OASI disabled widow(er) benefit. Such a benefit may continue up to full retirement age; at that time, those entitled to such benefits are generally converted to an aged widow(er) benefit. Disabled widows and widowers in force are projected by sex and single year of age, at the end of each calendar year, by adding the disabled widow(er) awards to the number of disabled widow(er)s in force at the end of the previous calendar year, and applying termination rates. Table III.B70 shows the number of disabled widow(er)s in force by age group.
Awards to disabled widow(er)s are projected using award rates that relate the number of awards to disabled widow(er)s to the uninsured population. (This method may be changed in the future, since microsimulation studies indicate that since 2001, more than 60 percent of those entitled as disabled widows are fully insured.) These award rates are shown in table III.B71, and the number of awards to disabled widow(er)s is shown by 5-year age groups in table III.B72.
The derivation of the number of disabled widow(er)s in current-payment status from the number in force is shown in tables III.B73, III.B74, and III.B75. Projected withheld rates are based upon rates from the most recent historical year, as can be seen in table III.B73. These rates are then multiplied against projected in force numbers, by single year of age, to produce projected withheld numbers. The analogous 5-year age group numbers appear in table III.B74. Finally, the number withheld is subtracted from the number in force to produce the number in current-payment status. Table III.B75 shows the number in current-payment status by 5-year age groups.
The number of disabled widows and widowers in current-payment status increased substantially beginning in 1991, due to a liberalization in the definition of disability that became effective in that year. Increases continued throughout the 1990s. The projections indicate, however, that the number of disabled widows in current-payment status will level off and then diminish slightly during the next 10 years, ending up in 2014 at 202,000. For disabled widowers, growth is expected to continue, from 6.4 thousand in current-payment status in 2004 to 9.5 thousand in 2014.
10. Uninsured Aged Spouses
An individual who is at least 62 years old, and who is the spouse of a retired worker, is eligible for an OASI aged spouse benefit. About 6 percent of such beneficiaries are fully insured; this subgroup was discussed earlier, in the paragraphs describing the projection methods for fully insured workers. The remaining group of uninsured aged spouses are processed separately, as we now describe: Uninsured aged spouses in force are projected by sex and single year of age, at the end of each calendar year, by adding awards during the year to the number in force at the end of the previous year, and applying termination rates. Table III.B76 shows the number of uninsured aged spouses in force, by age group.
Awards to uninsured aged spouses are projected, also by sex and single year of age, using award rates that relate the number of awards in each cohort to the uninsured population. Age group versions of these award rates are shown in table III.B77, while table III.B78 shows the actual awards by age group.
The derivation of the number of uninsured aged spouses in current-payment status from the number in force is shown in tables III.B79, III.B80, and III.B81. Projected withheld rates are based upon rates from the most recent historical year, as can be seen in table III.B79. These rates are then multiplied against projected in force numbers, by single year of age, to produce projected withheld numbers. The analogous 5-year age group numbers appear in table III.B80. Finally, the number withheld is subtracted from the number in force to produce the number in current-payment status. Table III.B81 shows the number in current-payment status by 5-year age groups.
The number of uninsured aged wives in current-payment status has declined about 18 percent over the last 10 years, understandable in part from a parallel decline in the uninsured female population. Over the next 10 years, this number is expected to continue dropping, but at a slower rate, with an additional 6 percent drop by 2014. Uninsured aged husbands in current-payment status, whose ranks total less than 2 percent of their female counterparts, have increased about 25 percent over the last 10 years, but are expected to level off, more or less, over the next 10 years.
Table III.B82 shows a breakdown of all aged spouses in force according to insured status, as well as by major age group (62-64, 65 or older, and total). Table III.B83 gives a similar breakdown for aged spouses in current-payment status.
11. Uninsured Aged Widows and Widowers
An individual who is at least 60 years old, and who is the survivor of an insured worker, is eligible for an OASI aged widow(er)'s benefit. About 38 percent of such beneficiaries are fully insured; this subgroup was discussed earlier, in the paragraphs describing the projection methods for fully insured workers. The remaining group of uninsured aged widows and widowers are processed separately, as we now describe: Uninsured aged widow(er)s in force are projected by sex and single year of age, at the end of each calendar year, by adding awards during the year to the number in force at the end of the previous year, and applying termination rates. Table III.B84 shows the number of uninsured aged widow(er)s in force, by age group.
Awards to uninsured aged widow(er)s are projected, also by sex and single year of age, using award rates that relate the number of awards in each cohort to the uninsured population. Age group versions of these award rates are shown in table III.B85, while table III.B86 shows the actual awards by age group.
The derivation of the number of uninsured aged widow(er)s in current-payment status from the number in force is shown in tables III.B87, III.B88, and III.B89. Projected withheld rates are based upon rates from the most recent historical year, as can be seen in table III.B87. These rates are then multiplied against projected in force numbers, by single year of age, to produce projected withheld numbers. The analogous 5-year age group numbers appear in table III.B88. Finally, the number withheld is subtracted from the number in force to produce the number in current-payment status. Table III.B89 shows the number in current-payment status by 5-year age groups.
For the last 30 years, over 99 percent of the uninsured aged widows and widowers in current-payment status have been female, and the total number of these has dropped almost 20 percent over the last 10 years. Another drop of about 20 percent is projected for the next 10 years. Both drops can be understood in part as an offshoot of the rapid rise in the 60 or older female fully insured rate, from 67 percent in 1994 to 74 percent in 2004, and projected to be 82 percent in 2014. The uninsured aged widowers, on the other hand, are expected to remain at fairly stable levels over the course of the projection period.
Table III.B90 shows a breakdown of all aged widow(er)s in force according to insured status, as well as by major age group (60-64, 65 or older, and total). Table III.B91 gives a similar breakdown for aged widow(er)s in current-payment status.
12. Parents
A person who is the parent of a deceased insured worker, and who is not insured on his or her own earnings record, is eligible for a parent's benefit. Numbers of parents in current-payment status are tiny as compared to aged survivors overall; in 2004 they formed less than 0.05 percent of aged survivors in current-payment status. In addition, parents' numbers are rapidly shrinking, with the number in current-payment status being less than half of the number from 10 years ago (attributable largely to the rapid growth in the insured rate among the aged, especially among females). For these reasons, benefits in force are projected, not by single year of age, but by applying attenuation factors, one for males and another for females, to the corresponding number of parent beneficiaries in force 6 months earlier. Table III.B92 shows the projected numbers of parent beneficiaries in force, and the ratio of each number to the corresponding number from 6 months earlier. It also shows the number of parent beneficiaries withheld and in current-payment status.
The number of parent beneficiaries in current-payment status is projected to continue declining, from 2.1 thousand currently to 1.2 thousand by the end of 2014. About that time, the numbers are expected to stabilize, as the level becomes so low that the number of terminations (based largely on mortality) roughly equals the number of awards.
13. Special Age-72 Beneficiaries
Starting in the late 1960s, a special category of benefit was established for certain men born prior to 1900 and women born prior to 1898. The target group consisted of people who, mostly because of their age, did not have sufficient quarters of coverage to qualify for retired worker benefits in the usual way. These beneficiaries became known as "special age-72" beneficiaries, or as "Prouty" beneficiaries, after the senator who introduced the legislation. The number of special age-72 beneficiaries (including special wife beneficiaries) is projected in a manner similar to that for parent beneficiaries. Since this is virtually a closed group, the ratios of succeeding numbers of beneficiaries are calculated based on survival rates. Table III.B93 shows the projected number of special age-72 beneficiaries in force, and the ratio of each number to the corresponding number from 6 months earlier. It also shows the numbers of special age-72 beneficiaries withheld and in current-payment status.
The number of special age-72 beneficiaries in current-payment status is projected to continue declining rapidly, from fewer than 10 currently (all aged 103 or more) to none by the end of 2005.
14. OASDI Beneficiaries
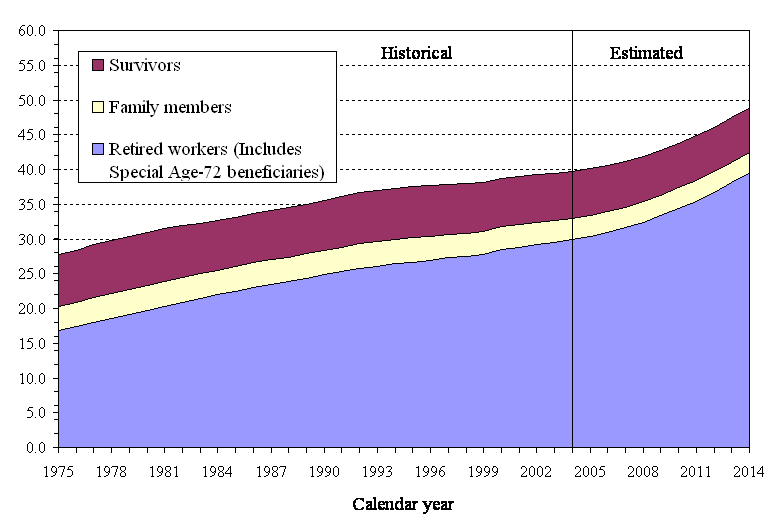
Table III.B94 summarizes numbers in current-payment status for several categories of OASDI beneficiaries. Figure 2 illustrates the growth in the same numbers, over the period 1975-2014, for three broad categories: retired workers (including Prouties), dependents, and survivors. It is noteworthy that while the projected number of retired workers in current-payment status in 2014 reflects an increase of about 100 percent since 1980, the analogous number for dependents reflects a drop of 18 percent since 1980, while survivors show a drop of 16 percent. Figure 3 on page 159 illustrates, for end-of-year 2004 alone, various numbers from table III.B94 as well as the relative proportions of beneficiaries by type.
The total number of OASDI beneficiaries in current-payment status is projected to increase from about 47.7 million at the end of 2004 to nearly 59.0 million by the end of 2014. From 1994 to 2004, the number of disabled workers and auxiliaries increased by 42 percent, and from 2004 to 2014, this number is projected to increase by 28 percent, from 7.9 million to 10.2 million. The number of OASI beneficiaries increased by nearly 7 percent from 1994 to 2004, and it is projected to increase by 23 percent, from 39.7 million to 48.8 million, during the subsequent 10 years.
Figure 2.—OASI Beneficiaries in Current-Payment Status, as of December 31, 1975-2014
[In millions]
|
|
Note: Future estimates based on 2005 Trustees Report intermediate set of assumptions.