Displaying Federal SSI payments as a percentage of GDP provides a useful perspective on the cost of SSI payments relative to the total output of the U.S. economy. As table
IV.D1 and figure
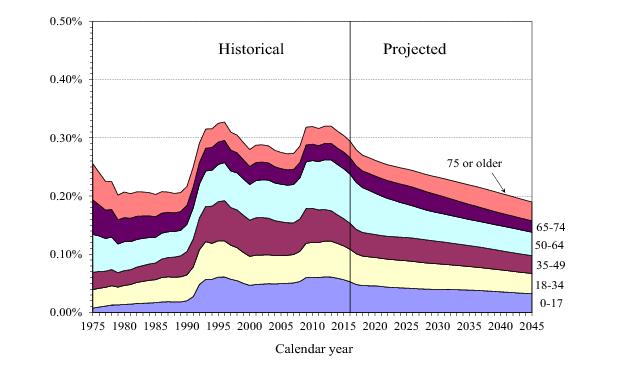
IV.D1 show, after remaining relatively constant between 1992 and 2016, the total cost of the SSI program relative to GDP is projected to decline in 2017 and throughout the remainder of the projection period.
Total Federal SSI payments during the 1980s were relatively constant as a percentage of GDP (roughly 0.2 percent). During the early 1990s, SSI grew rather rapidly (to 0.33 percent of GDP in 1996) due to a combination of factors (see section IV.B). Following legislation enacted in 1996
1, the cost of SSI decreased as a percentage of GDP beginning in 1997 and continuing through 2000. Federal SSI expenditures as a share of GDP increased slightly after 2000, partly because of a slowdown in economic growth over that period, but resumed its very gradual downward trend from 2003 to 2006 due to relatively slower growth in the number of SSI recipients. Beginning in 2007, however, this trend reversed due to an increase in program recipients and a temporary decline in real GDP during the economic recession. In 2013, Federal SSI payments relative to GDP remained at roughly the same level as in 2012, and decreased in 2014 through 2016. As the economy is assumed to continue to recover, the gradual downward trend is projected to resume. This ultimate trend is the net effect of two factors. First, Federal SSI expenditures, after adjusting for growth in prices, are projected to grow roughly in line with the SSI recipient population (see section
IV.C). Second, using the 2017 Trustees Report intermediate assumptions, the effect of the real growth in GDP following the recent economic downturn is projected to be greater than the effect of projected increases in SSI recipients. Accordingly, Federal SSI payments are projected to decline as a percentage of GDP throughout the projection period, until it reaches 0.20 percent of GDP by 2041.