|

|

|

|

|
|
|
|
|
|
|
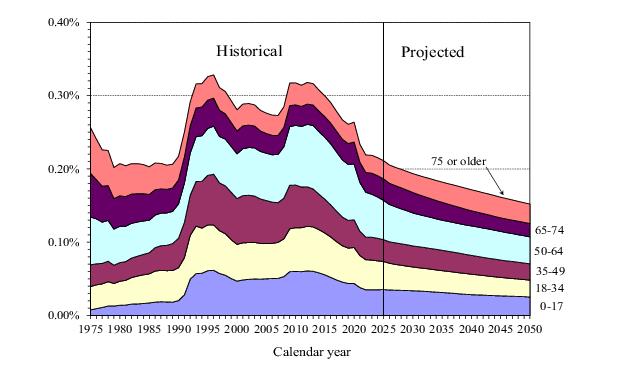
This section presents estimated annual SSI program expenditures as a percentage of gross domestic product (GDP), which provides an additional perspective to assess the cost of the program relative to the size of the national economy. The estimates in this section can be viewed as the estimated proportion of the total output of the U.S. economy needed to provide Federal SSI payments.As table IV.D1 and figure IV.D1 show, during the early 1990s, total Federal SSI payments as a percentage of GDP grew rapidly (to 0.33 percent of GDP in 1996) due to a combination of factors (see section IV.B). Following legislation enacted in 19961, SSI expenditures decreased as a percentage of GDP beginning in 1997 and continued to decline through 2000.Federal SSI payments as a share of GDP is projected to continue this gradual downward trend throughout the projection period until it reaches 0.15 percent of GDP by 2050 due to the net effect of two factors. First, Federal SSI payments, after adjusting for growth in prices, are projected to grow roughly in line with the SSI recipient population (see section IV.C). Second, using the 2026 OASDI Trustees Report intermediate assumptions, the effect of the real growth in GDP is projected to be greater than the effect of projected increases in SSI recipients.
Public Law 104-121 and Public Law 104-193 modified several SSI eligibility rules. See section V.A for more information.
|
|
|
|
|
|
| SSA Home | Privacy Policy | Website Policies & Other Important Information | Site Map | Actuarial Publications | July 22, 2026 | |