This section contains long-range projections, in dollars, of the operations of the theoretical combined OASI and DI Trust Funds and in some cases the HI Trust Fund. Comparing current dollar values over long periods of time is difficult because of the effect of inflation. In order to compare dollar values in a meaningful way, table
VI.G6 provides several economic series or indices which can be used to adjust
current dollars for changes in prices, wages, or other aspects of economic growth during the projection period. Any series of values can be adjusted by dividing the value for each year by the corresponding index value for the year.
One of the most common forms of standardization is price indexing, which uses some measure of change in the prices of consumer goods. The Consumer Price Index for Urban Wage Earners and Clerical Workers (CPI-W, hereafter referred to as CPI), published by the Bureau of Labor Statistics, Department of Labor, is one such price index. The Social Security Administration (SSA) uses this index to determine the annual cost-of-living increases for OASDI monthly benefits. The ultimate annual rate of increase in the CPI is assumed to be 3.4, 2.7, and 2.0 percent for the low-cost, intermediate, and high-cost sets of
assumptions, respectively. Table
VI.G7 provides CPI-indexed dollar values (those adjusted using the CPI in table
VI.G6), which indicate the relative purchasing power of the values over time.
Wage indexing is another type of standardization. It combines the effects of price inflation and real-wage growth. The wage index presented here is the national average wage index, as defined in section 209(k)(1) of the Social Security Act. SSA uses this index to annually adjust the contribution and benefit base and other earnings-related program amounts. The average wage is assumed to grow by an average rate of 5.2, 3.9, and 2.5 percent under the low-cost, intermediate, and high-cost assumptions, respectively, between 2024 and 2089. Wage-indexed values indicate the level of a series relative to the standard of living of workers over time.
The taxable payroll index adjusts for the effects of changes in the number of workers and changes in the proportion of earnings that are taxable, as well as for the effects of price inflation and real-wage growth. The OASDI taxable payroll consists of all earnings subject to OASDI taxation, with an adjustment for the lower effective tax rate on multiple-employer
excess wages. A series of values, divided by the taxable payroll, indicates the percentage of payroll that each value represents, and thus the extent to which the series of values increases or decreases as a percent of payroll over time.
Discounting at the rate of interest is another way of adjusting current dollars. Each interest-rate factor shown in table VI.G6 equals the average of the assumed annual interest rates for special public-debt obligations issuable to the trust funds in that year. This series is slightly different from the annual interest rates used to create summarized values elsewhere in this report, where the actual yield on currently-held trust fund assets is used for each year. Ultimate nominal interest rates, which in practice are compounded semiannually, are assumed to be 6.8, 5.6, and 4.4 percent for the low-cost, intermediate, and high-cost assumptions, respectively.
Table VI.G7 shows the operations of the theoretical combined OASI and DI Trust Funds in CPI-indexed 2015 dollars—that is, adjusted by the CPI indexing series as discussed above. The following items are presented in the table: (1) non-interest income, (2) interest income, (3) total income, (4) cost, and (5) asset reserves at the end of the year. Non-interest income consists of payroll tax contributions, income from taxation of benefits,
and reimbursements from the General Fund of the Treasury, if any. Cost consists of scheduled benefits, administrative expenses, financial interchange with the Railroad Retirement program, and payments for vocational rehabilitation services for disabled beneficiaries. Table
VI.G7 shows trust fund operations under the low-cost, intermediate, and high-cost sets of assumptions.
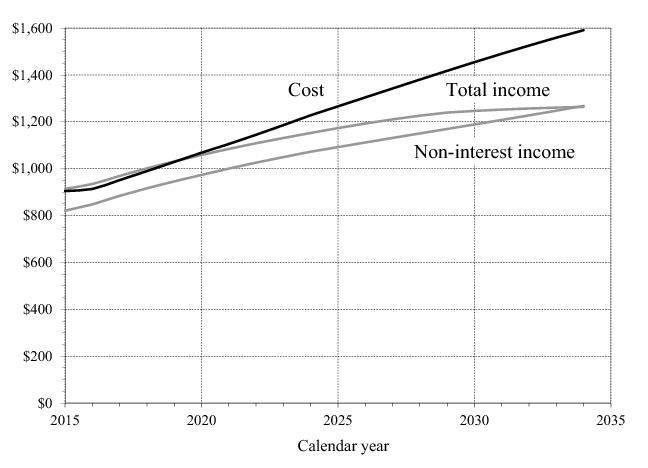
Figure VI.G1 compares annual cost with annual total income and annual non-interest income. The figure shows only the OASDI program under intermediate assumptions, and presents values in CPI-indexed 2015 dollars, consistent with table
VI.G7. The difference between the income values for each year is equal to the trust fund interest earnings. The figure illustrates that, under intermediate assumptions: (1) annual cost exceeds non-interest income in each year of the projection period; (2) total annual income, which includes interest earnings on trust fund asset reserves, is sufficient to cover annual cost for years 2015 through 2019; and (3) total annual income is not sufficient to cover annual cost for years beginning in 2020. From 2020 through 2033 (the year preceding the year of trust fund reserve depletion), annual cost is covered by drawing down theoretical combined trust fund reserves.
Table VI.G8 shows the operations of the combined OASI and DI Trust Funds in current, or nominal, dollars —that is, in dollars unadjusted for inflation. The following items are presented in the table: (1) non-interest income, (2) interest income, (3) total income, (4) cost, and (5) asset reserves at the end of the year. The Trustees present these estimates using the low-cost, intermediate, and high-cost sets of demographic and economic assumptions to facilitate independent analysis.
Table VI.G9 shows values in CPI-indexed 2015 dollars—that is, adjusted by the CPI indexing series discussed at the beginning of this section. This table contains the annual non-interest income and cost of the combined OASI and DI Trust Funds, of the HI Trust Fund, and of the combined OASI, DI, and HI Trust Funds, based on the low-cost, intermediate, and high-cost sets of assumptions. For OASDI, non-interest income consists of payroll tax contributions, proceeds from taxation of OASDI benefits, and reimbursements from the General Fund of the Treasury, if any. Cost consists of scheduled benefits, administrative expenses, financial interchange with the Railroad Retirement program, and payments for vocational rehabilitation services for disabled beneficiaries. For HI, non-interest income consists of payroll tax contributions (including contributions from railroad employment), up to an additional 0.9 percent tax on earned income for relatively high earners, proceeds from the taxation of OASDI benefits,
and reimbursements from the General Fund of the Treasury, if any. Total cost consists of outlays (scheduled benefits and administrative expenses) for insured beneficiaries. The Trustees show income and cost estimates on a cash basis for the OASDI program and on an incurred basis for the HI program. Table
VI.G9 also shows the balance, which equals the difference between non-interest income and cost.