Committee on Economic Security (CES)
"Social Security In America"
APPENDIXES
APPENDIX II
PROCEDURES FOLLOWED IN ESTIMATING DURATION OF UNEMPLOYMENT IN THE UNITED STATES, 1922-33
The amount of benefits paid under any unemployment compensation plan is based upon the number of weeks lost by the eligible unemployed within a specified benefit period. In order to find the proportion of total time lost by the unemployed which will be compensated by benefit payments, it is necessary to estimate the distribution of the eligible unemployed by the duration of their unemployment. A study of duration of unemployment was undertaken for the purpose of determining from the available data the most probable distribution of the eligible unemployed in the United States by duration of unemployment in the different years in order to estimate the amount of benefits payable under a hypothetical plan of unemployment compensation in effect from 1922 to 1933, inclusive.
SOURCES AND INADEQUACIES OF AVAILABLE DATA
Complete data on unemployment duration can be obtained only from enumerations covering both the employed and the unemployed taken at frequent and regular intervals of time. In fact, a history of the employment of each individual in a group would have to be traced in order to procure complete data for accurately computing benefits to be paid to the group. No such record of employment and unemployment experiences exists for any considerable number of persons over any considerable period of time.
Such unemployment data as have been accumulated in recent years are those collected by the United States Bureau of the Census, the United States Bureau of Labor Statistics, various State departments of labor, and local research organizations. These are fragmentary and sporadic from the standpoint of a chronological record for the United States as a whole over a period of time. The United States census of unemployment taken in April 1930 covered the entire United States, whereas the unemployment census taken in January 1931 covered only 19 cities. During previous and succeeding years surveys have been made in only a few localities and only in very few instances for consecutive periods.
Not only are various years and areas inadequately represented in the availaliie studies, but unemployment itself is incompletely surveyed. Only those unemployed on the day a census was taken are listed in the unemployment tabulations, and consequently the part-time unemployment and the idleness previously experienced by those employed on the enumeration day are ignored. Furthermore, no account is taken of intermittent unemployment. These census or survey results thus present a discontinuous or static picture of unemployment rather than a continuous or dynamic picture. This necessitated the assumption that the duration characteristics of the unemployed at the time of the census or survey would also apply to the unemployed at other times when the late of unemployment was practically the same.
There are other inadequacies in the data: (1) the surveys were made independently for diverse purposes and under various circumstances; (2) some were
404
complete coverages, others were samples, selective and random; (3) duration was only one factor considered; (4) the definition of unemployment and classifications of the unemployment tabulations varied; (5) the method of presentation of the tabulations differed; e. g., the first duration interval in one study was expressed as "more than 1 day", in another study as "1 week or less", in yet another as "less than 1 month", etc.; (6) duration intervals varied, some surveys showing duration by weeks, some by months, and others by still longer periods.
Various procedures or adjustments were devised to minimize as much as possible the effects of the limitations of the original data, and it is thought that the different distributions of unemployment by duration secured in this study are the best obtainable from the available material and are fair approximations for the United States in the various years under consideration.
STUDIES USED AND INFORMATION TAKEN FROM THEM
Of the available surveys on duration only those were utilized which covered entire cities, or areas representative of entire cities, which segregated the unemployed "able and willing to work" from the total unemployed population, and which presented enumerations in such form that they were either comparable or could apparently be made comparable with other enumerations used. These surveys were drawn from the following sources:
United States Bureau of Labor Statistics, Bulletin No. 195, July 1916, 16 cities in the East sad Middle West, March and April 1915.
United States Bureau of Labor Statistics, Bulletin No. 195, July 1916, New York City, February and September 1915.
United States Bureau of Labor Statistics, Bulletin No. 409, June 1926, Columbus, Ohio, last week in October, each year 1921-1925.
Monthly Labor Review, April 1930 ; Maryland Commissioner of Labor and Statistics Survey, Baltimore, Md., February, each year 1928-1930.
New York State Department of Labor, Bulletin No. 163, 1930, and Bulletin No. 179, 1932 ; Buffalo Foundation Surveys, Buffalo, N. Y., November, each year 1929-1932.
United States Bureau of Labor Statistics, Bulletin No. 520, June 1930, and Bulletin No. 555, March 1932 ; University of Pennsylvania Industrial Research Department, Wharton School of Finance and Commerce, Special Report No. 3, March 1, 1932, Philadelphia, Pa., April, each year, 1929-1932.
University of Minnesota, Employment Stabilization Research Institute Bulletin, vol. I, no. 6, August 1932, Minneapolis, St. Paul, and Duluth, Minn., November 1930.
U.S. Department of Commerce, Bureau of the Census, Fifteenth Census of the United States: 1930; "Unemployment" (U. S. Government Printing Office, Washington, D. C., vol. I, 1931 ; vol. II, 1932).
New York State Department of Labor Statistics, Special Bulletin No. 173, 1932, Syracuse, N. Y., November 1931.
Report Louisville Employment Survey, Commonwealth of Kentucky, Department of Labor, Louisville, Ky., March 16-May 16, 1933.
The above surveys yielded material of two types:
(1) Distributions of unemployment.--Ninety-two different "duration" distributions of the unemployed able and willing to work, including over 5,000,000 schedules, and representing 46 different cities widely scattered over the United States, in 10 different and nonconsecutive years. Nineteen of these distributions represent the results of the United States Unemployment Census in 19 cities in January 1831, and 35 cities were selected from the April 1930 United States Unemployment Census.
(2) Percent of gainful workers unemployed.--The number of gainful workers, the number of unemployed able and willing to work, and the percentage of gainful workers unemployed within a city on the day the survey was made were also used for the majority of the enumerations.
The 92 enumerations were recorded in such fashion that for each an absolute frequency, a percentage frequency, and a cumulative percentage frequency dis-
405
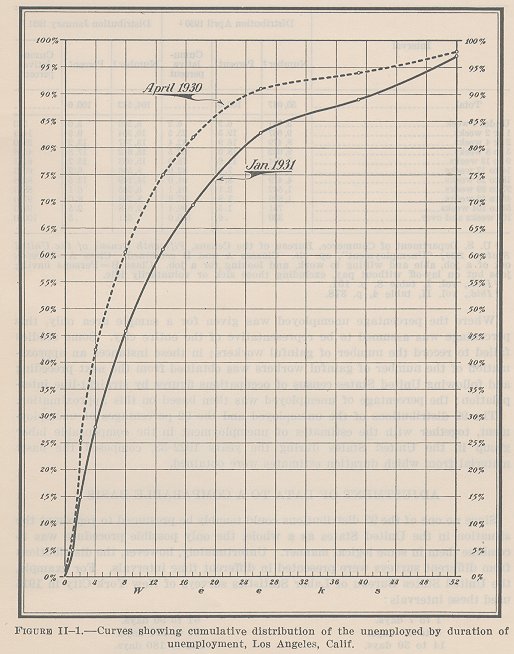
tribution of the unemployed according to the length of their idleness ( since their last regular employment) at the date of the survey were displayed or could be readily computed. Table II-1 and figure II-1, showing the data for Los Angeles for April 1930 and January 1931, are illustrative of the 92 sets of distributions obtained from the studies. In the cases where the enumerations were limited to representative areas, it was assumed that the distribution of the unemployed able and willing to work within the area was representative of all the unemployed able and willing to work in the entire city, and the frequency distributions were weighted accordingly.
Where the percentage unemployed was given for a sample area only, this percentage was assumed to be representative of the entire city. Some studies failed to record the number of gainful workers; in these instances an approximation of the number of gainful workers was obtained from the next preceding and following United States census of occupations figures by straight-line interpolation; the percentage of unemployed was then based on this approximation.
The 92 distributions of the unemployed and the 92 percentages of unemployment, together with the estimates of unemployment in the compensable labor group in the United States during the years 1922-33, composed the basic material from which duration estimates were obtained.
ADJUSTMENT OF DATA TO A COMPARABLE BASIS
Since no one of the 92 distributions could tenably be presumed to represent the situation in the United States as a whole, the only possible procedure was to combine them in some logical manner. Unfortunately, however, the distributions from different surveys were presented in different time intervals. For example, the United States Bureau of Labor Statistics surveys of New York City in 1915 used these intervals:
| 1 to 7 days. | 61 to 90 days. |
| 8 to l3 days. | 91 to 120 days. |
| 14 to 30 days. | 121 to 180 days. |
| 31 to 60 days. | 181 days and over. |
406
The intervals used in the University of Pennsylvania survey of Philadelphia
in 1931 were:
| 1 day and over. | More than 6 months. |
| More than 1 week. | More than 7 months. |
| More than 1 month. | More than 8 months. |
| More than 2 months. | More than 9 months. |
| More than 3 months. | More than 10 months. |
| More than 4 months. | More than 11 months. |
| More than 5 months. | More than 1 year. |
This disparity in classification made it necessary to adopt a common class interval to which all the series were converted. This was done by interpolation. For each enumeration the original percentage distribution was plotted on a cumu-
408
lative basis, and through the plotted points a smoothed curve was drawn. By reading successive differences of cumulative percentages taken from the curve, a percentage distribution classified by weekly intervals was obtained; and comparable frequencies in terms of absolute numbers were obtained by applying the derived percentage distribution to the number unemployed. Table II-2 shows the values read from the cumulative percentage curves, together with the derived percentage and absolute frequency distributions, for Los Angeles, Calif., April 1930 and January 1931, and is typical of the 92 sets of data derived by the interpolation method.{1}
The cumulative percentage curve was used for breaking down the original data into small and regular intervals because of the peculiar properties which this curve, as contrasted with the simple frequency curve, for instance, is recognized to possess. The individuals in a large group of unemployed might be classified into a number of different frequency distributions; one distribution of the group is obtained when the difference between successive duration intervals is 1 week; another results when the difference is 1 month, etc., but, if the percentages of each of these frequency distributions are cumulated and plotted against time, the resulting cumulative curves will tend to be identical. In other words, a cumulative distribution curve represents all the different frequency distributions that can be made of a given group. Once the cumulative curve for the group is determined, any desired frequency distribution can be obtained by reading points at equal intervals along the curve.
The points plotted for each of the 92 curves occurred at irregular and often infrequent intervals, so that it was sometimes difficult to determine the exact direction of the curve. Therefore, preliminary to drawing curves through the plotted points, certain hypothetical frequency distributions, presumably representing all the types which might occur, were set up, and corresponding frequency and cumulative curves were plotted from these hypothetic data. In constructing the distributions it was assumed that an unemployment duration classification for a given locality at a given instant of time does not necessarily produce a normal or bell-shaped probability curve, nor necessarily a skewed curve. Figure II-2 shows these hypothetical distributions and the corresponding curves. Curves I, II, III, V, and VI have the largest percentage of unemployed occurring within a single duration interval. Curve IV shows a concentration of the unemployed at two duration intervals. It would be possible to have even three peak periods in the frequency distribution. However, such a distribution is not very probable if the longest unemployment period is only 1 year. An analysis of the six types of curves was very helpful in drawing the cumulative curves representing the 92 tabulations. It is interesting that all six types of hypothetical curves were represented among those plotted from the original data, and that of the six, curve V occurred most frequently.
COMBINING THE 92 FREQUENCY DISTRIBUTIONS AND APPLYING THE RESULTING COMPOSITE CURVES
If all years in the period 1922-33 and all areas for each year had been adequately represented in the sample, the most logical basis for combining the distributions would have been on a time basis by years. However, a representative sampling of different sections of the country during any given year
{1} A large-scale, millimeter-ruled graph paper, 20 centimeters wide, was used in order to insure accurate plotting and readings from the cumulative percentage curves. On the scale 1 centimeter equaled 2 percent plotted vertically, and 1 centimeter equaled 2 weeks plotted horizontally.
409
410
was not furnished by the data, and the different years within the period were by no means equally represented in the sample. In fact, enumerations were entirely lacking for 1 or 2 years of the period and for several other years data were available for only one or two cities. Consequently some reasonable basis of combination other than a time basis had to be sought. A logical basis seemed to be the percentage of unemployment, and a set of composite distributions of duration of unemployment for different magnitudes of unemployment was accordingly built.
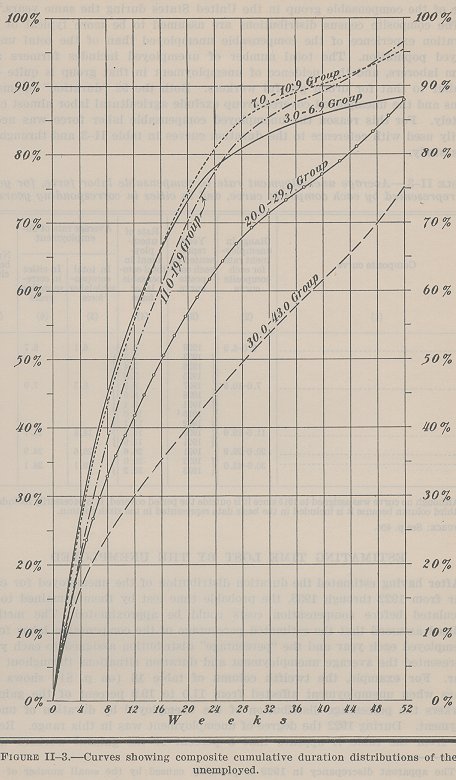
The 92 surveys were segregated into 5 groups according to the percentage of gainful workers unemployed at the time the survey was made. Originally 10 percentage intervals of approximately equal height were used as a basis for combining the 92 surveys. But a number of the resulting composite distributions were without distinguishing characteristics. Consequently consecutive distributions which were practically alike were combined, and the five curves shown in figure II-3 were obtained. Surveys for which the percentage of unemployment ranged from 3.0-6.9 were included in the first group. For the second, third, fourth, and fifth groups the range was 7.0-10.9, 11.0-19.9, 20.0-29.9, and 30.42.9, respectively. Ten censuses fell into the first group, 24 fell into the second, 36 in the third, 16 in the fourth, and 6 in the fifth. The composite distributions obtained from these groupings are shown in table 18 on page 84. Figure II-3 shows the corresponding cumulative curves.
After obtaining the five duration distributions, the next step was to apply them to national unemployment. Two assumptions offered a basis for the application of the curves. The first was that the duration curve varies with the degree of unemployment or, in other words, as the relative proportion of workers unemployed increases, the average duration of unemployment also increases. One would expect a larger proportion of the unemployed within the shorter duration intervals if, for instance, the percentage unemployed was only 3.0. If 48.0 percent of the gainful workers were idle, one would expect the majority of the unemployed to have been without work for relatively long periods. The larger the proportion of the labor force unemployed, the greater the difficulty of speedy reemployment, and the longer the duration of unemployment.
To check the validity of this assumption a correlation between average duration and the percentage of unemployment for each of the 92 enumerations was made using the Pearsonian coefficient of correlation formula. A positive coefficient of 0.71 with a probable error of plus or minus 0.03 was obtained for those unemployed less than 1 year. This coefficient is sufficiently high and the probable error sufficiently small to lend support to the supposition that a fair positive correlation exists between the shape of the distribution curve and the relative amount of unemployment.
The second assumption was that a distribution curve at a certain percentage of unemployment is representative of the duration situation in the covered group in the United States when a corresponding percentage of unemployment exists in that group. Thus if the rate of unemployment in the covered group is 6.0 percent in 1929, the "3.6.9" curve derived from the surveys is accepted as representative of the group. Table II-3 tends to support this assumption.
In the third column, table II-3 shows to which years each of the five composite curves was assigned. The fifth and sixth columns show the average percentage of unemployment in the compensable group in the United States for each of the five combinations of years as compared with the average percentage of unemployment in cities for which surveys of unemployment for the corresponding years were used. The fairly close agreement between percent-
411
412
ages in columns 5 and 6 indicates that the unemployment conditions prevailing during given years in cities sampled in this study were generally representative of the compensable group in the United States during the same years.{2}
The composite census distributions are assumed to be more typical of the duration experience of the compensable unemployed than of the total unemployed population. The total number of unemployed includes farmers and farm laborers, and the incidence of unemployment in that group is quite dissimilar to that for urban gainful workers. Both the 92 "duration" enumerations and the unemployed covered group exclude agricultural labor almost completely. For this reason the unemployed compensable labor force was necessarily used with reference to the duration curves in table II-3 and throughout this study.
ESTIMATING TIME LOST BY THE UNEMPLOYED
After having estimated the duration distribution of the unemployed for each year from 1922 through 1933, the probable time lost by them remained to be calculated before compensation costs could be approximated. The method utilized assumed that the estimated percentage of the compensable labor force unemployed each year and the "percentage" distribution assigned to each year represented the average unemployment and duration situations throughout the year. For example, the twelfth column of table 18 (on p. 84) shows for years when unemployment affected from 11.0 to 19.9 percent of the gainful workers the percentage distribution of the unemployed by duration of unemployment. During 1922 the degree of unemployment was in this range. Reading from the table it appears that 5 percent of the gainful workers were
{2} The apparent discrepancy in 1929 is probably caused by the small number
of city surveys used.
413
unemployed 1 week or less, 21.1 percent 4 weeks or less, 25.2 percent 5 weeks or less, 43.5 percent 10 weeks or less, 70.1 percent 20 weeks or less, 89.5 percent 40 weeks or less, and 94.8 percent 50 weeks or less. The average number of unemployed in 1922 is estimated as 2.61 million persons.{3} These percentages of unemployment by duration are assumed to be the same for the first 1-week period and for all subsequent 1-week periods throughout the year. Seasonal fluctuations are disregarded except to the extent that seasonal factors are reflected in the averages of the basic data. This means that although the identity of the unemployed is recognized to shift continually throughout the year, the average number unemployed for the year and the distribution of that number are assumed to be represented by the one set of data. In other words, at the end of each week in the year 1922, 2.61 millions of the unemployed are assumed to have lost a full week's time, though the individuals represented by the 2.61 millions are not identical for each week. The total time lost by all the unemployed in 1922 would therefore be estimated as 135.72 million man-weeks (2,610,000 X 52 weeks) or as 2.61 million man-years.
Suppose a benefit period of 16 weeks and a waiting period of 4 weeks were provided by the unemployment compensation plan. Then at the end of each week in 1922, 49.0 percent of the unemployed would have been unemployed from 5 to 20 weeks, inclusive, and would therefore have been eligible for a full week of benefits (70.1 percent-21.1 percent). The total compensable weeks lost would equal 66.50 million weeks (2,610,000X52 weeksX49.0 percent) or 1.28 million years. By applying compensable man-weeks to average weekly benefits or compensable man-years to average yearly benefits, the total amount of benefits could be approximated. The detail of this procedure is set forth in appendix III.
{3}This estimate and the computations based upon it are on the basis of
the coverage assumed in the report of the Committee on Economic Security
to the President.