Short-Range Actuarial Projections
of the Old-Age, Survivors, and
Disability Insurance Program, 2005

Contents Previous Next List of Tables List of Figures
ACTUARIAL STUDY NO. 119
by Chris Motsiopoulos
and Richard B. Tucker
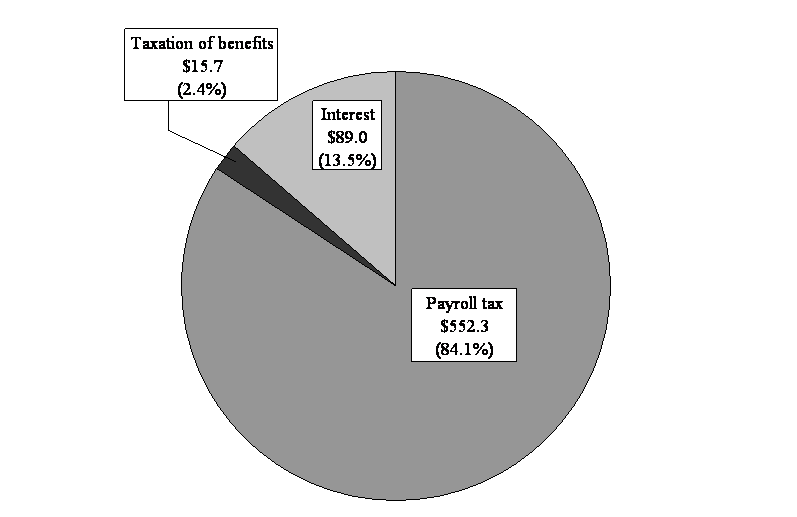
Figure 5.—Income of the Combined OASI and DI
Trust Funds, Calendar Year 2004
[In billions]
[D]

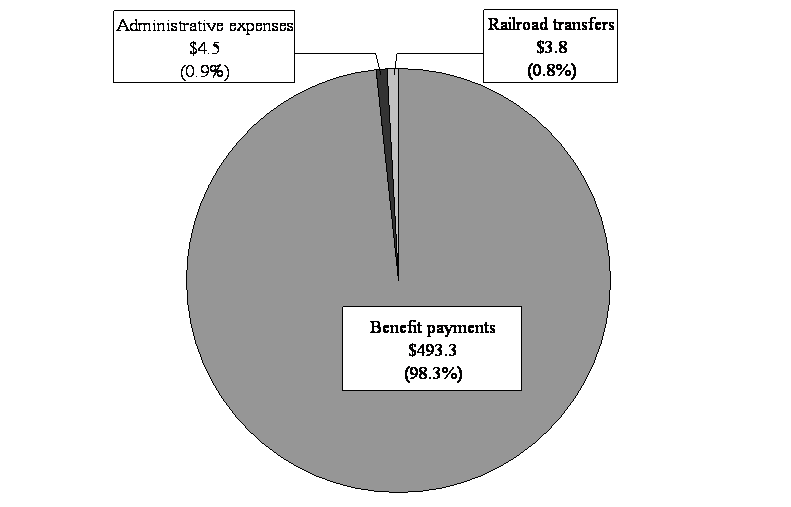
Figure 6.—Outgo of the Combined OASI and DI
Trust Funds, Calendar Year 2004
[In billions]
[D]

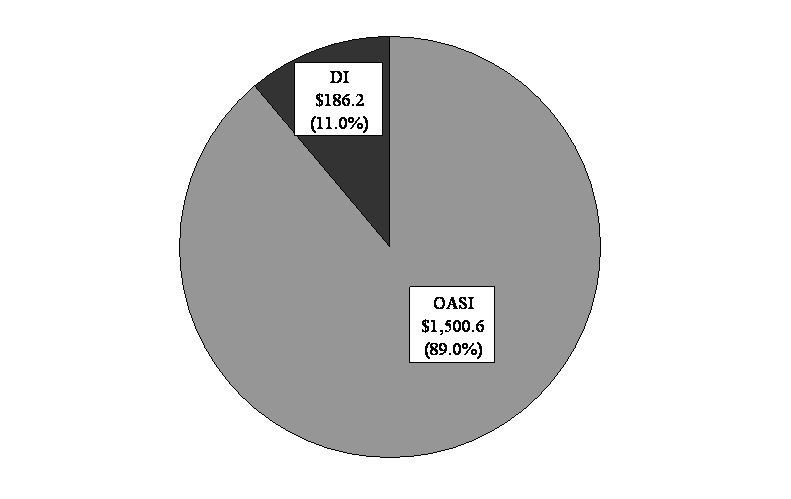
Figure 7.—Assets of the Combined OASI and DI
Trust Funds, as of December 31, 2004
[In billions]
[D]

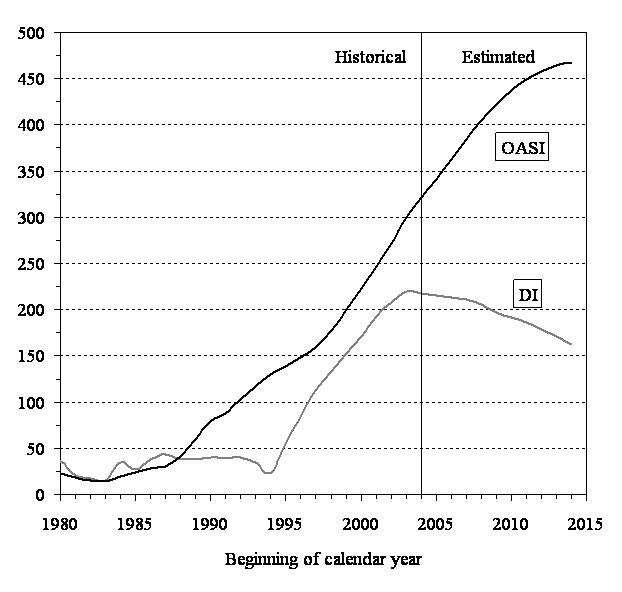
Figure 8.—Trust Fund Ratios of the OASI and DI
Trust Funds, Calendar Years 1980-2014
[In percent]
[D]

Note: Future estimates based on 2005 Trustees Report intermediate set of assumptions.


Contents Previous Next List of Tables List of Figures