To estimate future amounts of Federal expenditures under SSI, the projected Federal benefit rates (table
IV.A2) are first modified to reflect actual payment levels, taking into account historical and projected levels of adjustments for other actual or deemed income, marital status, and living arrangements. These actual payment levels are combined with the projected numbers of persons receiving Federal SSI payments to generate estimates of the total amounts of Federal SSI payments. Table
IV.C1 shows historical amounts of such payments by calendar year. These payment amounts are presented on a payment-date basis, which is consistent with the concepts used to define SSI obligations for the Federal Budget. As a result, for months after January 1978, when SSI payments are due on the first of the month and the first of the month falls on a weekend or Federal holiday, these payments are made in the previous month.
1
Based on this payment-date concept, payments in table IV.C1 differ from similar amounts in other SSA publications, such as the
Annual Statistical Supplement to the Social Security Bulletin, in two main ways. First, tabulations of payments in the
Annual Statistical Supplement group payments by the month the payment is due, while table
IV.C1 groups payments by the month in which the payments are made. In particular, since January 1 of each year is a Federal holiday, SSI payments due on January 1 of years 1979 and later are actually paid in December of the previous year. For example, the calendar year 2016 payment amounts shown in table
IV.C1 reflect payments made in January-December 2016, and include the payments due on January 1, 2017 (which were actually paid in December 2016), but not the payments due on January 1, 2016 (which were actually paid in December 2015). Second, beginning in 1991, SSI obligations as accounted for in the Federal Budget are not reduced for certain recovered overpayments which are remitted directly to the Department of the Treasury. Tabulations in the
Annual Statistical Supplement continue to report payment amounts that are reduced by such overpayment recoveries.
Table IV.C2 presents corresponding amounts of historical SSI outlays on a fiscal year basis for fiscal years
2 1978-2016 and projected outlays for fiscal year 2017. Fiscal years prior to 1978 are omitted because SSI payment amounts are not readily available on a fiscal year basis for these years. As with the calendar year figures, these fiscal year amounts are shown on a payment-date basis. Consequently, fiscal year totals may contain 11, 12, or 13 months of payments.
3
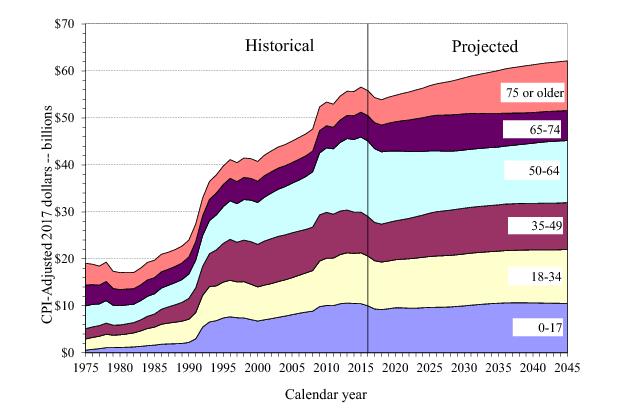
Because the Federal benefit rate is generally indexed to changes in the CPI, price inflation contributes to increases in the total dollar amounts of Federal SSI expenditures over time. Table IV.C3 presents “constant 2017 dollar” values of total Federal SSI payments (values adjusted to remove from total expenditure growth the increases in the
CPI) for both the historical period, calendar years 1974-2016, and the full 25-year projection period, 2017-2041. This same information is presented as a graph in figure
IV.C1. The projections of the CPI are based on the intermediate economic assumptions of the 2017 OASDI Trustees Report. By adjusting the historical and projected total amounts of SSI expenditures to remove the change in the CPI, the resulting projected amounts reflect all other reasons for change, including changes in (1) the number of recipients, (2) the composition of the recipient population by categorical eligibility, age, and sex, (3) the average SSI payment as a percentage of the Federal benefit rate due to distributional changes marital status, living arrangements, and sources and amounts of countable income, and (4) changes in the Federal benefit rate itself other than the changes from indexing to the CPI. Section
IV.D presents an additional perspective on Federal expenditures by examining the share of the total output of the U.S. economy (GDP) needed to support the SSI program.
The future growth in the total Federal “CPI-adjusted dollar” estimates is primarily attributable to the underlying growth in the SSI recipient population (table
IV.B6). A notable aspect of this time series of CPI-adjusted dollar estimates is the rather sharp level increase from 2008 to 2009. This level shift is the result of the combination of the spike in the CPI for the third quarter of calendar year 2008, which caused the large 5.8 percent benefit rate increase for 2009, and the subsequent drop in the CPI for 2009.
Table IV.C4 presents historical SSI State supplementation payments that SSA administers for two broad recipient categories. These amounts are consistent with tabulations in the
Annual Statistical Supplement to the Social Security Bulletin. Detailed projections of such payments are not currently prepared.