2021 Annual Report of the SSI Program

Table of Contents Previous Next Tables Figures

B. Numbers of SSI Program Recipients
This section presents historical data and projections of the numbers of (1) persons applying for SSI payments; (2) new recipients of SSI payments as a result of an application; (3) terminations from SSI payment status; and, (4) recipients of federally administered SSI payments. These historical data and projections are presented by category and age group.1 All of the corresponding tables are located at the end of this section.
1. Recipient Categories
SSI recipients are classified into one of two categories based on the criteria for which they are eligible, in addition to meeting other SSI eligibility requirements. The two general categories are (1) aged; or (2) blind or disabled. The following paragraphs discuss the recipient categories in more detail.
Aged recipients establish their eligibility for SSI payment by meeting the age-65 -or-older requirement2, the applicable income and resource limits, and other SSI eligibility requirements. In December 2020, 1.1 million aged individuals received federally administered SSI payments.
Blind or disabled recipients establish their eligibility for SSI payments by meeting the definition of blindness or disability and the applicable income and resource limits as well as any other SSI eligibility requirements. In December 2020, there were 6.8 million blind or disabled recipients of federally administered SSI payments. These recipients can fall into two subcategories based on age: blind or disabled adults (age 18 or older) and blind or disabled children (under age 18).
Blind or disabled adults meet the definition of blindness or disability for individuals age 18 or older and SSI income and resource limits. Students age 18 to 21 must meet the adult definition of disability; they differ from other adults only in that they may qualify for a special student earned income exclusion. When blind or disabled adult recipients reach age 65, these individuals generally continue to be classified as blind or disabled adults (rather than aged). In December 2020, 5.7 million blind or disabled individuals age 18 or older received federally administered SSI payments, including 1.2 million blind or disabled recipients age 65 or older.
Blind or disabled children meet the definition of blindness or disability for individuals under age 18 in addition to other SSI eligibility requirements. These children are subject to parent-to-child deeming until they reach the age of 18. At age 18 these individuals continue to be eligible for SSI if they meet the definition of blindness or disability for individuals age 18 or older as well as other eligibility criteria. Those individuals who continue to be eligible after attainment of age 18 are reclassified as blind or disabled adults. In December 2020, 1.1 million blind or disabled individuals under age 18 received federally administered SSI payments.
2. Applications and New Recipients
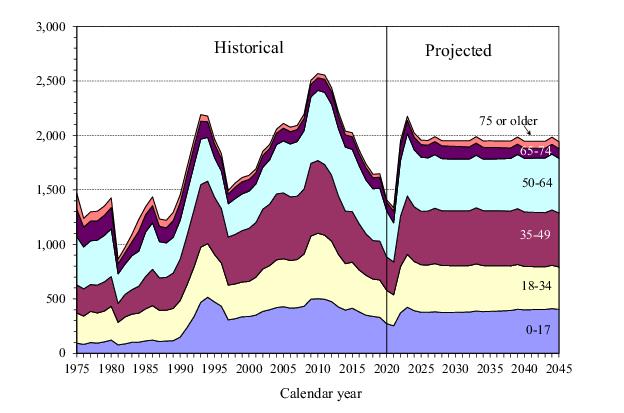
Figure IV.B1 presents historical and projected numbers of persons applying for SSI payments at SSA field offices, including applications taken by telephone and online, by calendar year.3 Following a 4-year period in the mid-2000s when the number of applications remained fairly level at 2.1 million per year, applications increased from 2008 through 2010, largely due to the recession of 2007-2009. The level of applications generally decreased from 2010 through 2018 as the economy recovered. Applications in 2019 remained at about the same level as experienced in 2018. The number of applications decreased sharply in 2020, due to a number of pandemic-related effects. In 2021, the number of applications is projected to remain low as the pandemic continues. In 2022 and 2023, the number of applications is projected to increase sharply, primarily attributable to two reasons: (1) many people who delayed applying for benefits during the pandemic are assumed to eventually apply as the pandemic abates, and (2) the reduced employment levels in 2020 and 2021 is expected to induce some individuals who would not have applied in the absence of the pandemic and recession to apply as pandemic-related relief payments enacted by legislation expire. In 2024 and 2025, the number of applications is projected to return to levels more consistent with longer-term expected experience, decreasing from the levels projected in 2022 and 2023 to about 2.0 million applications per year, and then remain at roughly this level thereafter.4
In the shorter term, the rate of application underlying the projected number of applications follows the pattern described above for the applications themselves, remaining low in 2021, increasing in 2022 and 2023, and decreasing in 2024 and 2025. Beyond the short term (after 2025) the application rate is assumed to gradually decline, with this declining rate being offset by the projected increase in the Social Security area population yielding relatively stable numbers of applications, as shown in section A. This gradual decline in the application rate after 2024 reflects the following assumptions: (1) the portion of the population that meets SSI income and resource requirements will decline over time as average wages and income generally grow faster than the CPI, and therefore the SSI Federal benefit rate; (2) the fixed value of the countable resource limits and most of the income exclusions become more limiting over time as individuals’ income and asset levels grow generally; and (3) the portion of the population composed of U.S. citizens or legal immigrants potentially eligible to become SSI recipients declines.
 
 
The assumptions used for the projections in this report are consistent with the demographic and economic assumptions underlying the 2021 OASDI Trustees Report. Generally, the programmatic assumptions underlying the projections in this report are also developed to be consistent with the assumptions used in the 2021 Trustees Report, where appropriate. However, due to the rapidly evolving application experience since the time the assumptions for the Trustees Report were developed, the projected pattern of SSI applications is somewhat different than assumed for the Trustees Report.
 
As part of SSA’s adjudication of these applications, the levels of income and resources available to the applicants are evaluated along with other eligibility factors including marital and citizenship status and living arrangements. In addition, over 90 percent of the SSI applications are for disability payments that require the State Disability Determination Services (DDS) to evaluate the alleged impairment. Applicants may appeal an unfavorable disability determination through several administrative levels of appeal. If applicants exhaust all administrative levels of appeal, they may appeal to the Federal courts.5 An applicant may decide at any point in this process to file a new application for benefits in lieu of continuing through the prescribed appeals process, generally provided that the individual does not currently have an appeal of an SSI application pending in this process.
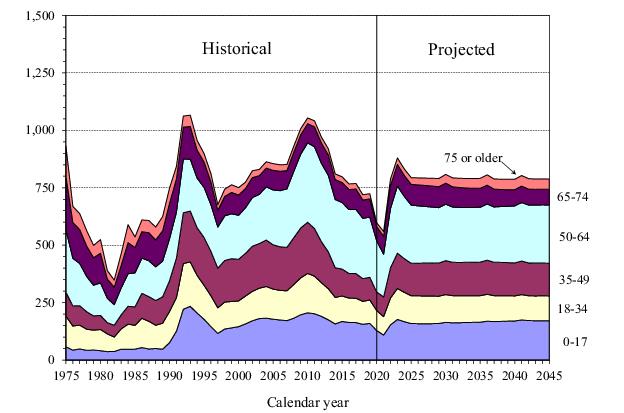
6
 
Figure IV.B2 presents historical and projected numbers of persons who start receiving SSI payments as a result of this decision process7. From 2004 to 2007, the numbers of new recipients remained fairly level, roughly consistent with the applications received during this period. From 2007 to 2010, however, the numbers of new recipients increased substantially. This increase is primarily attributable to the sharp increase in applications due to the 2007-09 economic recession.
The numbers of new recipients declined generally from 2010 to 2018, leveled off in 2019, and decreased sharply in 2020, following the pattern of applications. The projected number of new recipients also generally follows the pattern of the projected numbers of applications in the first few historical years, remaining low in 2021, increasing sharply in 2022 and 2023, and decreasing in 2024 and 2025. Over the longer term, after 2024, the number of new recipients is projected to stay fairly level through the remainder of the projection period, despite the growing size of the legal resident population. This reflects the effects of the same factors assumed to affect the level of projected applications, as discussed previously.
3. Terminations
Some persons receiving SSI payments in a year will stop receiving payments during the year because of death or the loss of SSI eligibility. SSA uses three primary tools to assess continuing eligibility: (1) a nonmedical redetermination, including limited issues; (2) a medical continuing disability review (CDR); and (3) medical redeterminations of SSI child recipients at age 18 using the adult initial disability criteria.8 In a non-medical redetermination, the recipient's non-medical factors of eligibility are reexamined, including income, resources, and living arrangements. In a medical CDR, the recipient’s medical condition is reevaluated to determine whether the recipient continues to meet the Act's definition of disability. Medical redeterminations of disabled children attaining age 18 evaluate whether such recipients qualify for payments using the adult medical eligibility criteria. The net reduction in the number of SSI recipients in current-payment status during a period is referred to as the number of SSI terminations for that period.
For the purpose of presentation in the following figures, and in the tables at the end of this section, “terminations” refers to the total of: (1) deaths while in current-payment status during the period; plus (2) the number of persons during the period moving out of payment status into suspended status less those returning to payment status from suspended status. This latter group is primarily comprised of individuals who have become ineligible for SSI payments due to excess income or financial resources, or no longer meeting the definition of disability based on medical improvement as set forth in the Act. For individuals who have concurrently filed an application for disability benefits under both the OASDI and SSI programs and are determined to meet the definition of disability, a portion are initially awarded an SSI payment and subsequently suspended for excess income. The primary reason for this suspension is the fact that not all such concurrent applicants have satisfied the 5-month waiting period for Social Security Disability Insurance benefits as of the first month of SSI eligibility. Individuals whose ongoing monthly OASDI benefit, in conjunction with their marital status, living arrangement, and all other income, renders them ineligible for SSI payments are only temporarily eligible for SSI payments. This group of concurrent applicants is currently about one-third of all SSI applicants. Changes in the portion of SSI applicants who also have the appropriate insured status for Social Security disability benefits can affect overall SSI terminations, as it has over the last ten years.
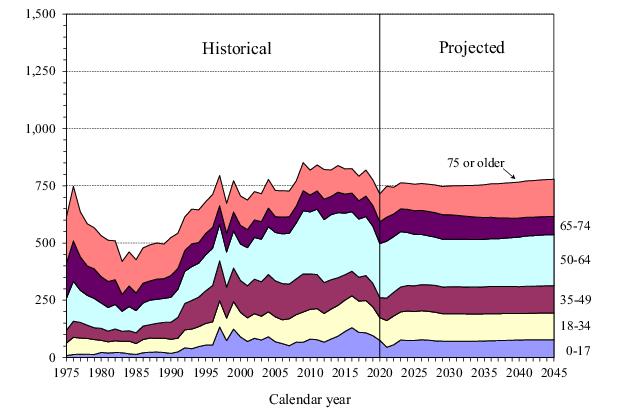
Figure IV.B3 presents historical and projected numbers of total terminations by calendar year.9 The total number of terminations of federally administered recipients in 2020 decreased from 2019, by about 8 per- cent. This change in total terminations is the net effect of differing changes by reason for termination. Terminations due to death increased by about 18 percent in 2020, while the number of terminations for all other reasons decreased by about 18 percent in 2020 from 2019 levels. These large changes in the number of terminations are a result of the COVID-19 pandemic. The number of terminations due to death increased largely because of an increase in mortality attributable to the COVID-19 pandemic. The number of terminations for reasons other than death decreased largely because, in March through August 2020, SSA suspended the processing of medical CDRs and non-medical redeterminations that could result in a reduction or cessation of payment.
Changes in terminations vary by age. For SSI children under age 18, terminations due to death decreased by 1 percent in 2020, while terminations for reasons other than death decreased by 22 percent from the level experienced in 2019. For SSI adults age 18 or older, terminations due to death increased by 18 percent, while terminations for all reasons other than death decreased by 18 percent.
Projected terminations over the next few years reflect the recent levels of increased Congressional appropriations to conduct program integrity activities during the last several years and the assumed continuation of these increased appropriation levels. These increased appropriations in the recent past allowed SSA to eliminate the backlog of such reviews by the end of fiscal year 2018. In addition to the increased appropriations, there is currently a backlog of medical reviews attributable to the temporary stoppage of processing medical CDRs. This backlog is assumed to be eliminated by 2023, and the working down of the backlog to achieve such elimination is expected to result in a temporary increase in terminations due to non-death over the 2021 through 2023 period. If increased appropriations persist into the future, SSA will be able to work down this backlog and perform these reviews on a timely basis in the long term. The recent increase in appropriations, relative to such appropriations over the 10-year period from 2005 to 2014, resulted in, and will result in higher levels of SSI terminations from medical cessation.
 
 
4. Recipients in Current Payment Status
 
Combining the number of new recipients of SSI payments during a year with the number of those already receiving payments at the end of the previous year, and subtracting the number of terminations during the year, yields the number of persons receiving federally administered SSI payments at the end of the year. Figure IV.B4 presents the number of individuals receiving Federal SSI payments, who comprise the great majority of federally administered recipients.10
The number of SSI recipients receiving Federal payments increased rapidly in the early 1990s mainly due to the growth in the numbers of disabled adults and children. The  growth  in  the  numbers  of  children  receiving  SSI  resulted  in large part  from  the  Supreme  Court decision in the case of Sullivan v. Zebley, 110 S. Ct. 885 (1990), which greatly expanded the criteria used for determining disability  for  children. The growth in   the numbers of  disabled adults  is  a more  complicated phenomenon. Extensive research conducted under contract to SSA and the Department of Health and Human Services suggested that this growth was the result of a combination of factors including: (1) demographic trends; (2) a downturn in the economy in the late 1980s and early 1990s; (3) long-term structural changes in the economy; and (4) changes in other support programs (in particular, the reduction or elimination of general assistance programs in certain States).11,12 The 1996 welfare reform legislation, the economic downturn in the early 2000s, the economic recession that began in 2007, and the strong economy and dramatic decline in applications during the period of 2011 through 2019, have contributed to the more recent changes in program participation.
 
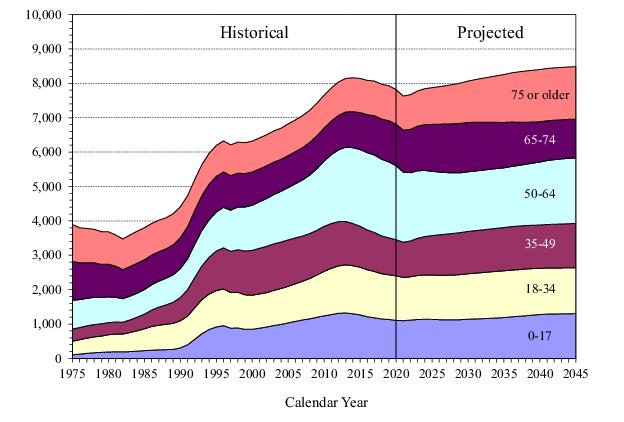
As figure IV.B4 illustrates, the implementation of Public Law 104-121 and Public Law 104-193 resulted in a decline in the Federal SSI recipient population from 1996 to 1997. From the end of 1997 through the end of 2000, the Federal SSI recipient population grew at an annual rate of less than 1 percent. From the end of 2000 to the end of 2008, the Federal SSI recipient population grew an average of 1.7 percent per year. From the end of 2008 to the end of 2012, the Federal SSI recipient population grew an average of 2.7 percent per year due largely to the 2007 economic recession and the slow recovery from that economic downturn. In 2013 and 2014, the Federal SSI recipient growth slowed, and beginning in 2015, the Federal SSI recipient population began to decrease. In 2020, recipients in current-payment status continued to decrease from 2019 levels by about 1.4 percent. These decreases in the last several years reflect the lower numbers of applications and new recipients and the increased number of medical CDRs conducted in recent years. In 2020 in particular, the pandemic caused a sharp decrease in the number of applications and new recipients as well as a sharp increase in terminations due to death, which was partially offset by the temporary suspension of medical CDRs and non-medical redeterminations. The number of recipients in current-payment status is projected to decrease substantially in 2021 as the pandemic continues, increase moderately in 2022, and then increase more substantially in 2023 and 2024 as delayed applications come in and decisions are made on those applications. Thereafter, as the proportion of the population applying for SSI payments is assumed to return to more nearly the expected long-term average, adjusted for the declining proportion of the population eligible for SSI payments as discussed in section 2, the numbers of Federal SSI recipients are projected to grow more slowly at an average rate of less than 1 percent per year for the remainder of the 25-year projection period.
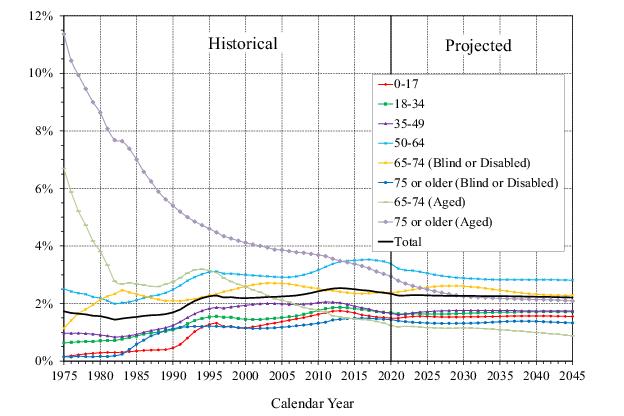
In order to place this projected growth in the context of overall population growth, figure IV.B5 presents Federal SSI prevalence rates by age group, defined as SSI recipients with Federal payments in current-payment status as percentages of the total Social Security area population for each age group.13
 
The prevalence rate for all Federal SSI recipients declined from 1975 through the early 1980s. In 1983, this percentage started increasing and continued to increase through 1996. The prevalence rate then declined in 1997, due to the implementation of Public Law 104-121 and Public Law 104-193, but leveled out over the next few years through 2004. It increased over the period 2005 through 2013, and experienced decreases in each of 2014 through 2020. The prevalence rate is projected to stay fairly level through 2026 and decline gradually throughout the remainder of the projection period.
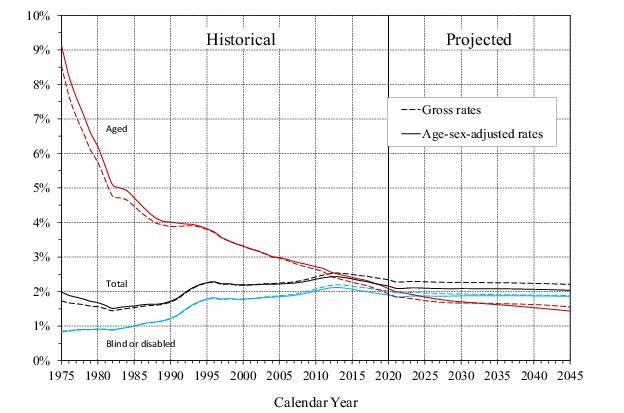
Figure IV.B6 presents prevalence rates for the two eligibility categories - blind and disabled and aged14 - as well as for the SSI program as a whole. It also shows these rates on an age-sex-adjusted basis, adjusted to the age-sex distribution of the Social Security area population for the year 2000. Adjusting these rates in this manner is useful when comparing rates over a long period of time because the age-sex-adjusted rates control for the effects that a changing age-sex distribution in the population can have on prevalence rates over time. That adjustment, however, does not account for the change over time of other factors that may affect the percentage of the Social Security area population that is SSI eligible.
Figure IV.B6 shows that the age-sex adjustment does not fundamentally change the overall pattern of the prevalence rates. The total SSI prevalence rate on an age-sex adjusted basis is higher before 2000 and lower after 2000 than the gross prevalence rate due to the changing age distribution of the population. The adjustment generally results in a more noticeable effect for the aged, especially in the early years of the SSI program, because the prevalence rate for ages 75 and older was much higher than for ages 65 to 74.
 
The prevalence rates for the eligibility categories of Federal SSI recipients follow significantly different growth patterns. The overall aged prevalence rate has declined steadily throughout the historical period. Gradual declines continue throughout the projection period. In contrast, except for decreases in the late 1990s due to the medical eligibility redeterminations and CDRs mandated by Public Law 104-193, the prevalence rate for blind or disabled children increased steadily through 2013, with the increase being relatively steep in the early 1990s. Since then, the prevalence rate for child recipients has decreased slightly each year from 2014 through 2020 which is primarily attributable to the (1) increased number of medical CDRs for these children over the past few years, and (2) the continuing drop in applications for SSI payments, including a substantial decline in 2020 due to the pandemic. The total blind or disabled prevalence rate (as a percentage of the total Social Security area population at all ages) remained fairly level until the early 1980s, when it started increasing and then continued to increase through 1996. The blind or disabled prevalence rate declined slightly in the late 1990s due to the effects of welfare reform legislation but resumed an upward trend in 2000. That upward trend continued through 2013, but experienced slight decreases in 2014 through 2020. The projected overall prevalence rate for blind or disabled recipients remains fairly level through 2025 and then gradually declines throughout the remainder of the projection period due to: (1) the population potentially eligible for SSI (i.e., the legal resident population) is projected to grow more slowly than the overall Social Security area population, (2) a smaller proportion of the population becoming new recipients than during the 2007 economic recession; (3) the changing age distribution of the population; and (4) the assumption that SSA will receive the resources authorized in the Bipartisan Budget Act of 2015 to process medical CDR and non-medical redetermination workloads, and those authorized resources will continue to be appropriated through the 25-year projection period.15
The total number of federally administered SSI recipients includes recipients only receiving a federally administered State supplement, as well as those receiving a Federal payment. Table IV.B8 presents historical and projected numbers of individuals who receive only a federally administered State supplement. Such recipients have countable income that exceeds the Federal benefit rate but which is lower than the combined amount of the Federal benefit rate and the State supplementary benefit level. These individuals must meet all other criteria required in order to be eligible for a Federal SSI payment. The vast majority of these individuals are concurrently beneficiaries of OASDI benefits. The historical and projected numbers do not include individuals eligible for a state supplement that is not administered by SSA.
Table IV.B9 displays the combined numbers of persons receiving either a Federal SSI payment or a federally administered State supplement. This is the total number of SSI recipients with a benefit administered by SSA, which follows largely the same patterns of growth as the number of recipients receiving a Federal payment.
 
Table IV.B1.—SSI Federally Administered Applications,a Calendar Years 1975‑2045
c

a
Based on data reported in the Integrated Workload Management System (formerly known as the District Office Workload Report).

b
“All” column estimated by the Office of Research, Evaluation, and Statistics using a 10-percent sample and published in the SSI Annual Statistical Report.

c
Fewer than 500.

Notes:
1. Components may not sum to totals because of rounding.
2. The historical split among age groups is estimated on a calendar year of age basis.
3. A complete table of historical and projected values is available at www.ssa.gov/OACT/ssir/SSI21.
 
Calendar year  a
c

a
Represents period in which first payment was made, not date of first eligibility for payments.

b
Historical totals estimated based on 1-percent sample data prior to 1993; 10-percent sample data for 1993-2006, and 100-percent data after 2006.

c
Fewer than 500.

Notes:
1. Components may not sum to totals because of rounding.
2. The historical split among age groups is estimated on a calendar year of age basis.
3. A complete table of historical and projected values is available at www.ssa.gov/OACT/ssir/SSI21.
 
 
Table IV.B3.—SSI Federally Administered Terminations Due to Deatha, Calendar Years 1975‑2045 
Totals  b
2019c

a
Terminations where the SSI recipient was deceased as of the first month of nonpayment of SSI payments.

b
Historical totals estimated based on 1-percent sample data prior to 1993; 10-percent sample data for 1993-2006, and 100-percent data after 2006.

c
Preliminary and subject to revision.

Notes: 
1. Components may not sum to totals because of rounding.
2. The historical split among age groups is estimated on a calendar year of age basis.
3. A complete table of historical and projected values is available at www.ssa.gov/OACT/ssir/SSI21.
 
Table IV.B4.—SSI Federally Administered Terminations Due to Reasons Other Than Death,a Calendar Years 1975‑2045 
Totals  b
2012c
2014d
2019e

a
Represents the number of persons during the period moving out of payment status into suspended status less those returning to payment status from suspended status.

b
Historical totals estimated based on 1-percent sample data prior to 1993; 10-percent sample data for 1993-2006, and 100-percent data after 2006.

c
Terminations for 2012 reflect the reclassification of about 23,000 Federal recipients from the aged to the blind or disabled category because the State of Massachusetts took over the administration of its State Supplementation program.

d
Terminations for 2014 reflect the decision of the State of New York to take over the administration of its State supplementation program.

e
Preliminary and subject to revision.

Notes: 
1. Components may not sum to totals because of rounding.
2. The historical split among age groups is estimated on a calendar year of age basis.
3. A complete table of historical and projected values is available at www.ssa.gov/OACT/ssir/SSI21.
 
Table IV.B5.—SSI Federally Administered Terminations for All Reasons,a Calendar Years 1975‑2045 
Totals  b
2012c
2014d
2019e

a
Annual figures represent the sum of: (1) terminations from current-payment status due to death during the year; and (2) the number of persons during the year moving out of payment status into suspended status less those returning to payment status from suspended status.

b
Historical totals estimated based on 1-percent sample data prior to 1993; 10-percent sample data for 1993-2006, and 100-percent data after 2006.

c
Terminations for 2012 reflect the reclassification of about 23,000 Federal recipients from the aged to the blind or disabled category because the State of Massachusetts took over the administration of its State Supplementation program.

d
Terminations for 2014 reflect the decision of the State of New York to take over the administration of its State supplementation program.

e
Preliminary and subject to revision.

Notes:
1. Components may not sum to totals because of rounding.
2. The historical split among age groups is estimated on a calendar year of age basis.
3. A complete table of historical and projected values is available at www.ssa.gov/OACT/ssir/SSI21.
 
2012 a

a
Number of recipients in 2012 reflects the reclassification of around 23,000 Federal recipients from the aged to the blind or disabled category because the State of Massachusetts took over administration of its State Supplementation program.
 

Notes: 
1. Components may not sum to totals because of rounding.
2. The historical split among age groups is estimated on a calendar year of age basis.
3. A complete table of historical and projected values is available at www.ssa.gov/OACT/ssir/SSI21.
 
 
Blind or
disabled a
Aged b
All c
2012d

a
Blind or disabled recipients as a percentage of the total Social Security area population.

b
Aged recipients as a percentage of the 65 or older Social Security area population.

c
Total recipients as a percentage of the total Social Security area population. Totals do not equal sums of components due to overlapping populations.

d
Prevalence rates in 2012 reflect the reclassification of around 23,000 Federal recipients from the aged to the blind or disabled category because the State of Massachusetts took over administration of its State Supplementation program.
 
Note: A complete table of historical and projected values is available at www.ssa.gov/OACT/ssir/SSI21.


2012a
2014b

a
Number of recipients in 2012 reflects the decision of the State of Massachusetts to take over the administration of its State supplementation program.

b
Number of recipients in 2014 reflects the decision of the State of New York to take over the administration of its State supplementation program.

Notes:
1. Components may not sum to totals because of rounding.
2. The historical split among age groups is estimated on a calendar year of age basis.
3. A complete table of historical and projected values is available at www.ssa.gov/OACT/ssir/SSI21.
 
2012a
2014b

a
Number of recipients in 2012 reflects the decision of the State of Massachusetts to take over the administration of its State supplementation program. This change in the administration of State supplementation payments resulted in a reclassification of around 23,000 Federal recipients from the aged to the blind or disabled category.

b
Number of recipients in 2014 reflects the decision of the State of New York to take over the administration of its State supplementation program.

Notes:
1. Components may not sum to totals because of rounding.
2. The historical split among age groups is estimated on a calendar year of age basis.
3. A complete table of historical and projected values is available at www.ssa.gov/OACT/ssir/SSI21

1
Recipient flows are projected on a calendar-year-age basis, with activity throughout a given year tabulated according to age at the end of the calendar year. Tabulations of recipients in current-payment status are provided as of December of each calendar year at which time calendar year of age and age last birthday are the same. However, the tabulations that reflect activity throughout the calendar year are summarized according to calendar year of age, and thus they will not correspond precisely to tabulations summarized according to age last birthday. For example, applications for the 0-17 age group for a given calendar year include applications only for those individuals who are under 18 at the end of the calendar year.

2
Individuals may apply for SSI payments based on age as of the day preceding their 65th birthday.

3
See table IV.B1 for the same information in tabular form.

4
Applications for SSI at SSA’s field offices are presented on an operating month basis rather than a true calendar month basis. An operating month ends on the last Friday of the calendar month. Each quarter of a normal operating year contains 13 weeks and the calendar year contains 52 weeks. Every 5 or 6 years, the calendar year contains 53 weeks rather than the normal 52 weeks.

5
See section V.C for data on recent experience in the disability decision process.

6
SSA’s Program Operations Manual System (POMS) describes this policy in detail, including exceptions to this policy. See POMS DI 51501.001 available at https://secure.ssa.gov/poms.nsf/lnx/0451501001.

7
See table IV.B2 for the same information in tabular form. Individuals are counted as of the first month that they move into SSI payment status on a given application. For this reason, these individuals are referred to as “new recipients” rather than “awards”. In addition, these counts differ slightly from other similar totals identified as “awards” and published by the Office of Research, Evaluation, and Statistics (ORES) in the Annual Statistical Supplement to the Social Security Bulletin. The ORES totals are similar in concept to those used in this report, but differ slightly due to the timing of the action being tabulated. For example, ORES does not count a disability benefit as being awarded until the disability decision is made. In contrast, under the procedures used in this report, individuals first coming on the SSI rolls through a finding of presumptive disability would be counted as a “new recipient” in the first month of presumptive disability payment.

8
Some historical details on non-medical redeterminations and the results of medical continuing disability reviews and medical age 18 redeterminations are presented in section V.D. Section V.E presents information on certain incentive programs intended to encourage disabled SSI recipients to return to work.

9
In the tables, the numbers of total terminations are separated into the two separate categories: (1) terminations due to death (table IV.B3); and (2) net suspensions of payments for all other reasons (table IV.B4). The total number of terminations is also shown in table IV.B5, which is the same information presented in figure IV.B3 in tabular form.

10
See table IV.B6 for the same information in tabular form.

11
Stapleton, David, Burt Barnow, Kevin Coleman, Kimberly Dietrich, Jeff Furman, and Gilbert Lo. Labor Market Conditions, Socioeconomic Factors, and the Growth of Applications and Awards for SSDI and SSI Disability Benefits, final report and appendix prepared under contract to the Office of the Assistant Secretary for Planning and Evaluation, Department of Health and Human Services and the Social Security Administration, May 23, 1995.

12
Stapleton, David, Gina Livermore, Andrea Zeuschner, Jeffery Furman, Kimberly Dietrich, and Gilbert Lo. Impairment Trends in the Growth of Applications and Awards for SSA Disability Benefits, final report and appendix prepared under contract to the Office of the Assistant Secretary for Planning and Evaluation, Department of Health and Human Services and the Social Security Administration, May 24, 1995.

13
See table IV.B7 for the same information in tabular form.

14
The ratios for the separate recipient categories—total blind or disabled and total aged—are computed as percentages of differing base populations, the total Social Security area population and the 65 and older Social Security area population, respectively.

15
Public Law 114-74 enacted November 2, 2015.


Table of Contents Previous Next Tables Figures
SSA Home | Privacy Policy | Website Policies & Other Important Information | Site Map | Actuarial Publications October 26, 2021