This section presents historical data and projections of the numbers of (1) persons applying for SSI payments; (2) new recipients of SSI payments as a result of an application; (3) terminations from SSI payment status; and, (4) recipients of federally administered SSI payments. These historical data and projections are presented by category and age group.
1 All of the corresponding tables are located at the end of this section.
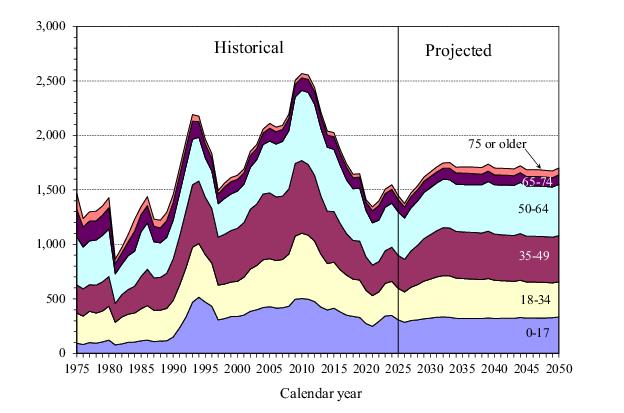
Figure IV.B1 presents historical and projected numbers of persons applying for SSI payments at SSA field offices, including applications taken by telephone and online, by calendar year.
3 The level of applications generally decreased from 2010 through 2019 as the economy recovered from the recession of 2007-09. The number of applications decreased sharply in 2020 and remained low in 2021, due to a number of COVID-19 pandemic-related effects. From 2021 to 2024, the number of applications increased, not quite reaching pre-pandemic levels, before decreasing in 2025. In 2026, the number of applications is projected to decrease, before increasing from 2026 to 2033, reaching levels more consistent with longer-term expected experience. The number of applications is projected to be 1.7 million in 2034, and then remain at roughly this level thereafter.
When someone files an application for SSI payments, SSA evaluates whether the individual meets the eligibility criteria described in section III.C. Figure
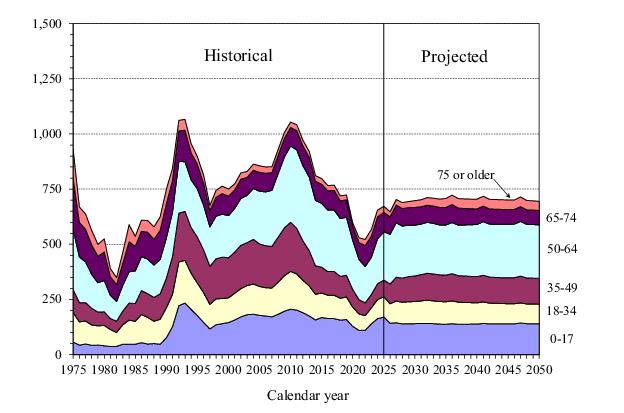
IV.B2 presents historical and projected numbers of persons who start receiving SSI payments as a result of this evaluation.
4 The numbers of new recipients declined generally from 2010 to 2018, leveled off in 2019, decreased sharply in 2020 and 2021, and remained low in 2022, following the pattern of applications. The number of new recipients increased substantially from 2022 through 2025. The number of new recipients is projected to decrease in 2026 and increase substantially in 2027 as the time it takes the agency to adjudicate applications is assumed to continue the decrease that began in late 2024. After 2027, the number of new recipients is projected to stay fairly level through the remainder of the projection period, despite the growing size of the U.S. population potentially eligible for SSI based on citizenship and residency requirements. This reflects the effects of the same factors assumed to affect the level of projected applications, as discussed previously.
Some persons receiving SSI payments in a year will stop receiving payments during the year because of death or the loss of SSI eligibility. SSA uses three primary tools to assess continuing eligibility: (1) non-medical redeterminations, including limited issues; (2) medical continuing disability reviews (CDR); and (3) medical redeterminations of SSI child recipients at age 18 using the adult initial disability criteria.
5 In a non-medical redetermination, the recipient’s non-medical factors of eligibility are reexamined, including income, resources, and living arrangements. In a medical CDR, the recipient’s medical condition is reevaluated to determine whether the recipient continues to meet the Act’s definition of disability. Medical redeterminations of disabled children attaining age 18 evaluate whether such recipients qualify for payments using the adult medical eligibility criteria. The net reduction in the number of SSI recipients in
current-payment status during a period is referred to as the number of SSI terminations for that period.
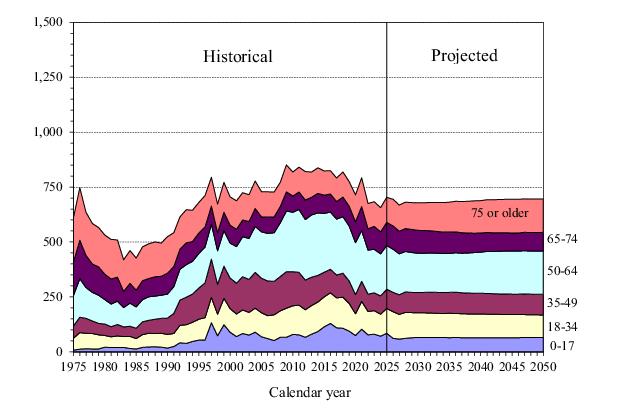
Figure IV.B3 presents historical and projected numbers of total terminations by calendar year.
6 The total number of terminations of federally administered recipients in 2025 increased from 2024, by about 7 percent. The number of terminations due to death increased by about 1 percent while the net number of terminations for all other reasons increased by about 10 percent in 2025 compared to 2024.
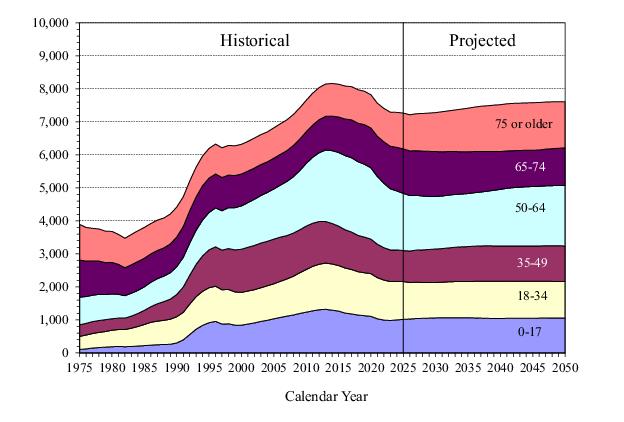
The number of SSI recipients receiving Federal payments increased rapidly in the early 1990s mainly due to the growth in the numbers of disabled adults and children. The growth in the numbers of children receiving SSI resulted in large part from the Supreme Court decision in the case of Sullivan v. Zebley, 110 S. Ct. 885 (1990), which greatly expanded the criteria used for determining disability for children. The growth in the numbers of disabled adults is a more complicated phenomenon. Extensive research conducted under contract to SSA and the Department of Health and Human Services suggested that this growth was the result of a combination of factors including: (1) demographic trends; (2) a downturn in the economy in the late 1980s and early 1990s; (3) long-term structural changes in the economy; and (4) changes in other support programs (in particular, the reduction or elimination of general assistance programs in certain States).
8 9 The 1996 welfare reform legislation, the economic downturn in the early 2000s, the economic recession that began in 2007, the subsequent economic recovery, and the COVID-19 pandemic beginning in 2020, have contributed to the more recent changes in program participation.
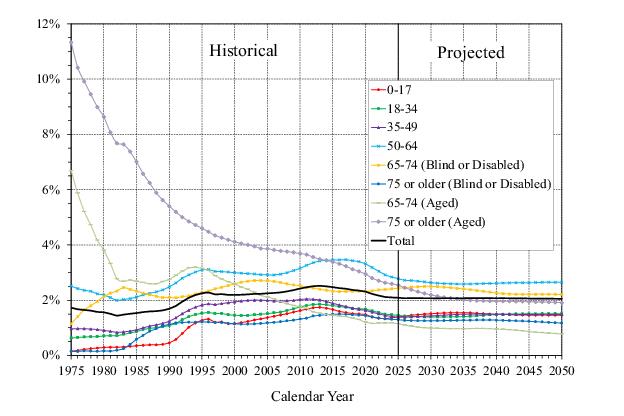
In order to place this projected growth in the context of overall population growth, figure IV.B5 presents Federal SSI prevalence rates by age group, defined as SSI recipients with Federal payments in current-payment status as percentages of the total U.S. population for each age group.
10
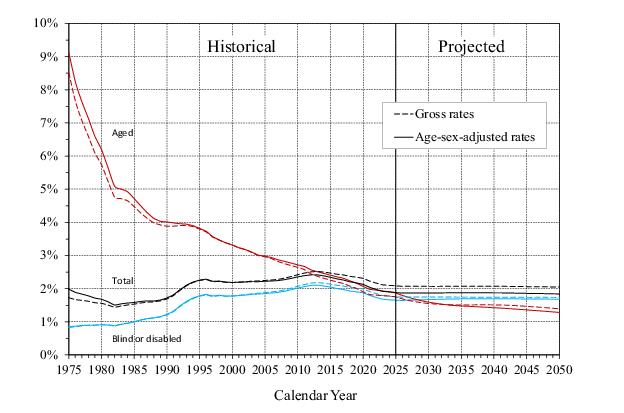
Figure IV.B6 presents prevalence rates for the two eligibility categories -
blind and disabled and
aged11 - as well as for the SSI program as a whole. It also shows these rates on an age-sex-adjusted basis, adjusted to the age-sex distribution of the Social Security area population for the year 2000. Adjusting these rates in this manner is useful when comparing rates over a long period of time because the age-sex-adjusted rates control for the effects that a changing age-sex distribution in the population can have on prevalence rates over time. That adjustment, however, does not account for the change over time of other factors that may affect the percentage of the Social Security area population that is SSI eligible.
Figure IV.B6 shows that the age-sex adjustment does not fundamentally change the overall pattern of the prevalence rates. The total SSI prevalence rate on an age-sex adjusted basis is higher before 2000 and lower after 2000 than the gross prevalence rate due to the changing age distribution of the population. The adjustment generally results in a more noticeable effect for the aged, especially in the early years of the SSI program, because the prevalence rate for ages 75 and older was much higher than for ages 65 to 74.
The total number of federally administered SSI recipients includes recipients only receiving a federally administered State supplement, as well as those receiving a Federal payment. Table IV.B8 presents historical and projected numbers of individuals who receive only a federally administered State supplement. Such recipients have countable income that exceeds the Federal benefit rate but which is lower than the combined amount of the Federal benefit rate and the State supplementary benefit level. These individuals must meet all other criteria required in order to be eligible for a Federal SSI payment. The vast majority of these individuals are concurrently beneficiaries of OASDI benefits. The historical and projected numbers do not include individuals eligible for only a state supplement that is not administered by SSA.
Table IV.B9 displays the combined numbers of persons receiving either a Federal SSI payment or a federally administered State supplement. This is the total number of SSI recipients with a benefit administered by SSA, which follows largely the same patterns of growth as the number of recipients receiving a Federal payment.