2016 OASDI Trustees Report

skip to main content
Table of Contents Previous Next Tables Figures Index

IV. ACTUARIAL ESTIMATES
This chapter presents actuarial estimates of the future financial condition of the Social Security program. These estimates show the income, cost, and asset reserves or unfunded obligation of the OASI and DI Trust Funds: (1) in dollars over the 10‑year short-range period; and (2) as a percentage of taxable payroll, as a percentage of gross domestic product, and in present-value dollars over the 75‑year long-range period. In addition, the chapter discusses a variety of measures of the adequacy of current program financing. This report distinguishes between: (1) the cost (obligations) of the program, which includes all future benefits scheduled under current law; and (2) expenditures (disbursements), which include actual payments for the past plus only the portion of projected program cost that would be payable with the financing provisions in current law.
This chapter presents the estimates and measures of trust fund financial adequacy for the short-range period (2016 through 2025) first, followed by estimates and measures of actuarial status for the long-range period (2016 through 2090). Summary measures are also provided for trust fund status over the infinite horizon. As described in chapter II of this report, these estimates depend upon a broad set of demographic, economic, and programmatic factors. This chapter presents estimates under three sets of assumptions to show a wide range of possible outcomes, because assumptions related to these factors are subject to uncertainty. The intermediate set of assumptions, designated as alternative II, reflects the Trustees’ best estimate of future experience; the low-cost alternative I is significantly more optimistic and the high-cost alternative III is significantly more pessimistic for the trust funds’ future financial outlook. The tables of this report show the intermediate estimates first, followed by the low-cost and high-cost estimates. Chapter V describes these three sets of assumptions, along with the actuarial methods used to produce the estimates. Appendix D and appendix E present two additional methods to illustrate the uncertainty of the projections. Appendix D presents sensitivity analyses of the effects of variation in individual factors and appendix E presents probability distributions generated by a stochastic model.
A. SHORT-RANGE ESTIMATES
The Trustees consider the trust funds to be solvent at any point in time if the funds can pay scheduled benefits in full on a timely basis. A standard measure for assessing solvency is the “trust fund ratio,” which is the reserves in a fund at the beginning of a year (not including advance tax transfers) expressed as a percentage of the cost during the year. A positive trust fund ratio indicates that the trust fund was solvent at the end of the prior year. The trust fund ratio represents the proportion of a year’s cost which the reserves available at the beginning of that year can cover. The Trustees assume that a trust fund ratio of 100 percent of annual program cost provides a reasonable “contingency reserve.” Maintaining a reasonable contingency reserve is important because the trust funds do not have borrowing authority. After reserves are depleted, the trust funds would be unable to pay benefits in full on a timely basis if annual revenue were less than annual cost. Unexpected events, such as severe economic recessions, can quickly diminish reserves. In such cases, a reasonable contingency reserve can maintain the ability to pay scheduled benefits while giving lawmakers time to address possible changes to the program.
The test of short-range financial adequacy applies to the OASI and DI Trust Funds individually and combined on a hypothetical basis.1 If the estimated trust fund ratio is at least 100 percent at the beginning of the projection period, the test requires that it remain at or above 100 percent throughout the 10-year period. If the ratio is initially less than 100 percent, then it must reach at least 100 percent within 5 years (without reserve depletion at any time during this period) and then remain at or above 100 percent throughout the remainder of the 10-year period. This test is applied using the estimates based on the intermediate assumptions. If either trust fund fails this test, then program solvency in the next 10 years is in question, and lawmakers should take prompt action to improve short-range financial adequacy.
1. Operations of the OASI Trust Fund
This subsection presents estimates, based on the assumptions described in chapter V, of the operations and financial status of the OASI Trust Fund for the period 2016 through 2025. These estimates assume that there are no further changes in the statutory provisions and regulations under which the OASDI program currently operates beyond the changes since last year’s report indicated in section III.B.2
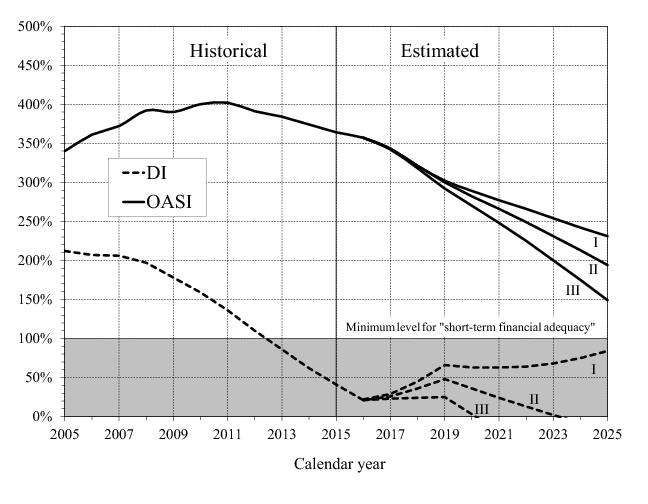
Estimates of the OASI Trust Fund operations presented in Table IV.A1 indicate that the asset reserves of the OASI Trust Fund increase through 2021 under the intermediate assumptions, increase throughout the next 10 years under the low-cost assumptions, and decrease throughout the next 10 years under the high-cost assumptions. However, trust fund ratios decline throughout the 10-year period under all three sets of assumptions. Based on the intermediate assumptions, the reserves of the OASI Trust Fund continue to exceed 100 percent of annual cost by a large amount through the end of 2025. Consequently, the OASI Trust Fund satisfies the test of short-range financial adequacy by a wide margin. Table IV.A1 also indicates that the OASI Trust Fund would satisfy the short-range test even under the high-cost assumptions. See figure IV.A1 for an illustration of these results.
Table IV.A1.—Operations of the OASI Trust Fund, Calendar Years 2011-2025 a 
Costb
GF
reim-
burse-
mentsc
Taxa-
tion of
bene-fitsd
Trust
fund
ratio e

a
Appendix A presents a detailed description of the components of income and cost, along with complete historical values.

b
Amounts for 2015 and 2016 are adjusted to include in 2016 operations those benefit payments regularly scheduled in the law to be paid on January 3, 2016, which were actually paid on December 31, 2015 as required by the statutory provision for early benefit payments when the normal delivery date is on a weekend or holiday. Such shifts in payments across calendar years have occurred in the past and will occur periodically in the future whenever January 3rd falls on a Sunday. In order to provide a consistent perspective on trust fund operations over time, all trust fund operations in each year reflect the 12 months of benefits that are regularly scheduled for payment in that year.

c
Includes reimbursements from the General Fund of the Treasury to the OASI Trust Fund for: (1) the cost of noncontributory wage credits for military service before 1957; (2) the cost of benefits to certain uninsured persons who attained age 72 before 1968; (3) the cost of payroll tax credits provided to employees in 1984 and self-employed persons in 1984-89 by Public Law 98-21; (4) the cost in 2009-17 of excluding certain self-employment earnings from SECA taxes under Public Law 110-246; and (5) payroll tax revenue forgone under the provisions of Public Laws 111-147, 111-312, 112-78, and 112-96.

d
Revenue from taxation of benefits is the amount that would be assessed on benefit amounts scheduled in the law.

e
The “Trust fund ratio” column represents reserves at the beginning of a year (which are identical to reserves at the end of the prior year shown in the “Amount at end of year” column) as a percentage of cost for the year.

7
Between -$50 million and $50 million.
Note: Totals do not necessarily equal the sums of rounded components.

After slightly decreasing in 2016 due to the temporary tax rate reallocation from OASI to DI, the estimated income shown in table IV.A1 increases annually under each set of assumptions throughout the short-range projection period. The estimated increases in income reflect increases in estimated OASDI taxable earnings and growth in interest earnings on the invested reserves in the trust fund, as well as a return to pre-reallocation tax rates in 2019. Employment increases in every year through 2025 for all three alternatives: the number of persons with taxable earnings increases on the basis of alternatives I, II, and III from 169 million during calendar year 2015 to about 189 million, 185 million, and 180 million, respectively, in 2025. The total annual amount of taxable earnings increases in every year through 2025 for each alternative. Total earnings increase from $6,395 billion in 2015 to $12,228 billion, $10,569 billion, and $9,080 billion in 2025, on the basis of alternatives I, II, and III, respectively. These increases in taxable earnings are due primarily to: (1) projected increases in employment levels as the working age population increases; (2) trend increases in average earnings in covered employment (reflecting both real growth and price inflation); (3) increases in the contribution and benefit base under the automatic-adjustment provisions; and (4) growth in employment and average earnings, temporarily higher than trend, as the economy continues to recover from the severe economic downturn that began in late 2007.
Interest earnings contribute to the overall projected increase in trust fund income during this period. In the first few years of the projection period, annual interest earnings decline slightly under all three sets of assumptions due to historically low interest rates assumed for newly-issued bonds. Thereafter, interest income increases under the intermediate and low-cost assumptions due to the net effects of changes in reserve levels and the patterns of projected interest rates. Under the high-cost assumptions, declining reserves cause interest income to continue to decrease throughout the short-range period. Although interest earnings generally increase over the short-range period, interest declines as a share of total OASI Trust Fund income under the intermediate assumptions. By 2025, OASI interest income under the intermediate assumptions is about 7 percent of total trust fund income, as compared to 11 percent in 2015.
Rising OASI cost during 2016 through 2025 reflects automatic benefit increases as well as the upward trend in the number of beneficiaries and in the average monthly earnings underlying benefits. The growth in the number of beneficiaries since 2009 and the expected future growth result both from the increase in the aged population and from the increase in the proportion of the population that is eligible for benefits.
The Treasury invests OASI income in financial securities, generally special public-debt obligations of the U.S. Government. The revenue used to make these purchases flows to the General Fund of the Treasury. The trust fund earns interest on these securities, and the Treasury invests maturing securities in new securities if not immediately needed to pay program costs. Program expenditures require the redemption of trust fund securities, generally prior to maturity, to cover the payments made by the General Fund of the Treasury on behalf of the trust fund.3
2. Operations of the DI Trust Fund
Table IV.A2 shows the estimated operations and financial status of the DI Trust Fund during calendar years 2016 through 2025 under the three sets of assumptions, together with values for actual experience during 2011 through 2015. Non-interest income for DI is much higher in 2016 through 2018 than in 2015, due to the temporary payroll tax rate reallocation from OASI to DI. As a result, DI Trust Fund reserves increase through 2018 under each alternative. After returning to the ultimate allocation of tax rates in 2019, non-interest income is again less than DI cost except under the low-cost alternative. Non-interest income increases steadily thereafter under each alternative, due to most of the same factors described previously for the OASI Trust Fund.  DI cost grows steadily throughout the period under each alternative. Under the intermediate assumptions, reserves decline after 2018 until their projected depletion in the third quarter of 2023. Under the high-cost assumptions, DI reserves decline until depletion in the first quarter of 2020. Under the low-cost assumptions, after decreasing slightly in 2019, reserves increase through the remainder of the short-range period.
Taxa-
tion of
bene-fitsd

a
The DI Trust Fund becomes depleted in the third quarter of 2023 and the first quarter of 2020 under the intermediate and high-cost assumptions, respectively. For any period during which reserves would be depleted, scheduled benefits could not be paid in full on a timely basis, income from taxing benefits would be less than would apply to scheduled benefits, and interest on trust fund reserves would be negligible. Appendix A presents a detailed description of the components of income and cost, along with complete historical values.

b
Amounts for 2015 and 2016 are adjusted to include in 2016 operations those benefit payments regularly scheduled in the law to be paid on January 3, 2016, which were actually paid on December 31, 2015 as required by the statutory provision for early benefit payments when the normal delivery date is on a weekend or holiday. Such shifts in payments across calendar years have occurred in the past and will occur periodically in the future whenever January 3rd falls on a Sunday. In order to provide a consistent perspective on trust fund operations over time, all trust fund operations in each year reflect the 12 months of benefits that are regularly scheduled for payment in that year.

c
Includes reimbursements from the General Fund of the Treasury to the DI Trust Fund for: (1) the cost of noncontributory wage credits for military service before 1957; (2) the cost of payroll tax credits provided to employees in 1984 and self-employed persons in 1984-89 by Public Law 98-21; (3) the cost in 2009-17 of excluding certain self-employment earnings from SECA taxes under Public Law 110-246; and (4) payroll tax revenue forgone under the provisions of Public Laws 111-147, 111-312, 112-78, and 112-96.

d
Revenue from taxation of benefits is the amount that would be assessed on benefit amounts scheduled in the law.

e
The “Trust fund ratio” column represents reserves at the beginning of a year (which are identical to reserves at the end of the prior year shown in the “Amount at end of year” column) as a percentage of cost for the year.

f
Between -$50 million and $50 million.

g
While the fund is depleted, values under current law would reflect permissible expenditures only, which are inconsistent with the cost of scheduled benefits shown in this table.
Note: Totals do not necessarily equal the sums of rounded components.

 
In the future, DI cost increases in part due to increases in average benefit levels resulting from: (1) automatic benefit increases and (2) projected increases in the amounts of average monthly earnings on which benefits are based. The number of DI beneficiaries in current-payment status increases but at a much slower rate during the short-range projection period than over the past 20 years, largely due to long-anticipated demographic trends and expected economic conditions. In addition, certain provisions in the Bipartisan Budget Act of 2015 are expected to reduce the number of future new DI beneficiaries by slightly less than 1 percent.
At the beginning of calendar year 2015, the reserves of the DI Trust Fund represented 41 percent of annual cost. During 2015, DI cost exceeded income, and the trust fund ratio for the beginning of 2016 decreased to about 21 percent. Under the intermediate assumptions, the reallocation of the payroll tax rate from OASI to DI causes DI total income to exceed cost through 2018, and reserves to increase to a level of 48 percent of annual cost at the beginning of 2019. Thereafter, cost exceeds total income throughout the short-range projection period. The projected cost in excess of income results in the estimated depletion of the DI Trust Fund reserves in the third quarter of 2023.
Because the reserves of the DI Trust Fund at the beginning of 2016 were less than the estimated annual cost for 2016, and they are projected to remain below annual cost throughout the short-range period, the DI Trust Fund fails the Trustees’ test of short-range financial adequacy under all three alternatives.
3. Operations of the Combined OASI and DI Trust Funds
Table IV.A3 shows the estimated operations and status of the combined OASI and DI Trust Funds for calendar years 2016 through 2025 under the three alternatives, together with actual experience in 2011 through 2015. Income and cost for the OASI Trust Fund represent over 80 percent of the corresponding amounts for the combined OASI and DI Trust Funds. Therefore, based on the relative strength of the OASI Trust Fund over the next 10 years, the combined OASI and DI Trust Funds would have sufficient financial resources to pay all scheduled benefits through the end of the short-range period, although it is important to note that under current law, one trust fund cannot share financial resources with another trust fund. In addition, the combined OASI and DI Trust Funds would satisfy the test of short-range financial adequacy under the intermediate and low-cost assumptions. However, under the high-cost assumptions, reserves are projected to drop to about 86 percent of annual cost by the end of 2025, and hence the combined funds would not satisfy the test of short-range financial adequacy.
Table IV.A3.—Operations of the Combined OASI and DI Trust Funds,
Calendar Years 2011-2025a 
GF
reim-
burse-
mentsc
Taxa-
tion
of bene-fitsd
Trust
fund
ratio e

a
Appendix A presents a detailed description of the components of income and cost, along with complete historical values.

b
Amounts for 2015 and 2016 are adjusted to include in 2016 operations those benefit payments regularly scheduled in the law to be paid on January 3, 2016, which were actually paid on December 31, 2015 as required by the statutory provision for early benefit payments when the normal delivery date is on a weekend or holiday. Such shifts in payments across calendar years have occurred in the past and will occur periodically in the future whenever January 3rd falls on a Sunday. In order to provide a consistent perspective on trust fund operations over time, all trust fund operations in each year reflect the 12 months of benefits that are regularly scheduled for payment in that year.

c
Includes reimbursements from the General Fund of the Treasury to the OASI and DI Trust Funds for: (1) the cost of noncontributory wage credits for military service before 1957; (2) the cost of benefits to certain uninsured persons who attained age 72 before 1968; (3) the cost of payroll tax credits provided to employees in 1984 and self-employed persons in 1984-89 by Public Law 98-21; (4) the cost in 2009-17 of excluding certain self-employment earnings from SECA taxes under Public Law 110-246; and (5) payroll tax revenue forgone under the provisions of Public Laws 111-147, 111-312, 112-78, and 112-96.

d
Revenue from taxation of benefits is the amount that would be assessed on benefit amounts scheduled in the law.

e
The “Trust fund ratio” column represents reserves at the beginning of a year (which are identical to reserves at the end of the prior year shown in the “Amount at end of year” column) as a percentage of cost for the year.

f
Between -$50 million and $50 million.
Note: Totals do not necessarily equal the sums of rounded components.

 
4. Factors Underlying Changes in 10-Year Trust Fund Ratio Estimates From the 2015 Report
Table IV.A4 presents an analysis of the factors underlying the changes in the intermediate estimates over the short-range projection period for the OASI, DI, and the combined funds from last year’s report to this report.
In the 2015 report under intermediate assumptions, the trust fund ratio for OASI reached 216 percent at the beginning of 2024 — the tenth projection year for that report. The change in the short-range valuation period alone, from 2015 through 2024 to 2016 through 2025, lowered the estimated trust fund ratio for the tenth year by 17 percentage points, to 199 percent. All other changes to reflect modifications in law and regulations since last year’s report, the most recent data, adjustments to the assumptions for future years, and changes in projection methods combined for a net decrease in the ratio for the tenth projection year of 5 percentage points. Therefore, the total change for this report is a reduction of 22 percentage points to 194 percent.
The Bipartisan Budget Act of 2015 is projected to decrease the tenth year OASI trust fund ratio by 12 percentage points, primarily due to the temporary reallocation of payroll tax rates from OASI to DI for 2016 through 2018. Changes in demographic assumptions over the short-range period increased the projected tenth-year trust fund ratio for OASI by 4 percentage points. Changes in economic data and assumptions, primarily the combined effects of lower cost-of-living adjustments, lower interest rates, and lower payroll tax revenues over the ten year period, caused a net reduction in the OASI trust fund ratio of 3 percentage points by the beginning of 2025. Incorporating recent programmatic data resulted in an increase of 10 percentage points in the tenth year OASI trust fund ratio. This increase was primarily due to recent data showing that retired workers have been starting benefits at later ages, which in turn led to lower beneficiary counts, somewhat offset by higher average benefit amounts, throughout the short-range period. Finally, an improvement in the short-range methodology for projecting average benefits for newly awarded retired workers decreased the tenth year trust fund ratio by 4 percentage points.
Table IV.A4 also shows corresponding estimates of the factors underlying the changes in the financial projections for the DI Trust Fund and for the combined OASI and DI Trust Funds. The ratios at the beginning of 2024 for the DI Trust Fund and the combined OASI and DI Trust Funds in last year’s report, as well as the corresponding ratios for the beginning of 2025 in this year’s report, are hypothetical because the Trustees project that the DI Trust Fund reserves will be depleted prior to the end of the short-range projection period. The 77-percentage-point increase in the DI trust fund ratio is the net effect of increases and decreases from the factors described in the prior paragraph for the OASI Trust Fund, the largest of which was the increase caused by the Bipartisan Budget Act of 2015. For the DI Trust Fund, the effect of this law was an increase of about 81 percentage points, which is a combination of a 79‑percentage-point increase due to the temporary tax rate reallocation and an increase of about 2 percentage points caused by other provisions affecting DI benefits. For the combined OASI and DI Trust Funds, the payroll tax rate reallocation has no net effect; the remaining change due to other provisions is an increase of slightly less than 0.5 percentage point in the trust fund ratio.
Trust fund ratio shown in last year’s report for calendar year 2024a

1
Figures for DI, and OASI and DI combined, are hypothetical because the DI Trust Fund reserves are depleted before the beginning of the tenth year under the assumptions of each report. The magnitudes of the negative values for DI represent the ratios of the unfunded obligation at the beginning of the tenth year to cost for that year.

2
Between -0.5 and 0.5 percent.

Note: Totals do not necessarily equal the sums of rounded components.

1
The OASI and DI Trust Funds are distinct legal entities which operate independently. To illustrate the actuarial status of the program as a whole, the fund operations are often combined on a hypothetical basis.

2
The estimates shown in this subsection reflect 12 months of scheduled benefits in each year of the short-range projection period. In practice, the actual payment dates have at times shifted over calendar year boundaries as a result of the statutory requirement for early delivery of benefit payments when the normal check delivery date is a Saturday, Sunday, or legal public holiday.

3
For an explanation of the interrelationship between the Medicare and Social Security trust funds and the overall Federal budget, see appendix F of the 2016 Medicare Trustees Report.


Table of Contents Previous Next Tables Figures Index
SSA Home | Privacy Policy | Website Policies & Other Important Information | Site Map | Actuarial Publications June 22, 2016