2018 OASDI Trustees Report

skip to main content
Table of Contents Previous Next Tables Figures Index

 
B. LONG-RANGE ESTIMATES
The Trustees use three types of financial measures to assess the actuarial status of the Social Security trust funds under the financing approach specified in current law: (1) annual cash-flow measures, including income rates, cost rates, and balances; (2)  trust fund ratios; and (3) summary measures such as actuarial balances and unfunded obligations.
The difference between the annual income rate and annual cost rate, both expressed as percentages of taxable payroll, is the annual balance. The level and trend of the annual balances at the end of the 75-year projection period are factors that the Trustees use to assess the financial condition of the program.
The trust fund ratio for a year is the proportion of the year’s projected cost that could be paid with funds available at the beginning of the year. Critical factors considered by the Trustees in assessing actuarial status include: (1) the level and year of maximum trust fund ratio, (2) the year of depletion of the fund reserves and the percent of scheduled benefits that is still payable after reserves are depleted, and (3) the stability of the trust fund ratio at the end of the long-range period.
Solvency at any point in time requires that sufficient financial resources are available to pay all scheduled benefits at that time. Solvency is generally indicated by a positive trust fund ratio. “Sustainable solvency” for the financing of the program under a specified set of assumptions has been achieved when the projected trust fund ratio is positive throughout the 75‑year projection period and is either stable or rising at the end of the period.
Summarized measures for any period indicate whether projected income is sufficient, on average, for the whole period. Summarized measures can only indicate the solvency status of a fund for the end of the period. The Trustees summarize the total income and cost over valuation periods that extend through 75 years and over the infinite horizon.1 This section presents two summarized measures: the actuarial balance and the open group unfunded obligation. The actuarial balance indicates the size of any surplus or shortfall as a percentage of the taxable payroll over the period. The open group unfunded obligation indicates the size of any shortfall in present-value dollars.
This section also includes additional information that the Trustees use to assess the financial status of the Social Security program, including: (1) a comparison of the number of beneficiaries to the number of covered workers, (2) the test of long-range close actuarial balance, and (3) the reasons for the change in the actuarial balance from the last report.
1. Annual Income Rates, Cost Rates, and Balances
The concepts of income rate and cost rate, expressed as percentages of taxable payroll, are important in the consideration of the long-range actuarial status of the trust funds. The annual income rate is the ratio of all non-interest income to the OASDI taxable payroll for the year. Non-interest income includes payroll taxes, taxes on scheduled benefits, and any General Fund transfers or reimbursements. The OASDI taxable payroll consists of the total earnings subject to OASDI taxes with some relatively small adjustments.2 The annual cost rate is the ratio of the cost of the program to the taxable payroll for the year. The cost includes scheduled benefits, administrative expenses, net interchange with the Railroad Retirement program, and payments for vocational rehabilitation services for disabled beneficiaries. For any year, the income rate minus the cost rate is the “balance” for the year.
Table IV.B1 presents a comparison of the estimated annual income rates and cost rates by trust fund and alternative. Table IV.B2 shows the separate components of the annual income rates.
Under the intermediate assumptions, the Trustees project that the OASI income rate will increase from 10.30 percent of payroll for 2018 to 11.03 percent of payroll for 2019. The projected OASI income rate is low for 2018 because of the payroll tax rate reallocation of 0.57 percentage point from OASI to DI for 2016 through 2018, as enacted in the Bipartisan Budget Act of 2015. After returning to the pre-reallocation level for 2019, the income rate generally rises at a very gradual rate to 11.52 percent of taxable payroll for 2092. Income from taxation of benefits causes a gradual increase in the OASI income rate for two main reasons: (1) total scheduled benefits are rising faster than payroll; and (2) the benefit-taxation threshold amounts are fixed (not indexed), and therefore an increasing share of total benefits will be subject to tax as incomes and benefits rise. There is also a one-time upward shift in the income rate, from 11.19 percent of payroll for 2025 to 11.31 percent of payroll for 2026, because of increased taxation of benefits due to expiration of the personal income tax provisions in Public Law 115-97, the Tax Cuts and Jobs Act.
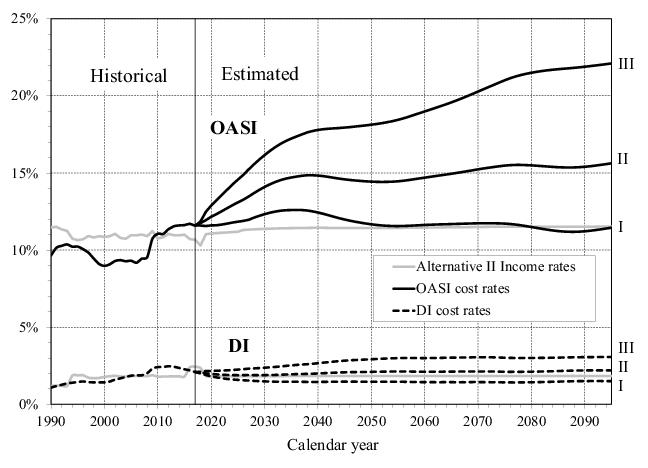
From 2018 to 2037, the OASI cost rate rises rapidly because the retirement of the baby-boom generation will continue to increase the number of beneficiaries much faster than the number of workers increases, as subsequent lower-birth-rate generations replace the baby-boom generation at working ages. From 2038 to 2052, the cost rate declines because the aging baby-boom generation is gradually replaced at retirement ages by the subsequently lower-birth-rate generation born between 1966 and 1989. After 2052, the projected OASI cost rate rises through 2078 and then fluctuates, reaching 15.48 percent of taxable payroll for 2092, with the increase primarily because of projected reductions in death rates at older ages.
Projections of income rates under the low-cost and high-cost sets of assumptions are similar to those projected for the intermediate assumptions, because income rates are largely a reflection of the payroll tax rates specified in the law, with the changes from taxation of benefits noted above. In contrast, OASI cost rates for the low-cost and high-cost assumptions are significantly different from those projected for the intermediate assumptions. For the low-cost assumptions, the OASI cost rate decreases through 2019, and then rises until it peaks in 2036 at 12.60 percent of payroll. The cost rate then declines to 11.56 percent for 2055, rises to 11.74 percent for 2071, and declines again to 11.18 percent for 2088 before rising to 11.30 percent for 2092, at which point the income rate reaches 11.26 percent. For the high-cost assumptions, the OASI cost rate rises throughout the 75-year period. It rises relatively rapidly through about 2039 because of the aging of the baby-boom generation. Thereafter, the cost rate continues to rise and reaches 21.97 percent of payroll for 2092, at which point the income rate reaches 11.92 percent.
The pattern of the projected OASI annual balance is important in the analysis of the financial condition of the program. Under the intermediate assumptions, the annual balance is negative throughout the projection period. This annual deficit is temporarily higher for years 2016 through 2018 because of the 0.57‑percentage-point payroll tax rate reallocation from OASI to DI. After returning to the pre-reallocation tax rates in 2019, the annual deficit then rises relatively rapidly from 0.91 percent for 2019 to 3.41 percent for 2038. It then declines to 2.99 percent of payroll for 2052, and generally rises thereafter, reaching 3.96 percent of taxable payroll for 2092.
Under the low-cost assumptions, after the 2016-2018 payroll tax rate reallocation period, the OASI annual deficit generally rises from 0.56 percent of payroll for 2019 to 1.30 percent of payroll for 2035. Then the annual deficit generally declines until it becomes a positive annual balance for 2085. The annual balance turns negative again for 2092, at which point the deficit is 0.04 percent of payroll. Under the high-cost assumptions, the OASI balance generally worsens throughout the projection period. Annual deficits rise to 1.77 percent for 2020, 6.48 percent for 2050, and 10.05 percent of payroll for 2092.
Income
rate a
Cost
rateb
d

a
Income rates include certain reimbursements from the General Fund of the Treasury.

b
Benefit payments scheduled to be paid on January 3 are actually paid on December 31 as required by the statutory provision for early delivery of benefit payments when the normal payment delivery date is a Saturday, Sunday, or legal public holiday. For comparability with the values for historical years and the projections in this report, all trust fund operations and asset reserves reflect the 12 months of benefits scheduled for payment each year.

c
Between 0 and 0.005 percent of taxable payroll.

d
The annual balance is projected to be negative for a temporary period and return to positive levels before the end of the projection period.

Notes:
1. The income rate excludes interest income.
2. Revisions of taxable payroll may change some historical values.
3. Totals do not necessarily equal the sums of rounded components.
Under the intermediate assumptions, the projected DI cost rate declines from 2.06 percent for 2018 to 1.89 percent for 2025, and remains relatively stable through 2032. After 2032, the DI cost rate increases gradually to 2.13 percent for 2055. From 2055 to 2077, the DI cost rate stays relatively stable before increasing slowly to 2.20 percent of payroll for 2092. The projected DI income rate decreases from 2.35 percent of payroll for 2018 to 1.84 for 2019. Between 2016 and 2018, the income rate is higher due to the temporary payroll tax rate reallocation. Thereafter, the income rate remains relatively stable, reaching 1.84 percent for 2092. The annual balance is positive for years 2016 through 2018, reflecting the reallocation. Thereafter, the annual deficit reappears, generally declines from 0.17 percent for 2019 to a low of 0.06 percent for 2029, and then generally increases to 0.36 percent for 2092.
Under the low-cost assumptions, the projected DI cost rate declines from 2.00 percent of payroll for 2018 to 1.45 percent for 2039, and remains relatively stable thereafter, reaching 1.51 percent for 2092. The annual balance is positive for 2018, negative for 2019, and positive throughout the remainder of the long-range period. Under the high-cost assumptions, the DI cost rate generally rises throughout the projection period, reaching 3.06 percent for 2092. The annual deficit is negative from 2019 through the remainder of the projection period, reaching 0.31 percent for 2019, 1.07 percent for 2050, and 1.20 percent for 2092.
Figure IV.B1 shows the patterns of the historical and projected OASI and DI annual cost rates. Annual DI cost rates rose substantially between 1990 and 2010 in large part due to: (1) aging of the working population as the baby-boom generation moved from ages 25-44 in 1990, where disability prevalence is low, to ages 45-64 in 2010, where disability prevalence is much higher; (2) a substantial increase in the percentage of women insured for DI benefits as a result of increased and more consistent rates of employment; and (3) increased disability incidence rates for women to a level similar to those for men by 2010. After 2010, all of these factors stabilize, and therefore the DI cost rate stabilizes also. Annual OASI cost rates follow a similar pattern to that for DI, but displaced 20 to 25 years later, because the baby-boom generation enters retirement ages 20 to 25 years after entering prime disability ages. Figure  IV.B1 shows only the income rates for alternative II because the variation in income rates by alternative is very small. Income rates generally increase slowly for each of the alternatives over the long-range period. Taxation of benefits, which is a relatively small portion of income, is the main source of both the increases in the income rate and the variation among the alternatives. Increases in income from taxation of benefits reflect: (1) increases in the total amount of benefits scheduled to be paid and (2) the increasing share of individual benefits that will be subject to taxation because benefit taxation threshold amounts are not indexed.
Table IV.B1 shows the annual balances for OASI, DI, and OASDI. The pattern of the annual balances is important to the analysis of the financial condition of the Social Security program as a whole. As seen in figure  IV.B1, the magnitude of each of the positive balances is the distance between the appropriate cost-rate curve and the income-rate curve above it. The magnitude of each of the deficits is the distance between the appropriate cost-rate curve and the income-rate curve below it. Annual balances follow closely the pattern of annual cost rates after 1990 because the payroll tax rate does not change for the OASDI program, with only small variations in the allocation between DI and OASI except for the 2016-2018 payroll tax rate reallocation.
In the future, the costs of OASI, DI, and the combined OASDI programs as a percentage of taxable payroll are unlikely to fall outside the range encompassed by alternatives I and III because alternatives I and III define a wide range of demographic and economic conditions.
Long-range OASDI cost and income are most often expressed as percentages of taxable payroll. However, the Trustees also present cost and income as shares of gross domestic product (GDP), the value of goods and services produced during the year in the United States. Under alternative II, the Trustees project OASDI cost to increase from about 4.9 percent of GDP for 2018 to a peak of about 6.1 percent for 2038. After 2038, OASDI cost as a percentage of GDP declines to a low of about 5.9 percent for 2052 and thereafter generally increases slowly, reaching about 6.1 percent by 2092. Appendix G presents full estimates of income and cost relative to GDP.
Table IV.B2 contains historical and projected annual income rates and their components by trust fund and alternative. The annual income rates consist of the scheduled payroll tax rates, the rates of income from taxation of scheduled benefits, and the rates of income from General Fund reimbursements. Projected income from taxation of benefits increases over time for reasons discussed on page 52. Historical General Fund reimbursements include temporary reductions in revenue due to reduced payroll tax rates and certain other miscellaneous items.
Tax-ation
of
bene-
fitsa
General Fund Reim-burse-mentsb
Totalc
d
d
d
d
d
d
d
d
d
d
d
d
d
d
d
d
d
d
d
d
d
d
d
d
d
d
d
d
d
d
d
d
d
d
d
d
d
d
d
d
d
d
d
d
d
d
d
d
d
d
d
d
d
d
d
d
d
d
d
d
d
d
d
d
d
d
d
d
d
d
d
d
d
d
d
d
d
d
d
d
d
d
d
d
d
d
d
d
d
d
d
d
d
d
d
d
d
d
d
d
d
d
d
d
d
d
d
d
d
d
d
d
d
d
d
d
d
d
d
d
d
d
d
d
d
d
d
d
d
d
d
d
d
d
d
d
d
d
d
d
d
d
d
d
d
d
d
d
d
d
d
d
d
d
d
d
d
d
d
d
d
d
d
d
d
d
d
d
d
d
d
d
d
d
d
d
d
d
d
d
d
d
d
d
d
d
d
d
d
d
d
d
d
d
d
d
d
d
d
d
d
d
d
d
d
d
d
d
d
d
d
d
d
d
d
d
d
d
d
d
d
d
d
d
d
d
d
d
d
d
d
d
d
d
d
d
d
d

a
Revenue from taxation of benefits is the amount that would be assessed on benefit amounts scheduled in the law.

b
Includes payroll tax revenue forgone under the provisions of Public Laws 111-147, 111-312, 112-78, and 112‑96, and other miscellaneous reimbursements.

c
Values exclude interest income.

d
Between -0.005 and 0.005 percent of taxable payroll.

Note: Totals do not necessarily equal the sums of rounded components.
2. Comparison of Workers to Beneficiaries
Under the intermediate assumptions, the Trustees project the OASDI cost rate will rise rapidly between 2018 and 2035, primarily because the number of beneficiaries rises much more rapidly than the number of covered workers as the baby-boom generation retires. The ratio of OASDI beneficiaries to workers is dominated by the OASI program because all workers eventually die or retire, but only a relatively small minority become disabled. The trends described below are primarily due to demographic changes and thus affect the DI program roughly 20 years earlier than the OASI and OASDI programs. The baby-boom generation had lower fertility rates than their parents, and the Trustees expect that lower fertility rates will persist for all future generations; therefore, the ratio of OASDI beneficiaries to workers will rise rapidly and reach a permanently higher level after the baby-boom generation retires. Due to increasing longevity, the ratio of beneficiaries to workers will generally rise slowly thereafter. Table  IV.B3 provides a comparison of the numbers of covered workers and beneficiaries.
Covered
workers a
(in thousands)
Beneficiaries b (in thousands)
OASDIc

a
Workers who are paid at some time during the year for employment on which OASDI taxes are due.

b
Beneficiaries with monthly benefits in current-payment status as of June 30.

c
This column is the sum of OASI and DI beneficiaries. A small number of beneficiaries receive benefits from both funds.

Notes:
1. The number of beneficiaries does not include uninsured individuals who received benefits under Section 228 of the Social Security Act. The General Fund of the Treasury reimbursed the trust funds for the costs of most of these individuals.
2. Historical covered worker and beneficiary data are subject to revision.
3. Totals do not necessarily equal the sums of rounded components.
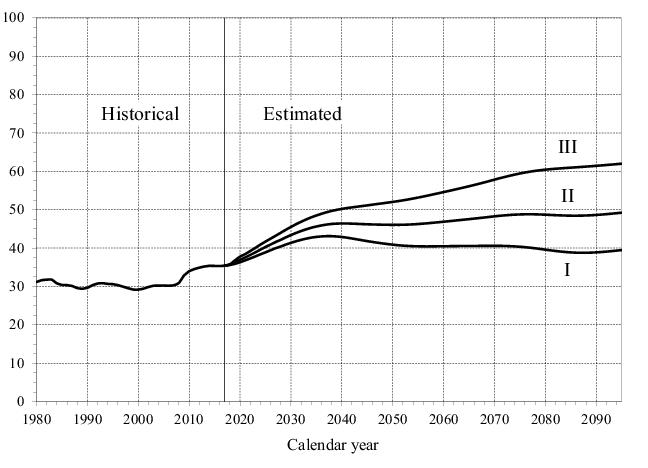
The effect of the demographic shift under the three alternatives on the OASDI cost rates is clear when one considers the projected number of OASDI beneficiaries per 100 covered workers. Compared to the 2017 level of 35 beneficiaries per 100 covered workers, the Trustees project that this ratio rises to 46 by 2035 under the intermediate assumptions because the growth in beneficiaries greatly exceeds the growth in workers. By 2095, this projected ratio rises further under the intermediate and high-cost assumptions, reaching 49 under the intermediate assumptions and 62 under the high-cost assumptions. Under the low-cost assumptions, this ratio rises to 43 by 2035 and then generally declines, reaching 39 by 2095. Figure  IV.B2 shows beneficiaries per 100 covered workers.
For each alternative, the curve in figure  IV.B2 is strikingly similar to the corresponding cost-rate curve in figure  IV.B1. This similarity emphasizes the extent to which the cost rate is determined by the age distribution of the population. The cost rate is essentially the product of the number of beneficiaries and their average benefit, divided by the product of the number of covered workers and their average taxable earnings. For this reason, the pattern of the annual cost rates is similar to that of the annual ratios of beneficiaries to workers.
Table IV.B3 also shows the number of covered workers per OASDI beneficiary, which was about 2.8 for 2017. Under the intermediate assumptions, this ratio declines generally throughout the long-range period, reaching 2.2 for 2035 and 2.0 by 2095. Under the low-cost assumptions, this ratio declines to 2.3 for 2035, generally rises from 2035 through 2055, and remains relatively stable at 2.5 through 2095. Under the high-cost assumptions, this ratio decreases steadily to 1.6 by 2095.
3. Trust Fund Ratios and Test of Long-Range Close Actuarial Balance
Trust fund ratios are critical indicators of the adequacy of the financial resources of the Social Security program. The trust fund ratio for a year is the amount of asset reserves in a fund at the beginning of a year expressed as a percentage of the cost for the year. Under present law, the OASI and DI Trust Funds do not have the authority to borrow other than in the form of advance tax transfers, which are limited to expected taxes for the current calendar month. If reserves held in either trust fund become depleted during a year, and continuing tax revenues fall short of the cost of scheduled benefits, then full scheduled benefits would not be payable on a timely basis. For this reason, the trust fund ratio is a very critical financial measure.
The trust fund ratio serves an additional important purpose in assessing the actuarial status of the program. If the projected trust fund ratio is positive throughout the period and is either level or increasing at the end of the period, then projected adequacy for the long-range period is likely to continue for subsequent reports. Under these conditions, the program has achieved sustainable solvency.
Table IV.B4 shows the Trustees’ projections of trust fund ratios by alternative, without regard to advance tax transfers that would be effected, for the separate and combined OASI and DI Trust Funds. The table also shows the years of trust fund reserve depletion and the percentage of scheduled benefits that would be payable thereafter, by alternative.
Under the intermediate assumptions, the OASI trust fund ratio is projected to decline from 330 percent at the beginning of 2018 until the trust fund reserves become depleted late in 2034 (as compared to early 2035 for last year’s report), at which time 77 percent of scheduled benefits would be payable. The DI trust fund ratio is 48 percent at the beginning of 2018. The 0.57‑percentage-point reallocation of payroll tax rate (for 2016 through 2018) from OASI to DI increases the trust fund ratio to 62 percent at the beginning of 2019. After 2019, the trust fund ratio declines until the trust fund reserves become depleted in 2032 (4 years later than projected in last year’s report), at which time 96 percent of scheduled benefits would be payable.
Under the intermediate assumptions, the trust fund ratio for the combined OASI and DI Trust Funds declines from 288 percent at the beginning of 2018 until the combined fund reserves become depleted in 2034 (the same year as projected in last year’s report), at which time 79 percent of scheduled benefits would be payable.
Under the low-cost assumptions, the trust fund ratio for the DI program increases from 49 percent at the beginning of 2018 to 66 percent at the beginning of 2019, again reflecting the temporary payroll tax rate reallocation. The DI trust fund ratio is then stable through 2021 and thereafter increases through the end of the long-range projection period, reaching the extremely high level of 2,194 percent for 2093. For the OASI program, the trust fund ratio declines steadily, from 331 percent for 2018 until the reserves become depleted in 2062, at which time 97 percent of scheduled benefits would be payable. For the combined OASDI program, the trust fund ratio declines from 289 percent for 2018 to a low of 112 percent in 2048, then rises thereafter, reaching 197 percent by 2093. Because the trust fund ratio is positive throughout the projection period and increasing at the end of the period, under the low-cost assumptions, the DI program and the combined OASDI program achieve sustainable solvency.
Under the high-cost assumptions, the OASI trust fund ratio declines continually until reserves become depleted in 2030, at which time 69 percent of scheduled benefits would still be payable. The DI trust fund ratio increases from 47 percent for 2018 to 59 percent for 2019 because of the payroll tax rate reallocation, but reserves decline quickly after that and become depleted in 2022. At that time, 83 percent of scheduled benefits would still be payable. The combined OASI and DI trust fund ratio declines from 288 percent for 2018 until reserves become depleted in 2030, at which time 70 percent of scheduled benefits would still be payable.
The Trustees project trust fund reserve depletion within the 75-year projection period with the exceptions of the combined OASI and DI Trust Funds and the DI Trust Fund under the low-cost assumptions. It is therefore very likely that lawmakers will need to increase income, reduce program costs, or both, in order to maintain solvency for the trust funds. The stochastic projections discussed in appendix E suggest that trust fund reserve depletion is highly probable by mid-century.
Even under the high-cost assumptions, however, the combined OASI and DI Trust Fund reserves on hand plus their estimated future income are sufficient to fully cover their combined cost until 2030. Under the intermediate assumptions, the combined starting fund reserves plus estimated future income are sufficient to fully cover cost until 2034. In the 2017 report, the Trustees projected that the combined trust fund reserves would become depleted in 2029 and 2034 under the high-cost and intermediate assumptions, respectively, and would achieve sustainable solvency under the low-cost assumptions.
Table IV.B4.—Trust Fund Ratios, Calendar Years 2018-2095a

a
Benefit payments scheduled to be paid on January 3 are actually paid on December 31 as required by the statutory provision for early delivery of benefit payments when the normal payment delivery date is a Saturday, Sunday, or legal public holiday. For comparability with the values for historical years and the projections in this report, all trust fund ratios reflect the 12 months of benefits scheduled for payment each year.

b
Trust fund reserves would be depleted at the beginning of this year.

c
Trust fund reserves would not be depleted within the projection period.

Note: The definition of trust fund ratio appears in the Glossary. The ratios shown for the combined trust funds for years after reserve depletion of either the DI or OASI Trust Fund are hypothetical.
Since 2013, when the Trustees modified the test of long-range close actuarial balance, the standard for each trust fund requires meeting two conditions: (1) the test of short-range financial adequacy is satisfied; and (2) the trust fund ratios stay above zero throughout the 75-year projection period, allowing scheduled benefits to be paid in a timely manner throughout the period. Both the long-range test and the short-range test are applied based on the intermediate set of assumptions. As discussed in section IV. A, the DI Trust Fund fails the test of short-range financial adequacy because the trust fund ratio does not reach 100 percent at any time during the 10-year period. Under the intermediate assumptions, the OASI Trust Fund reserves become depleted in 2034, DI Trust Fund reserves become depleted in 2032, and the combined OASI and DI Trust Fund reserves become depleted in 2034. Therefore, the OASI, DI, and combined OASI and DI Trust Funds all fail the test of long-range close actuarial balance.
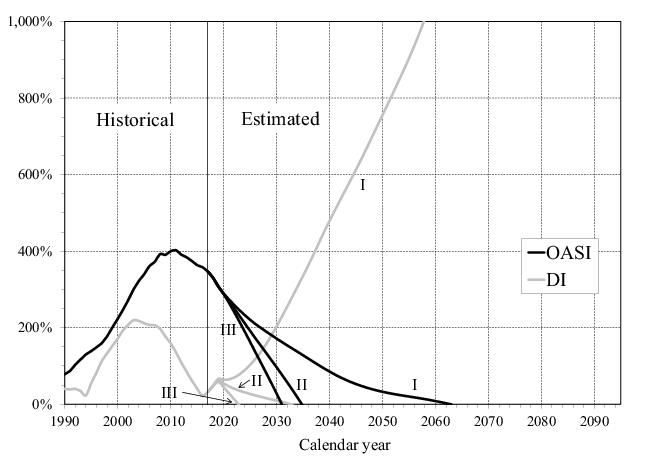
Figure IV.B3 illustrates the trust fund ratios for the separate OASI and DI Trust Funds for each of the alternative sets of assumptions. DI Trust Fund status is more uncertain than OASI Trust Fund status because there is a high degree of uncertainty associated with future disability prevalence. A graph of the trust fund ratios for the combined trust funds appears in figure  II.D6.
4. Summarized Income Rates, Summarized Cost Rates, and Actuarial Balances
Summarized values for the full 75-year period are useful in analyzing the program’s long-range financial adequacy over the period as a whole, both under present law and under proposed modifications to the law. All annual amounts included in a summarized value are present-value discounted to the valuation date. It is important to note that the actuarial balance indicates the solvency status of the fund only for the very end of the period.
Table IV.B5 presents summarized income rates, summarized cost rates, and actuarial balances for 25-year, 50-year, and 75-year valuation periods. Summarized income rates are the sum of the present value of non-interest income for a period (which includes scheduled payroll taxes, the projected income from the taxation of scheduled benefits, and reimbursements from the General Fund of the Treasury) and the starting trust fund asset reserves, expressed as a percentage of the present value of taxable payroll over the period. Under current law, the total OASDI payroll tax rate will remain at 12.4 percent in the future. In contrast, the Trustees expect income from taxation of benefits, expressed as a percentage of taxable payroll, to increase in most years of the long-range period for the reasons discussed earlier on page 52. Summarized cost rates are the sum of the present value of cost for a period (which includes scheduled benefits, administrative expenses, net interchange with the Railroad Retirement program, and payments for vocational rehabilitation services for disabled beneficiaries) and the present value of the cost of reaching a target trust fund of 100 percent of annual cost at the end of the period, expressed as a percentage of the present value of taxable payroll over the period.
The actuarial balance for a valuation period is equal to the difference between the summarized income rate and the summarized cost rate for the period. An actuarial balance of zero for any period indicates that cost for the period could be met for the period as a whole (but not necessarily at all points within the period), with a remaining trust fund reserve at the end of the period equal to 100 percent of the following year’s cost. A negative actuarial balance for a period indicates that the present value of income to the program plus the existing trust fund is less than the present value of the cost of the program plus the cost of reaching a target trust fund reserve of 1 year’s cost by the end of the period. Generally, a trust fund is deemed to be adequately financed for a period if the actuarial balance is zero or positive, meaning that the reserves at the end of the period are at least equal to annual cost. Note that solvency is possible with a small negative actuarial balance where reserves are still positive.3
Table IV.B5 contains summarized rates for the intermediate, low-cost, and high-cost assumptions. The low-cost and high-cost assumptions define a wide range of possibilities. Financial outcomes as good as the low-cost scenario or as bad as the high-cost scenario are unlikely to occur.
For the 25-year valuation period, the OASDI program has an actuarial balance of 0.09 percent of taxable payroll under the low-cost assumptions, ‑1.77 percent under the intermediate assumptions, and -3.90 percent under the high-cost assumptions. These balances indicate that the program is adequately financed for the 25‑year valuation period under only the low-cost assumptions.
For the 50‑year valuation period, the OASDI program has actuarial balances of 0.08 percent under the low-cost assumptions, ‑2.45 percent under the intermediate assumptions, and ‑5.55 percent under the high-cost assumptions. These actuarial balances mean that the OASDI program is adequately financed for the 50‑year valuation period under only the low-cost assumptions.
For the entire 75-year valuation period, the combined OASDI program has actuarial balances of 0.13 percent of taxable payroll under the low-cost assumptions, ‑2.84 percent under the intermediate assumptions, and ‑6.62 percent under the high-cost assumptions. These balances indicate that the combined OASDI program is adequately financed for the 75-year valuation period under only the low-cost assumptions.
Assuming the intermediate assumptions accurately capture future demographic and economic trends, solvency for the program over the next 75 years could be restored using a variety of approaches. For example, revenues could be increased in a manner equivalent to an immediate and permanent increase in the combined Social Security payroll tax rate from 12.40 percent to 15.18 percent (a relative increase of 22.4 percent), cost could be reduced in a manner equivalent to an immediate and permanent reduction in scheduled benefits of about 17 percent, or some combination of approaches could be used.
However, eliminating the actuarial deficit for the next 75-year valuation period requires raising payroll taxes or lowering benefits by more than is required just to achieve solvency, because the actuarial deficit includes the cost of attaining a target trust fund equal to 100 percent of annual program cost by the end of the period. The actuarial deficit could be eliminated for the 75-year period by increasing revenues in a manner equivalent to an immediate and permanent increase in the combined payroll tax from 12.40 percent to 15.35 percent (a relative increase of 23.8 percent),4 reducing cost in a manner equivalent to an immediate reduction in scheduled benefits of about 18 percent, or some combination of approaches could be used.
Under the intermediate assumptions, the OASDI program has large annual deficits toward the end of the long-range period that are increasing and reach 4.32 percent of payroll for 2092 (see table IV.B1). These large deficits indicate that annual cost continues to exceed non-interest income after 2092, so continued adequate financing would require larger changes than those needed to maintain solvency for the 75-year period. Over the period extending through the infinite horizon, the actuarial deficit is 4.0 percent of payroll under the intermediate assumptions.
Beginning
asset reservesa

a
Benefit payments scheduled to be paid on January 3 are actually paid on December 31 as required by the statutory provision for early delivery of benefit payments when the normal payment delivery date is a Saturday, Sunday, or legal public holiday. For comparability with the values for historical years and the projections in this report, all trust fund operations and asset reserves reflect the 12 months of benefits scheduled for payment each year.

Note: Totals do not necessarily equal the sums of rounded components.
5. Open Group Unfunded Obligation
Consistent with practice since 1965, this report focuses on a 75-year open group valuation to evaluate the long-run financial status of the OASDI program. The open group valuation includes non-interest income and cost for past, current, and future participants through the year 2092. The open group unfunded obligation measures the adequacy of financing over the period as a whole for a program financed on a pay-as-you-go basis. On this basis, payroll taxes and scheduled benefits for all participants are included through 2092.
The open group unfunded obligation increased from $12.5 trillion shown in last year's report to $13.2 trillion in this report. If there had been no changes in starting values, assumptions, laws, or methods for this report, then the open group unfunded obligation would have increased to $13.1 trillion solely due to the change in the valuation period. This expected increase in the unfunded obligation occurs because: (1) the unfunded obligation is now discounted to January 1, 2018, rather than to January 1, 2017, which tends to increase the unfunded obligation by the annual nominal interest rate; and (2) the unfunded obligation now includes an additional year (2092). However, changes in the law, assumptions, methods, and starting values resulted in a net $0.1 trillion increase in the unfunded obligation.
The 75-year unfunded obligation is equivalent to 2.68 percent of future OASDI taxable payroll and 1.0 percent of GDP through 2092. These percentages were 2.66 and 0.9, respectively, for last year’s report. The 75-year unfunded obligation as a percentage of taxable payroll is less than the actuarial deficit, because the unfunded obligation excludes the cost of having an ending target trust fund value.
The actuarial deficit was 2.83 percent of payroll in last year’s report, and was expected to increase to a deficit of 2.88 percent of payroll solely due to the change in the valuation period. Changes in the law, assumptions, methods, and starting values combined to account for a 0.04 percent decrease (improvement) in the actuarial deficit to 2.84 percent of payroll. For additional details on these changes, see section  IV.B.6.
Table IV.B6 presents the components and the calculation of the long-range (75-year) actuarial balance under the intermediate assumptions. The present value of future cost less future non-interest income over the long-range period, minus the amount of trust fund asset reserves at the beginning of the projection period, is $13.2 trillion for the OASDI program. This amount is the 75-year “open group unfunded obligation” (see row H). The actuarial deficit (which is the negative of the actuarial balance) combines this unfunded obligation with the present value of the ending target trust fund and expresses the total as a percentage of the present value of the taxable payroll for the period. The present value of future non-interest income minus cost, plus starting trust fund reserves, minus the present value of the ending target trust fund, is ‑$14.0 trillion for the OASDI program.
a
a
E.

a
Less than $0.5 billion.

b
The calculation of the actuarial balance includes the cost of accumulating a target trust fund reserve equal to 100 percent of annual cost at the end of the period.

Note: Totals do not necessarily equal the sums of rounded components.
Consideration of summary measures alone (such as the actuarial balance and open group unfunded obligation) for a 75-year period can lead to incorrect perceptions and to policy prescriptions that do not achieve sustainable solvency. These concerns can be addressed by considering the trend in trust fund ratios toward the end of the period. (See the discussion of “sustainable solvency” beginning on page 51.)
Another measure of trust fund finances, discussed in appendix F, is the infinite horizon unfunded obligation, which takes account of all annual balances, even those after 75 years. The extension of the time period past 75 years assumes that the current-law OASDI program and the demographic and economic trends used for the 75‑year projection continue indefinitely. This infinite horizon unfunded obligation is estimated to be 4.0 percent of taxable payroll or 1.3 percent of GDP. These percentages were 4.2 and 1.4, respectively, for last year’s report. Of course, the degree of uncertainty associated with estimates increases substantially for years further in the future.
6. Reasons for Change in Actuarial Balance From Last Report
Table IV.B7 shows the effects of changes on the long-range actuarial balance under the intermediate assumptions, by category, between last year’s report and this report.
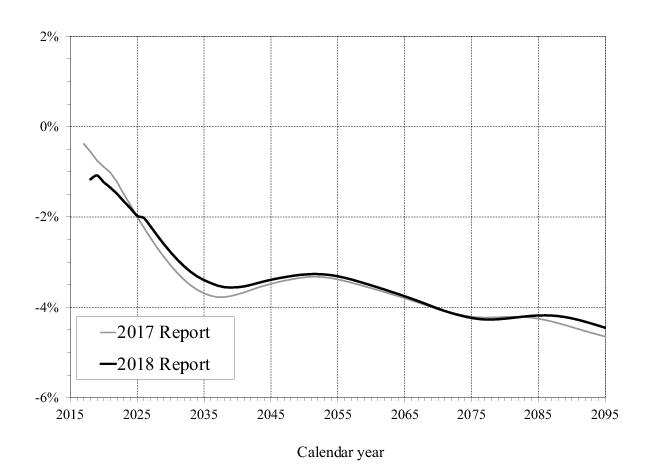
Valuation period a

a
The change in the 75-year valuation period from last year’s report to this report means that the 75-year actuarial balance now includes the relatively large negative annual balance for 2092. This change in the valuation period results in a larger long-range actuarial deficit. The actuarial deficit includes the trust fund reserve at the beginning of the projection period.

Note: Totals do not necessarily equal the sums of rounded components.
If the law, data, assumptions, and methods had all remained unchanged from last year’s Trustees Report, the long-range OASDI actuarial balance would have decreased (become more negative) by 0.06 percent of taxable payroll solely due to the change in the valuation period. However, as described below, projections in this report also reflect changes in law, data, assumptions, and methods. These changes, including the change in the valuation period, combine to decrease the long-range OASDI actuarial balance from ‑2.83 percent of taxable payroll in last year’s report to -2.84 percent in this report.
Since the last report, there have been no new laws, regulations, or policy changes that are expected to have significant long-range financial effects on the OASDI program. However, this year’s report does incorporate two notable changes with negligible effects on the actuarial balance. First, estimates in this report reflect the assumption that the 2012 Deferred Action for Childhood Arrivals (DACA) program will be phased out over the next 2 years after having been rescinded by the Administration on September 5, 2017. Last year's report assumed that the 2012 DACA program would continue indefinitely. Incorporating the phase-out of DACA has a negligible negative effect on the long-range actuarial balance for this year’s report. Second, Public Law 115-97, the Tax Cuts and Jobs Act, was enacted on December 22, 2017. There are two aspects of this law with notable effects on the OASDI program. The repeal of the individual mandate of the Patient Protection and Affordable Care Act is expected to cause some individuals to drop their employer sponsored health insurance, which is estimated to increase OASDI covered wages and taxable payroll slightly. The changes to income tax rates and brackets are expected to have small effects, reducing income from taxation of benefits through 2025 and increasing it thereafter. The combined effects of the Tax Cuts and Jobs Act increase the long-range actuarial balance for this report by a negligible positive amount.
As mentioned above, changing the 75-year valuation period from 2017 through 2091 for last year’s report to 2018 through 2092 for this report decreases the projected long-range OASDI actuarial balance by 0.06 percent of taxable payroll. This decrease is mainly the result of including the relatively large negative annual balance for 2092 in this year’s 75-year projection period. Note that the actuarial balance calculation includes trust fund asset reserves at the beginning of the projection period. These reserves at the start of the period reflect the program’s net financial flows for all past years up to the start of the projection period, including 2017.
All changes in demographic data and assumptions combine to decrease the long-range OASDI actuarial balance by 0.01 percent of taxable payroll. Ultimate demographic assumptions are unchanged from those in last year’s report, with the exception of one minor change to the ultimate immigration assumptions. In particular, the ultimate number of assumed lawful-permanent-resident (LPR) immigrants has been decreased by 10,000 per year in the future due to clarification from the Department of Homeland Security (DHS) regarding the implementation of the 2014 executive actions on immigration. One of these executive actions was intended to increase the number of entrepreneur green cards issued. Therefore, beginning with the 2015 report, the Trustees assumed an increase of 10,000 LPR immigrants per year. DHS recently clarified that this executive action was never implemented, and the Trustees assume it will not be implemented. Therefore, the earlier assumption is being reversed for this report. This change is expected to have a negligible effect on the actuarial balance.
This year’s report also includes one change to the near-term demographic assumption for the total fertility rate. Last year’s report included a rise in the projected total fertility rate to a level of 2.05 for 2023. This rise reflected the assumption that the drop in the total fertility rate below 2.0 during the recent economic downturn was, in part, a deferral in childbearing that would be partially offset during the latter stages of the economic recovery. However, as the economic recovery has continued to near completion, and more recent data have not shown a recovery in fertility rates, it seems more likely that this persistent drop in the total fertility rate represents a loss of potential births rather than just a deferral for this period. Therefore, this year’s report eliminates the temporary rise in the total fertility rate above the ultimate assumed level. This change decreases the actuarial balance by 0.05 percent of taxable payroll.
Four demographic data updates had significant effects on the long-range OASDI actuarial balance. First, final fertility (birth) data for 2016 indicate somewhat lower birth rates than were assumed in last year’s report for 2016. These updated data result in slightly lower birth rates during the transition period to the ultimate levels, decreasing the actuarial balance by 0.03 percent of taxable payroll. Second, incorporating 2015 mortality data for ages under 65 from the National Center for Health Statistics (NCHS) and preliminary 2015 mortality data for ages 65 and older from Medicare experience resulted in higher death rates for all future years than were projected in last year’s report. These higher death rates increase (improve) the actuarial balance by 0.05 percent of taxable payroll. Third, this year’s estimates incorporate updated LPR immigration data from DHS, which decreases the actuarial balance by 0.01 percent of taxable payroll. Fourth, updates to historical population data and other minor data updates combine to increase the actuarial balance by 0.04 percent of taxable payroll. The majority of this change is due to updated historical estimates of the other-than-LPR population for 2014 and 2015, and the resulting effects on the projection of labor force, employment, covered workers, and beneficiaries.
Changes in economic data and assumptions combine to decrease the long-range OASDI actuarial balance by 0.01 percent of payroll. Ultimate economic assumptions are unchanged from those in last year’s report. However, primarily due to slow growth in labor productivity for 2010 through 2017 and low unemployment rates in 2017, the estimated level of potential GDP is reduced for this report by about 1 percent in 2017 and throughout the projection period. This lower estimated level of potential GDP means that cumulative growth in actual GDP is 1 percent less over the remainder of the projected recovery, and thus decreases the actuarial balance by 0.02 percent of taxable payroll. In addition, near-term interest rates were decreased for this report, reflecting a more gradual path for the rise to the ultimate real interest rate. These lower near-term interest rates decrease the actuarial balance by 0.02 percent of payroll. Other changes to data and near-term economic assumptions, including an extended recovery from lower-than-expected ratios for 2016 and 2017 of labor compensation to GDP and taxable payroll to GDP to the unchanged ultimate ratios, combine for a net increase in the actuarial balance of 0.03 percent of taxable payroll.
Although ultimate disability assumptions are unchanged from those in last year’s report, changes in recent disability data and near-term assumptions increase the long-range OASDI actuarial balance by 0.01 percent of taxable payroll. Recent data have shown lower levels of disability applications and awards than expected in last year’s report. Based on this experience, estimated disabled-worker incidence rates are reduced for this report over the first few years of the short-range period. This year’s report also incorporates lower average benefit levels for disabled workers newly awarded benefits in 2017 and in the future. These changes are primarily responsible for the change in the DI reserve depletion date from 2028 in last year’s report to 2032 in this year’s report. The short-range effects are noted in section  IV.A.4.
The projections in this report also reflect several methodological improvements and updates of program-specific data. These methodological changes, programmatic data updates, and interactions combine to increase the long-range OASDI actuarial balance by 0.05 percent of taxable payroll. Descriptions of six significant methodological changes and programmatic data updates follow.
First, this year’s report includes an improvement to the method for projecting mortality rates by marital status. The new method smooths the rates at older ages, utilizing recent data from NCHS and the American Community Survey, rather than older data from the Census Bureau and NCHS. This methodological improvement increases the actuarial balance by 0.01 percent of taxable payroll.
Second, the labor force participation rate model has been updated to improve the method for projecting educational attainment among women in age groups 45-49 and 50-54. This change better reflects recent increases in educational attainment among women entering these two age groups and results in an increase in their labor force participation. In turn, this leads to an increase in covered workers and taxable payroll over the projection period, which increases the actuarial balance by 0.02 percent of taxable payroll.
The third significant change is an increase in the assumed ultimate retired-worker prevalence rate for women at age 70. This year’s report increases the percentage of fully insured women (excluding those who are receiving a disability or widow benefit) who are assumed to be in receipt of a retired-worker benefit at age 70 from 99.0 percent in last year’s report to 99.5 percent in this year’s report, to be the same as the percentage assumed for men. This change increases the number of female retired workers, thus decreasing the actuarial balance by 0.02 percent of payroll.
The fourth significant change is in the long-range model for projecting average benefit levels of retired-worker and disabled-worker beneficiaries newly entitled for benefits. This model uses a large sample of 10 percent of all newly entitled retired-worker beneficiaries in a recent year. The sample used in the 2017 report was for worker beneficiaries newly entitled in 2013. This year’s report uses the results from worker beneficiaries newly entitled in 2015. In addition, the method used to estimate earnings histories for retired-worker beneficiaries becoming newly entitled in each year after 2017 has been expanded to better match targeted average taxable earnings levels for each of nine birth cohorts (those becoming entitled at ages 62 through 70 in a year). Together, the changes in the sample data and the model for projecting average benefits for newly-entitled worker beneficiaries increase the actuarial balance by 0.05 percent of payroll.
Fifth, recent data and estimates provided by the Office of Tax Analysis (OTA) at the Department of the Treasury indicate higher ultimate levels of revenue from taxation of OASDI benefits than projected in last year’s report, independent of the changes due to the recently-enacted Tax Cuts and Jobs Act. These higher levels are primarily due to changes OTA made in their modeling, resulting in a larger share of benefits being subject to income tax. The increase in ultimate projected ratios of income tax on benefits to benefit amounts results in an increase in the actuarial balance of 0.03 percent of taxable payroll.
The sixth significant change consists of methodological improvements in the modeling of retroactive benefit payments for newly awarded disabled-worker beneficiaries. This year’s projections incorporate both a better data source for determining the total number of months of retroactive benefits for newly awarded disabled-worker beneficiaries and a new adjustment factor which better aligns projected months of disabled-worker retroactive benefit entitlement with observed historical experience. These methodology changes combine to increase the actuarial balance by 0.02 percent of payroll.
In addition to these six significant methodological changes and programmatic data updates, changes in starting levels and projected levels of OASI and DI beneficiaries and benefit amounts over the first 10 years of the projection period, updating other programmatic data, other small methodological improvements, and interactions among the various method changes and updates to programmatic experience combine to decrease the long-range OASDI actuarial balance by 0.05 percent of taxable payroll.
Figure IV.B4 compares the annual cash-flow balances for this report and the prior year’s report for the combined OASDI program over the long-range (75-year) projection period. The figure illustrates the annual effects of the changes described earlier in this section.
The annual balances in this year’s report are lower (more negative) through 2024, noticeably higher from 2025 until about 2060, very similar from 2060 until about 2085, and then higher for the remainder of the projection period. For the full 75-year projection period, the annual balances average 0.06 percentage point higher. The lower annual balances in the near term for this year’s report are primarily due to lower projected payroll tax revenue for those years, which is caused by several factors. First, the Bureau of Economic Analysis (BEA) published revised data in July 2017 showing that the ratio of labor compensation to GDP for 2016 was 2.1 percent below the level used for the 2017 report. BEA also published data for 2017 indicating that the ratio of labor compensation to GDP was 3.1 percent below the level projected for the 2017 report. Second, based on a complete year of IRS earnings data, the ratio of OASDI effective taxable payroll to GDP for 2016 was 1.7 percent below the level projected for the 2017 report. Based on IRS data through the first half of 2017, the ratio of OASDI effective taxable payroll to GDP for 2017 is now estimated to be 2.0 percent lower than projected for the 2017 report. Third, for this year's report, the ratios of labor compensation to GDP and taxable payroll to GDP are projected to gradually return by 2027 to about the same levels as assumed for the 2017 report. Fourth, this year's report assumes a lower level of labor productivity and potential GDP from the start of the projection period, and therefore reflects slower actual GDP growth in the first ten years of the projection period. Finally, this year's report incorporates negative payroll tax revenue adjustments in 2018, due to overestimated revenue transferred to the trust funds in 2017.
These near-term economic effects are offset by 2025 and then exceeded due to the sunset after 2025 of certain legislative changes, and due to demographic effects, most significantly higher assumed mortality rates throughout the projection period and lower assumed fertility rates in the near-term. The higher mortality rates improve the annual balances by a small amount at first, increasing slowly over the next 35 years, and then remaining relatively level. The lower fertility rates lead to fewer workers and lower income from payroll taxes, which decreases the annual balances as compared to those in last year’s report; however, these lower fertility rates in the near-term also lead to fewer individuals receiving benefits, which causes an increase in the annual balances that more than offsets the reduction from fewer workers after about 2085. For 2091, the projected annual deficit is 4.28 percent of taxable payroll in this report, compared to 4.48 percent in last year's report.

1
See appendix F.

2
Adjustments include adding deemed wage credits based on military service for 1983-2001 and reflecting the lower effective tax rates (as compared to the combined employee-employer rate) that apply to multiple-employer “excess wages.” Lower rates also applied to net earnings from self-employment before 1984 and to income from tips before 1988.

3
A program is solvent over any period for which the trust fund maintains a positive level of asset reserves. In contrast, the actuarial balance for a period includes the cost of having a target fund equal to 100 percent of the following year’s cost at the end of the period. Therefore, if a program ends the period with reserves that are positive but not sufficient to cover the following year’s costs, it will be solvent at the end of the period and yet still have a small negative actuarial balance for that period.

4
The indicated increase in the payroll tax rate of 2.95 percent is somewhat larger than the 2.84 percent 75‑year actuarial deficit because the indicated increase reflects a behavioral response to tax rate changes. In particular, the calculation assumes that an increase in payroll taxes results in a small shift of wages and salaries to forms of employee compensation that are not subject to the payroll tax.


Table of Contents Previous Next Tables Figures Index
SSA Home | Privacy Policy | Website Policies & Other Important Information | Site Map | Actuarial Publications June 5, 2018