Open Data Progress Chart
Fiscal Year 2015

Download this dataset
(Updated )
This dataset contains data for fiscal year(s) 2015 on and is currently available in the following format(s):
View the Current Open Data Progress Chart
The chart below represents SSA's commitment to supporting Data.gov.
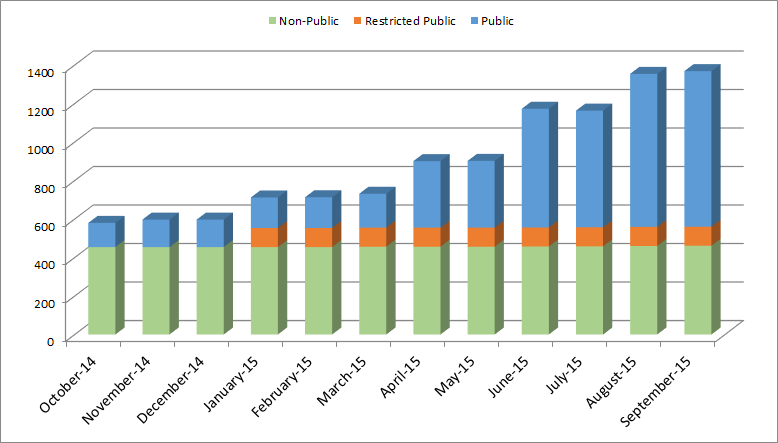
| Asset Type | Oct 2014 | Nov 2014 | Dec 2014 | Jan 2015 | Feb 2015 | Mar 2015 | Apr 2015 | May 2015 | Jun 2015 | Jul 2015 | Aug 2015 | Sep 2015 |
|---|---|---|---|---|---|---|---|---|---|---|---|---|
| Public | 126 | 143 | 143 | 159 | 160 | 176 | 346 | 347 | 617 | 606 | 795 | 808 |
| Restricted Public | 0 | 0 | 0 | 99 | 99 | 99 | 99 | 99 | 99 | 99 | 99 | 99 |
| Non-Public | 454 | 454 | 454 | 454 | 454 | 456 | 456 | 456 | 457 | 458 | 460 | 461 |
| Totals | 580 | 597 | 597 | 712 | 713 | 731 | 901 | 902 | 1,173 | 1,163 | 1,354 | 1,368 |
The following definitions will assist with review and analysis:
Public: Metadata about the SSA public assets provided to Data.gov.
Restricted Public: Metadata about the Data Exchanges provided to Data.gov.
Non-Public: Metadata about SSA assets provided to Data.gov and OMB as part of SSA's Enterprise Data Inventory. These assets represent part of the inventory which SSA either has not or cannot release publicly.
Notes
A Federal Fiscal Year (FY) is the 12-month period that starts the Saturday after the last Friday of September and ends the last Friday of September and the corresponding quarter. Most years our fiscal year workload reports contain 52 weeks since we include only full weeks, rather than cut off in the middle of a week. Every few years the reporting period is 53 weeks when we apply the end of week cutoff.
Reporting quarters are administratively set reporting periods and do not necessarily correspond exactly to calendar months.