Short-Range Actuarial Estimates
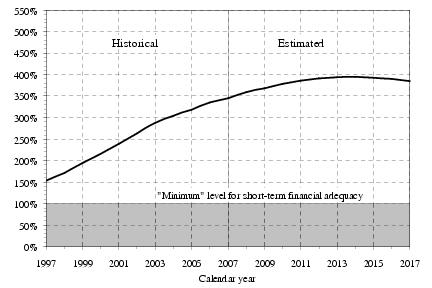
For the short range (2008-2017), the Trustees measure financial adequacy by comparing projected assets at the beginning of each year to projected program cost for that year under the intermediate set of assumptions. Having a trust fund ratio of 100 percent or more—that is, assets at the beginning of each year at least equal to projected cost for the year—is considered a good indication of a trust fund’s ability to cover most short-term contingencies. The projected trust fund ratios for OASI alone, and for OASI and DI combined, under the intermediate assumptions exceed 100 percent throughout the short-range period and therefore OASI and OASDI satisfy the Trustees’ short-term test of financial adequacy. Considering the DI program alone, however, its trust fund ratio is projected to fall below the 100 percent level before the end of 2017. Thus, DI fails to satisfy the Trustees’ short-term test of financial adequacy. Figure
II.D1 below shows that the trust fund ratios for the combined OASI and DI Trust Funds reach a peak level in 2014 and begin declining thereafter.
Long-Range Actuarial Estimates
The actuarial status of the program over the next 75 years is measured in terms of annual cost and income as a percentage of taxable payroll, trust fund ratios, the actuarial balance (also as a percentage of taxable payroll), and the open group unfunded obligation (expressed in present-value dollars and as percentages of taxable payroll and gross domestic product (GDP)). Considering Social Security’s annual cost and income as a percentage of the total U.S. economic output or GDP provides an additional important perspective.
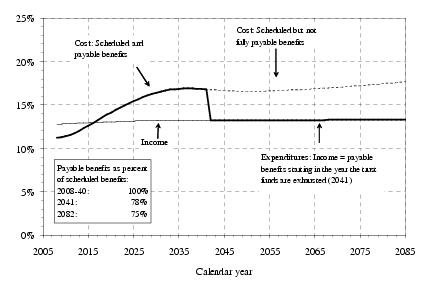
The year-by-year relationship between income and cost rates shown in figure II.D2 illustrates the expected pattern of cash flows for the OASDI program over the full 75-year period. Under the intermediate assumptions, the OASDI cost rate is projected to increase rapidly and first exceed the income rate in 2017, producing cash-flow deficits thereafter. Redemption of trust fund assets will allow continuation of full benefit payments on a timely basis until 2041, when the trust funds are projected to become exhausted. This redemption process will require a flow of cash from the General Fund of the Treasury. Pressures on the Federal Budget will thus emerge well before 2041. Even if a trust fund’s assets are exhausted, however, tax income will continue to flow into the fund. Present tax rates are projected to be sufficient to pay 78 percent of scheduled benefits after trust fund exhaustion in 2041 and 75 percent of scheduled benefits in 2082.
Social Security’s cost rate is projected to rise rapidly from 2010 through about 2030 as the baby-boom generation reaches retirement eligibility age. Thereafter, the cost rate is estimated to rise at a slower rate for about 5 years and then to remain fairly stable for the next 35 years. Continued reductions in death rates and maintaining birth rates at levels well below those from the baby-boom era and before will cause a continued increase in the average age of the population and will raise the cost rate from 17.0 percent of taxable payroll in 2070 to 17.5 percent by 2082 under the intermediate assumptions. In a pure pay-as-you-go system (with no trust fund assets or borrowing authority), this 17.5-percent cost rate would require that the combination of the payroll tax (scheduled to total 12.4 percent) and proceeds from income taxes on benefits (expected to be 0.9 percent of taxable payroll in 2082) be equal to 17.5 percent of taxable payroll to pay all currently scheduled benefits. After 2082, the increase in the average age of the population is likely to continue and to increase the gap between OASDI cost and income rates.
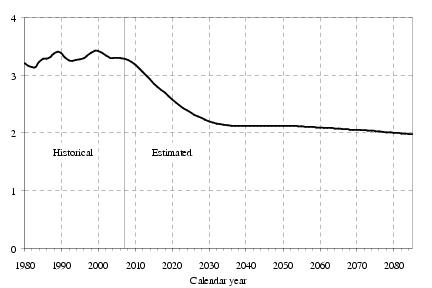
The primary reason that the OASDI cost rate will increase rapidly between 2010 and 2030 is that, as the large baby-boom generation born in the years 1946 through 1965 retires, the number of beneficiaries will increase much more rapidly than the number of workers. The estimated number of workers per beneficiary is shown in figure
II.D3. There were about 3.3 workers for every OASDI beneficiary in 2007. This ratio has been extremely stable, remaining between 3.2 and 3.4 since 1974. However, the baby-boom generation will have largely retired by 2030, and the ratio of workers to beneficiaries is projected to be only 2.2 at that time. Thereafter, the number of workers per beneficiary will slowly decline, and the OASDI cost rate will continue to increase, largely due to projected reductions in mortality.
The actuarial balance is a measure of the program’s financial status for the 75-year valuation period as a whole. It is essentially the difference between income and cost of the program expressed as a percentage of taxable payroll over the valuation period. This single number summarizes the adequacy of program financing for the period. When the actuarial balance is negative, the actuarial deficit can be interpreted as the percentage that could be added to the current law income rate for each of the next 75 years, or subtracted from the cost rate for each year, to bring the funds into actuarial balance. Because the effects of future changes are unlikely to follow this pattern, this measure should be viewed only as providing a rough indication of the amount of change that is needed over the 75‑year period as a whole. In this report, the actuarial balance under the intermediate assumptions is a deficit of 1.70 percent of taxable payroll for the combined OASI and DI Trust Funds. The actuarial deficit was 1.95 percent in the 2007 report and has been in the range of 1.86 percent to 2.19 percent for the prior 10 reports.
The main reason for the decline in the actuarial deficit from the level in last year’s report is the improved method used for projecting the other-immigrant population, which, taken alone, reduces the actuarial deficit by about 0.3 percent of taxable payroll.
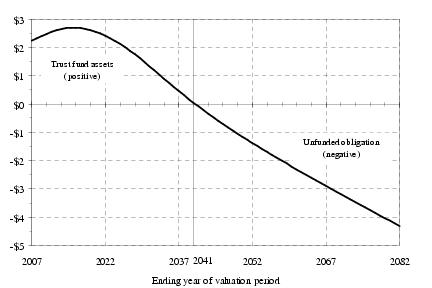
Another way to illustrate the financial shortfall of the OASDI system is to examine the cumulative value of income less cost, in present value. Figure
II.D4 shows the present value of cumulative OASDI income less cost over the next 75 years. The balance of the combined trust funds peaks at $2.7 trillion in 2017 (in present value) and then turns downward. This cumulative amount continues to be positive, indicating trust fund assets, or reserves, through 2040. However, after 2040 this cumulative amount becomes negative, indicating a net unfunded obligation. Through the end of 2082, the combined funds have a present-value unfunded obligation of $4.3 trillion. This unfunded obligation represents 1.6 percent of future taxable payroll and 0.6 percent of future GDP, through the end of the 75-year projection period.
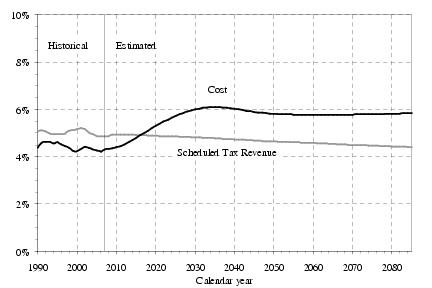
Still another important way to look at Social Security’s future is to view its annual cost and tax income as a share of U.S. economic output. Figure
II.D5 shows that Social Security’s cost as a percentage of GDP is projected to grow from 4.3 percent in 2008 to 6.0 percent in 2030, and then to peak at about 6.1 percent in 2035. Thereafter, OASDI cost as a percent of GDP is projected to decrease to about 5.8 percent by 2050, and to remain at that level through 2082. However, Social Security’s scheduled tax revenue is projected to begin declining within the next 5 years from its current level of about 4.9 percent of GDP reaching about 4.4 percent by 2082. Income from payroll taxes declines generally in relation to GDP in the future because an increasing share of employee compensation is assumed to be provided in fringe benefits, making wages a shrinking share of GDP.
Figures II.D2,
II.D4, and
II.D5 show that the program’s financial condition is worsening at the end of the period. Overemphasis on summary measures for a 75‑year period can lead to incorrect perceptions and to policy prescriptions that do not achieve sustainable solvency. Thus, careful consideration of the trends in annual deficits and unfunded obligations toward the end of the 75-year period is important. In addition, summary measures for a time period that extends to the infinite horizon are included in this report. These measures provide an additional indication of Social Security’s very long-run financial condition, but are subject to much greater uncertainty. These calculations show that extending the horizon beyond 75 years increases the unfunded obligation. Over the infinite horizon, the shortfall (unfunded obligation) is $13.6 trillion in present value, or 3.2 percent of future taxable payroll and 1.1 percent of future GDP. These calculations of the shortfall indicate that much larger changes may be required to achieve solvency beyond the 75-year period as compared to changes needed to balance 75-year period summary measures. The measured unfunded obligation over the infinite horizon is unchanged from $13.6 trillion in last year’s report. In the absence of any changes in assumptions, methods, and starting values, the unfunded obligation over the infinite horizon would have risen to $14.3 trillion due to the change in the valuation date.
This reduction in the unfunded obligation over the infinite horizon is largely the result of the changes in immigration assumptions and methods. Expressed as percentages of taxable payroll and of GDP, however, the measured unfunded obligation over the infinite horizon declined from 3.5 percent and 1.2 percent, respectively in last year’s report.
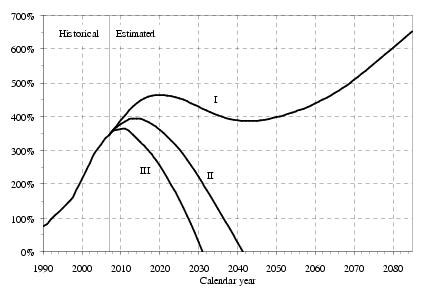
Significant uncertainty surrounds the intermediate assumptions and the Trustees utilize several methods to help illustrate that uncertainty. One approach is the use of low cost (alternative I) and high cost (alternative III) assumptions. Figure
II.D6 shows the projected trust fund ratios for the combined OASI and DI Trust Funds under the intermediate, low cost, and high cost assumptions. The low cost alternative reflects a set of assumptions that improves the projected financial status of the trust funds, relative to the financial status under the intermediate set of assumptions. The low cost alternative includes a higher ultimate total fertility rate, slower improvement in mortality, a higher real-wage differential, and lower unemployment. The high cost alternative, in contrast, includes a lower ultimate total fertility rate, more rapid declines in mortality, a lower real-wage differential, and higher unemployment. These alternatives are not intended to suggest that all parameters would be likely to differ from the intermediate values in the same direction, but are intended to illustrate the effect of scenarios that are, on balance, very favorable or unfavorable for the program’s financial status. The actual outcome for future costs is unlikely to be as extreme as either of the outcomes portrayed by the low and high cost projections. The method for constructing these high and low cost projections does not provide an estimate of the probability that actual experience will lie within or outside the range they define.
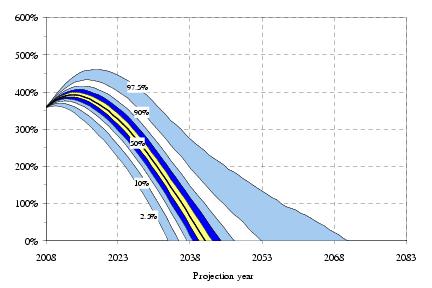
An alternative approach uses stochastic simulations to develop a range of projections and does provide estimates of the probability that future outcomes will fall within or outside a given range. The results of the stochastic simulations, discussed in more detail in Appendix
E, suggest that
trust fund exhaustion is highly probable sometime during the 75-year period (see figure II.D7). Further, the stochastic results suggest that outcomes as good as the low cost alternative or as bad as the high cost alternative are unlikely. However, the relationship between the stochastic results and the high and low cost alternatives may change as the methodology for the stochastic simulations is further developed. As noted in Appendix E, future improvements and refinements are expected to be more likely to expand rather than reduce the indicated range of uncertainty.
The long-range OASDI actuarial deficit of 1.70 percent of taxable payroll for this year’s report is smaller than the deficit of 1.95 percent of taxable payroll shown in last year’s report under intermediate assumptions. Changes in methodology are the main reason for the decrease in the deficit. The most significant methodological change for this report is the introduction of a new approach for projecting other (undocumented and temporary legal) immigration. Changes in several assumptions and recent data had largely offsetting effects. For example, an increase in the assumed level of legal immigration improved the OASDI actuarial balance by 0.07 percent of payroll, but this improvement was offset by other changes in demographic assumptions and starting values. For a detailed description of the specific changes identified in table
II.D2 below, see section
IV.B.7 on page 67.
The open group unfunded obligation over the 75-year projection period has decreased from $4.7 trillion (present discounted value as of January 1, 2007) to $4.3 trillion (present discounted value as of January 1, 2008). The measured unfunded obligation would be expected to increase by about $0.3 trillion due to advancing the valuation date by 1 year and including the additional year 2082. However, changes in methods and assumptions reduced the measured unfunded obligation by about $0.7 trillion, more than fully offsetting the increase that would be expected in the absence of such changes.
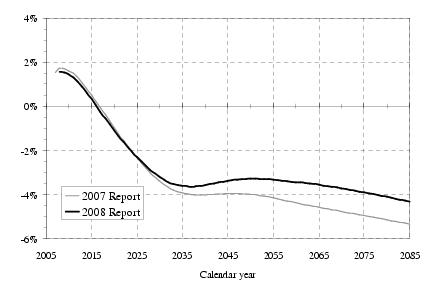
Figure II.D8 shows that this year’s projections of annual balances (non-interest income minus cost) are slightly lower than those in last year’s report through 2024 principally because of lower death rates and recent economic trends. Thereafter, annual balances are somewhat higher for the rest of the long-range projection period mostly due to changes in immigration assumptions and methods. Section
IV.B.7 on page 67 provides a detailed presentation of these changes.