


2002 OASDI Trustees Report |
 |
 |
 |
 |
Short-Range Actuarial Estimates
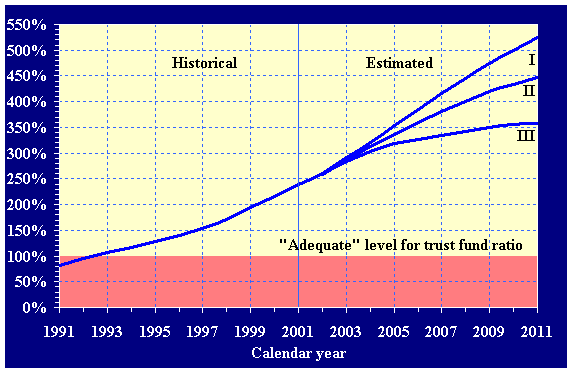
For the short range, the Trustees measure the adequacy of the trust funds by comparing assets at the beginning of each year to projected expenditures for that year under the intermediate set of assumptions. Having a trust fund ratio of 100 percent or more—that is, assets at the beginning of each year at least equal to projected outgo during the year—is considered a good indication of a trust fund's ability to cover most short-term contingencies. Both the OASI and the DI trust fund ratios under the intermediate assumptions exceed 100 percent throughout the short-range period. Therefore, both programs are considered to meet the Trustees' short-term test for financial adequacy. Figure II.D1 below shows the trust fund ratios for the combined OASI and DI Trust Funds under all three sets of assumptions for the next 10 years.
|
During the short-range period, the income, expenditures and assets in dollars of the combined OASI and DI Trust Funds are also of interest and are shown in table II.D1. In addition, the combined trust fund ratios for each year are shown in the table. Additional details on the components of income and outgo, and the results for the individual trust funds are provided in chapter IV.
| |
Calendar year |
|||||||||||
|---|---|---|---|---|---|---|---|---|---|---|---|---|
| $602 |
$624 |
$664 |
$706 |
$752 |
$800 |
$852 |
$904 |
$958 |
$1,014 |
$1,074 |
||
| 439 |
465 |
477 |
499 |
525 |
555 |
587 |
624 |
664 |
708 |
756 |
||
| 163 |
159 |
188 |
207 |
227 |
245 |
264 |
280 |
294 |
305 |
318 |
||
| 1,213 |
1,372 |
1,559 |
1,767 |
1,994 |
2,239 |
2,503 |
2,783 |
3,077 |
3,382 |
3,700 |
||
Trust fund ratio 2
|
239 |
261 |
288 |
312 |
336 |
359 |
381 |
401 |
419 |
434 |
447 |
|
| $602 |
$630 |
$673 |
$718 |
$762 |
$804 |
$850 |
$899 |
$950 |
$1,005 |
$1,063 |
||
| 439 |
464 |
473 |
491 |
512 |
534 |
559 |
586 |
618 |
652 |
688 |
||
| 163 |
166 |
199 |
227 |
250 |
270 |
291 |
312 |
333 |
353 |
375 |
||
| 1,213 |
1,379 |
1,578 |
1,805 |
2,055 |
2,325 |
2,616 |
2,928 |
3,261 |
3,614 |
3,988 |
||
Trust fund ratio 2
|
239 |
261 |
291 |
321 |
353 |
385 |
416 |
446 |
474 |
500 |
525 |
|
| $602 |
$619 |
$662 |
$712 |
$761 |
$812 |
$885 |
$943 |
$999 |
$1,055 |
$1,116 |
||
| 439 |
468 |
482 |
510 |
549 |
598 |
651 |
703 |
756 |
813 |
874 |
||
| 163 |
151 |
180 |
202 |
211 |
214 |
234 |
241 |
243 |
242 |
242 |
||
| 1,213 |
1,363 |
1,544 |
1,746 |
1,957 |
2,171 |
2,405 |
2,646 |
2,889 |
3,131 |
3,373 |
||
Trust fund ratio 2
|
239 |
259 |
283 |
303 |
318 |
327 |
334 |
342 |
350 |
355 |
358 |
|
1 See section IV for more detailed operations of the trust funds. 2 Represents assets at beginning of year (which are identical to assets at end of prior year) as a percentage of expenditures during the year. See text beginning on page 37 concerning interpretation of these ratios. |
Note: Totals do not necessarily equal the sums of rounded components.
Long-Range Actuarial Estimates
The financial status of the trust funds over the next 75 years is measured in terms of the cost and income rates (i.e., costs and income as a percent of taxable payroll), trust fund ratios, and the actuarial balance (also as a percentage of taxable payroll). Considering Social Security's cost as a percent of the total U.S. economy (i.e., gross domestic product or GDP) provides an additional perspective.
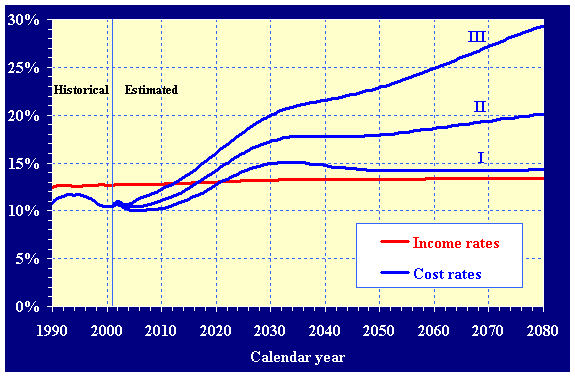
The year-by-year relationship of the income and cost rates shown in figure II.D2 illustrates the expected pattern of cash flow for the OASDI program over the full 75-year period. As the figure shows, the pattern of the OASDI program's estimated cost rate is much different from that of the income rate, which increases only slightly from just under to just over 13 percent during the next 75 years as income from taxation of benefits increases. Only the alternative II income rate is shown graphically because of the small difference among the three alternatives. Under the intermediate assumptions, the OASDI cost rate is estimated to remain fairly stable and well below the income rate for the next several years until about 2010. It then begins to increase rapidly and first exceeds the income rate for 2017, producing cash-flow deficits thereafter. The cost rate continues rising through about 2030 as the baby-boom generation reaches retirement age. Thereafter, the cost rate is estimated to be fairly stable for about 15 years as the baby-boom generation ages and begins to decrease in size. However, by 2076, the projected continued reductions in death rates and relatively low birth rates will cause a significant upward shift in the average age of the population and will push the cost rate to near 20 percent of taxable payroll under the intermediate assumptions. Costs are projected to exceed non-interest income starting in 2017, and annual deficits occur throughout the remainder of the 75-year projection period, reaching more than 6 percent of taxable payroll for 2076. Figure II.D2 shows that the annual deficits are increasing at the end of the projection period. Although the projections in this report do not extend beyond 2080, the upward shift in the average age of the population is likely to continue and to increase the gap between OASDI costs and income.
The OASDI cost rates for alternatives I and III differ significantly from those projected for alternative II but follow generally similar patterns. For alternative I, the cost rate declines somewhat for the first 4 years, and then rises, reaching the current level around 2013. The cost rate first exceeds the income rate for 2021, with relatively small cash-flow deficits thereafter. The cost rate rises to a peak of 15.09 percent of payroll for 2033. The cost rate then declines gradually, reaching a level of 14.24 percent of payroll for 2076. For alternative III, the cost rate rises generally throughout the 75-year period. It rises at a relatively fast pace between 2010 and 2030 because of the aging of the baby-boom generation. The cost rate first exceeds the income rate for 2013, with relatively large cash-flow deficits thereafter. After 2030 the projected cost rate continues rising and reaches 28.51 percent of payroll for 2076.
|
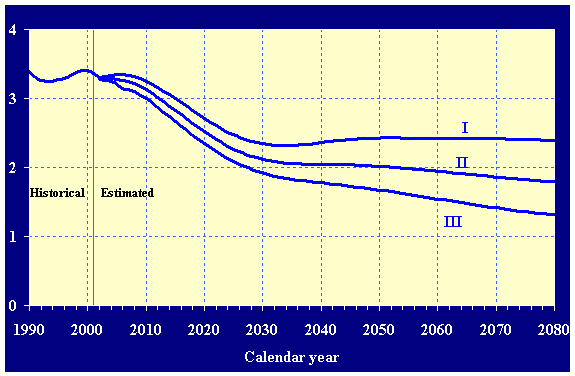
The primary reason that the OASDI cost rate increases rapidly between 2010 and 2030 is that, as the large baby-boom generation born in the years 1946 through 1964 retires, the number of beneficiaries is projected to increase much more rapidly than the number of workers. The estimated number of workers per beneficiary is shown in figure II.D3. In 2001, there were about 3.4 workers for every OASDI beneficiary. By 2010, there are projected to be 3.1 workers per beneficiary, under the intermediate assumptions. The baby-boom generation is fully retired in about 2030 and the projected ratio of workers to beneficiaries is only 2.1. After 2030, the worker-to-beneficiary ratio is relatively stable until about 2050. Thereafter, the number of workers per beneficiary slowly declines, and the cost rate for OASDI slowly increases, due primarily to projected continued reductions in death rates and relatively low birth rates.
|
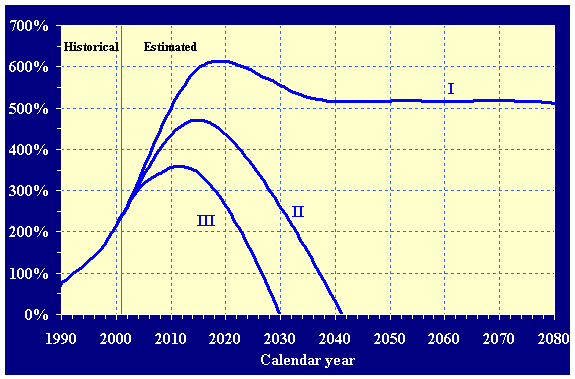
Under the intermediate assumptions, the trust fund ratio for OASDI declines after 2015, due to the demographic changes and resulting rise in costs after 2010. Interest earnings are required to supplement tax income in order to pay benefits beginning in 2017, asset redemptions begin to reduce the size of the combined trust funds in 2027, and the assets of the combined OASI and DI Trust Funds are exhausted in 2041. Table II.D2 shows the maximum projected trust fund ratio of the OASI, DI, and combined funds, and the year it is attained under all three sets of assumptions. It also shows the year each fund's assets are projected to be exhausted.
The trust fund ratios for the combined OASI and DI Trust Funds are shown graphically in figure II.D4.
|
Even if a trust fund's assets are exhausted, tax income will continue to flow into the fund. Table II.D3 shows the relationship between tax revenues and estimated expenditures for the combined trust funds at the time of exhaustion and at the end of the 75-year projection period under intermediate assumptions.
The actuarial balance is a measure of the program's financial status for the 75-year valuation period as a whole. It is essentially the difference between income and cost of the program expressed as a percentage of taxable payroll summarized over the valuation period. As a single number, it provides a summary of the adequacy of program financing for the period as a whole. When the actuarial balance is negative, the actuarial deficit can be interpreted as the percentage that would have to be added to the current law income rate in each of the next 75 years, or subtracted from the cost rate in each year, to bring the funds into actuarial balance. In this report, the actuarial balance under intermediate assumptions is a deficit of 1.87 percent of taxable payroll for the combined OASI and DI Trust Funds. The comparable actuarial deficit number in the 2001 report was 1.86 percent.
Reasons for changes from last year's report to this report in the long-range actuarial balance under the intermediate assumptions are listed in table II.D4 by broad category. Also shown are the estimated effects associated with changes in each category.
| Item |
|||||
|---|---|---|---|---|---|
| 11.68 |
1.90 |
13.58 |
|||
| 13.21 |
2.23 |
15.44 |
|||
| -1.53 |
-.33 |
-1.86 |
|||
| .00 |
.00 |
.00 |
|||
Valuation period 1 |
-.06 |
-.01 |
-.07 |
||
| -.04 |
-.01 |
-.05 |
|||
| +.11 |
+.01 |
+.12 |
|||
| .00 |
+.03 |
+.03 |
|||
| -.01 |
-.03 |
-.04 |
|||
| .00 |
-.01 |
-.01 |
|||
| -1.54 |
-.34 |
-1.87 |
|||
| 11.79 |
1.92 |
13.72 |
|||
| 13.33 |
2.26 |
15.59 |
|||
1 In changing from the valuation period of last year's report, which was 2001-75, to the valuation period of this report, 2002-76, the relatively large negative annual balance for 2076 is included. This results in a larger long-range actuarial deficit. The fund balance at the end of 2001, i.e., at the beginning of the projection period, is included in the 75-year actuarial balance. |
Note: Totals do not necessarily equal the sums of rounded components.
Two laws were enacted since the 2001 report that have negligible long-range financial effects on the OASDI program. A number of changes in assumptions had significant effects on the actuarial balance. These changes were made based on recent data for birth rates, death rates, immigration, average earnings, and disability experience. In addition, several methodological changes had effects on the actuarial balance. More detail on these changes is presented in sections IV.A.4, IV.B.7 and chapter V of this report.
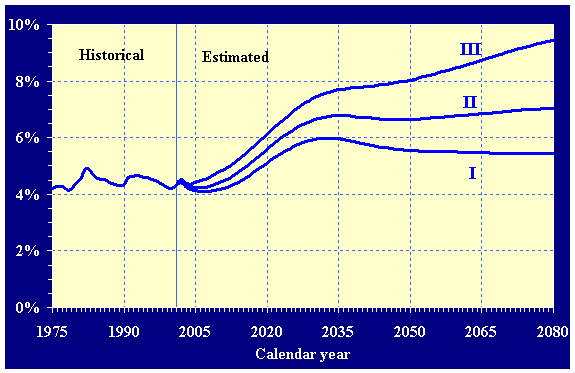
The cost of Social Security as a percentage of GDP, shown graphically in figure II.D5, follows the same upward pattern as the cost rate discussed earlier for the same reasons, primarily the retirement of the baby-boom generation from 2010 to 2030 and the projected reductions in death rates and relatively low birth rates thereafter. Today, the cost of Social Security is 4.5 percent of GDP, but that cost is projected under the intermediate assumptions to increase to 7.0 percent of GDP by 2076.
|
 |
 |
 |
 |
| |
Privacy Policy | Website Policies & Other Important Information | Site Map | Actuarial Publications | 3/26/2002 |