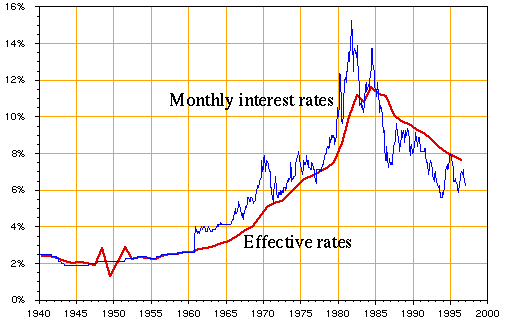
and monthly new-issue rates, calendar years 1940-96
| ACTUARIAL NOTE | |
| Number 138 | SOCIAL SECURITY ADMINISTRATION |
| October 1997 | Office of the Chief Actuary |
This Note presents estimates of the effective annual interest rates earned by the assets of the Old-Age and Survivors Insurance (OASI) and Disability Insurance (DI) Trust Funds for the years 1940-96. Actuarial Note 123, published November 1984, presented such interest rates through 1983. That publication described an improved methodology for estimating effective interest rates, and the current Note continues that methodology through 1988. After 1988, this Note employs a new methodology to accurately calculate the rates. Much of the material from Actuarial Note 123 is still relevant today and is repeated here to provide the reader with an understanding of the history and nature of trust fund investments.
An accurate measure of the annual interest rates earned by the OASI and DI Trust Funds is important for several reasons. First, the investment performance of the trust funds receives considerable attention even though interest earnings represent only a small, but growing, portion of total income.1 (In 1981, income from investments was approximately 1.6 percent of total income, while in 1996, this percentage had grown to 9.1 percent.) Effective annual interest rates serve as a convenient measure of the overall return on invested assets. Second, the effective annual rates are useful in estimating certain interest adjustments on various financial transfers among the Social Security and Medicare trust funds or between a trust fund and the general fund of the Treasury. Similarly, the Railroad Retirement Board uses the rates in the determination of the amount of the annual financial interchange between the trust funds and the Railroad Retirement Account. Third, the effective annual OASDI rates are needed to evaluate various modifications to trust fund investment procedures that are proposed from time to time. Finally, it can be informative to compare the annual effective interest rates earned by the OASI and DI Trust Funds with the rates earned by life insurance companies.
The current methodology used in calculating the effective yields presented in this Note for years after 1988 is more refined than previous methods used by the Office of the Chief Actuary. The methodology relies on daily investment transaction data provided by the Department of the Treasury to calculate the effective interest rates. For years before 1989, a methodology utilizing detailed monthly trust fund cash-flow data was used to estimate the rates. (The monthly statements were also provided by the Department of the Treasury.) The new methodology will be discussed in more detail later in this Note.
Trust Fund Investments and Procedures
By law, the investment of the assets of the OASI and DI Trust Funds is the responsibility of the Secretary of the Treasury as the Managing Trustee of the Social Security Trust Funds. Any income to the trust funds, from payroll taxes or other sources, that is not immediately needed to meet benefit obligations and administrative expenses, is invested in interest-bearing obligations of the Federal Government. These obligations have generally been of two types: "special-issue" securities and regular government obligations.
The bulk of the combined OASI and DI portfolio has been invested in securities available only to the trust funds. These securities, called special issues, consist of short-term certificates of indebtedness and longer-term bonds. The certificates of indebtedness mature on the June 30 following the date of issue, while the bonds have maturity dates of June 30 from 1 to 15 years in the future. Special issues are redeemable by the Treasury any time prior to maturity at par value (their purchase price) plus accrued interest. Thus return of principal is guaranteed, since fluctuating market interest rates do not affect the redemption amount, either up or down. This feature is of particular significance because special issues must be redeemed frequently, often daily, before maturity to meet benefit and expense obligations.
Each special issue pays interest in the form of semiannual coupons at an interest rate determined by a specific formula. This formula has undergone several modifications through the years. Since October 1960, the formula has defined the rate for new issues as the average market yield on all marketable government obligations that are not due or callable for a least 4 years from the date of determination. The rate is calculated at the beginning of each month based on the market yields at the end of the previous month. That rate then applies to all new special issues purchased by the trust funds during the current month.
The trust funds are also permitted to invest in regular government obligations bought, at time of issue or after issue, on the open market. These marketable securities have generally been long-term Treasury bonds, although certain quasi-government securities issued by federally sponsored organizations (such as the Federal National Mortgage Association and the Government National Mortgage Association) can also be purchased by the trust funds. Marketable securities held by the trust funds can be sold on the open market at any time for the current market price. (However, such securities have normally been purchased with the intention of being held to maturity and not being actively traded.) Thus, unlike the redemption of special issues, it is possible for the trust funds to realize a capital gain or loss upon the sale of marketable securities prior to maturity.
The daily excess of trust fund receipts over disbursements is invested immediately in certificates of indebtedness. Each June 30 (the certificate maturity date), any such certificates that have not been redeemed prior to maturity are rolled over into the longer-term special-issue bonds, also with maturity dates of June 30 but in future years. The maturity dates on the new bonds vary from 1 to 15 years with the durations generally being distributed so that approximately 1/15 of all special-issues held by each trust fund will mature each year. Note that this investment goal is not attainable when disbursements exceed income for prolonged periods, since the trust funds are then forced to disinvest some of the special-issue bonds prior to maturity without being able to replace them on June 30.
The marketable securities generally do not have June 30 maturity dates; consequently, they are rolled over as they mature into certificates of indebtedness or other marketable securities, depending on the expected cash-flow needs of the trust funds. Marketable securities have not been purchased since 1980 and are not expected to be purchased in the foreseeable future.
Most of the interest income from investments is received semiannually on June 30 and December 31. This is because the special issues, which have historically comprised the majority of the combined OASI and DI portfolio, pay their interest-bearing coupons on these dates. Interest is also received when the trust funds must disinvest special issues in order to pay benefits and other expenses. At these times, the interest received is that amount accrued from the later of (1) the purchase date or, (2) the last coupon date, to the redemption date. Interest from marketable securities is also generally received on dates other than June 30 and December 31. However, these amounts have been relatively small, since the marketables have historically represented a small portion of the portfolio.2
A specific procedure is generally followed by the Managing Trustee for the disinvestment of securities prior to maturity. Special-issue securities due to mature on the following June 30 are redeemed first. Issues with the lowest interest rates are redeemed before those with higher rates. When longer-term special-issue bonds are redeemed, those bonds with the shortest duration of maturity are redeemed first and bonds with the same duration to maturity are redeemed in order of ascending yield. Finally, if still more funds are required after the special issues have been exhausted, as was the case for the OASI Trust Fund in November and December of 1982, any marketable securities would be sold.
Interest on Investments
The effective annual interest rates were calculated by relating interest on investments to invested assets, where interest on investments is composed of: (1) the coupons paid by the special issues and the marketable securities, (2) the accrued interest received at times other than coupon dates when securities are redeemed to meet disbursements, and (3) the amortization of the premiums or discounts of any marketable securities purchased on the open market after their initial issuance. Premium or discount arises when marketable securities are traded on the open market, subsequent to initial issue, at prices above or below par. Amounts above par are known as premiums and result in offsets to investment income during the life of the security, while amounts below par are known as discounts and result in additional investment income. Recognition should be given to these gains and losses, since purchases made at premium or discount are planned in such a way that the total yield on the security (assuming it is held to maturity) will closely approximate prevailing interest rates on new securities. In effect, the amortization amounts are equivalent to interest earnings and should be considered part of the planned investment strategy of the Treasury Department with respect to the trust funds. Here the term amortization refers to the spreading of the gains or losses uniformly over the duration of the security assuming that it will be held full term to maturity. Historically, these amortized amounts have had a very small effect on the yearly investment earnings of the trust funds.
Certain amounts of interest received by the trust funds are not considered as earnings on invested assets. Excluded interest items are the interest-adjustment amounts that comprise part of the various transfers between the general fund of the Treasury and the trust funds or among the trust funds. The interest adjustments that are included as part of the transfers are not considered interest on invested assets; rather, they are adjustments to restore the trust funds to the theoretical financial position in which they otherwise would have been.
Finally, to be consistent with the objective of measuring the effective annual interest rate earned by the trust funds, it was decided that investment interest should not reflect realized capital gains and losses on the unplanned sale of marketables prior to maturity. In particular, the capital losses experienced by the OASI Trust Fund in 1982 are not reflected in the interest rate for 1982 because they resulted from forced sales that were not part of the planned investment strategy of the Treasury and, therefore, are considered as extraordinary items. Such losses would usually be considered as negative investment income in an evaluation of overall investment performance, rather than just interest earnings, but such a measurement is not the goal of this Note.
General Description of the Methodology
The concept of an effective interest rate for a fund can be stated as follows. The effective rate is the amount of interest earned during a period divided by the average level of assets during the period. In the case of the OASI and DI Trust Funds, the numerator (the amount of interest) is provided monthly by the Department of the Treasury. Calculating the average level of the assets of the trust funds, however, has proved more difficult.
The assets of the trust funds change daily, as income is received and expenditures are made. Prior to 1989, a record of the daily transactions of the trust funds was not readily available. Thus, the methodology for 1988 and prior utilized a monthly summary of trust fund activity. Daily levels of invested assets were approximated from the monthly figures by making assumptions about the average timing of the various cash-flow transactions within the month. Details concerning the pre-1989 methodology may be found in Actuarial Note 123.
With the availability of daily investment data, daily levels of invested assets no longer had to be approximated but could, instead, be directly calculated from the data. Calculation of the denominator for the effective interest rate -- the average level of assets, or "exposure" -- proceeds as follows.
Because interest is paid at the end of June and December, exposure is calculated separately for each calendar half. In general, exposure is the cumulative sum of assets at the beginning of the period and net daily investment amounts, each weighted by the fraction of the half year remaining.
Specifically, the beginning amount is the total amount of invested assets (face value) after a semiannual interest payment date (June 30 or December 31). The exposure after n days, , is equal to plus a certain fraction of the net surplus on day n. This fraction is equal to the number of days remaining in the half year divided by the total number of days in the half year. The net surplus is income minus expenditures3. The exposure used in the effective rate calculation is the exposure , at the end of the half year, where m is the number of days in the half year.
The effective rate for a year is then computed by the following formula. If equals the exposure for the first half of the year and equals the exposure for the second half, then the effective rate r for the year is given by the formula
where I is the interest earned during the year. To express the rate as a percent, r would then be multiplied by 100. This formula was used to calculate effective rates for all years shown in this Note. Only the method for calculating exposure for years after 1988 differs from that described in Actuarial Note 123.
Note that although exposure was calculated for a half year, no corresponding semiannual effective rate need be calculated. Such semiannual rates could, of course, be calculated as , where and are the half-year interest and exposure amounts, respectively. The effective rate for the year could then be calculated by compounding and . Doing so, however, would give equal weight to the semiannual rates, even though the interest and exposure for one half year might differ significantly from that of the other. By combining the interest and exposure amounts as shown in the formula, appropriate weights are automatically given to the semiannual parts.
Effective Annual Interest Rates
Table 1 presents the effective annual rates of interest for the OASI, DI, and combined OASDI Trust Funds by single years on a calendar-year basis. Figure 1 shows the graphs of the effective annual OASDI rates and the monthly new-issue rates. For the years 1940-60, the effective rate curve remains relatively flat except for the sharp variations in 1948, 1949, and 1951. These spikes result from the fact that in calendar years 1948 through 1951, interest accrued does not match interest credited (apparently due to late payment of interest amounts by the Department of the Treasury). This results in an overstatement of the effective interest rates in 1948 and 1951 and an understatement in the rate for 1949.
| Year | OASI | DI | OASDI | Year | OASI | DI | OASDI |
| 1940 | 2.385 | -- | 2.385 | 1970 | 4.956 | 5.833 | 5.074 |
| 1941 | 2.363 | -- | 2.363 | 1971 | 5.154 | 5.991 | 5.286 |
| 1942 | 2.261 | -- | 2.261 | 1972 | 5.287 | 5.989 | 5.406 |
| 1943 | 2.089 | -- | 2.089 | 1973 | 5.663 | 6.177 | 5.754 |
| 1944 | 1.983 | -- | 1.983 | 1974 | 6.156 | 6.499 | 6.218 |
| 1945 | 2.057 | -- | 2.057 | 1975 | 6.565 | 6.730 | 6.593 |
| 1946 | 2.002 | -- | 2.002 | 1976 | 6.727 | 6.757 | 6.731 |
| 1947 | 1.884 | -- | 1.884 | 1977 | 6.936 | 7.119 | 6.958 |
| 1948 | 2.832 | -- | 2.832 | 1978 | 7.166 | 7.468 | 7.199 |
| 1949 | 1.299 | -- | 1.299 | 1979 | 7.444 | 7.953 | 7.524 |
| 1950 | 2.018 | -- | 2.018 | 1980 | 8.510 | 8.797 | 8.568 |
| 1951 | 2.888 | -- | 2.888 | 1981 | 9.924 | 10.104 | 9.947 |
| 1952 | 2.240 | -- | 2.240 | 1982 | 10.851 | 11.944 | 11.178 |
| 1953 | 2.310 | -- | 2.310 | 1983 | 10.858 | 10.367 | 10.768 |
| 1954 | 2.296 | -- | 2.296 | 1984 | 11.788 | 10.699 | 11.601 |
| 1955 | 2.198 | -- | 2.198 | 1985 | 11.349 | 10.553 | 11.213 |
| 1956 | 2.401 | -- | 2.401 | 1986 | 11.342 | 10.053 | 11.091 |
| 1957 | 2.494 | 2.315 | 2.492 | 1987 | 10.118 | 9.684 | 10.063 |
| 1958 | 2.520 | 2.435 | 2.516 | 1988 | 9.786 | 9.613 | 9.773 |
| 1959 | 2.584 | 2.505 | 2.578 | 1989 | 9.570 | 9.612 | 9.572 |
| 1960 | 2.595 | 2.623 | 2.598 | 1990 | 9.319 | 9.418 | 9.324 |
| 1961 | 2.744 | 2.852 | 2.755 | 1991 | 9.085 | 9.184 | 9.090 |
| 1962 | 2.813 | 2.922 | 2.825 | 1992 | 8.738 | 8.903 | 8.744 |
| 1963 | 2.913 | 3.001 | 2.923 | 1993 | 8.314 | 8.600 | 8.322 |
| 1964 | 3.075 | 3.159 | 3.084 | 1994 | 8.035 | 8.220 | 8.040 |
| 1965 | 3.168 | 3.351 | 3.184 | 1995 | 7.880 | 7.360 | 7.846 |
| 1966 | 3.462 | 3.727 | 3.483 | 1996 | 7.684 | 6.881 | 7.615 |
| 1967 | 3.720 | 4.134 | 3.753 | ||||
| 1968 | 3.907 | 4.381 | 3.950 | ||||
| 1969 | 4.351 | 5.099 | 4.437 | ||||
Note: The DI program began in 1957. | |||||||
Although both the OASI and DI Trust Funds purchase new special issues at about the same time and at exactly the same new-issue rates, the effective annual rates will differ for each trust fund. This result occurs because each trust fund has different amounts of new securities with different maturity dates. Thus, on a given day the investment mix of each portfolio by yield and duration will normally be quite different. Because the effective interest rate measures, essentially, an average rate of interest for all securities in a portfolio, the different composition of assets leads to different effective interest rates.
The OASDI portfolio contains, in addition to special issues at the recent new issue rate, older securities which were purchased at new-issue rates prevailing in the past and which have not yet been redeemed. As these older securities are disinvested and are replaced by newer securities at current rates, the effective interest rate of the combined OASDI portfolio will tend to follow the trend of the new-issue rates. Figure 1 illustrates the tendency of the effective rates to follow the trend of the new-issue rates. Table 2 compares the effective annual interest rates for OASDI with the annual average of the monthly interest rates on new issues.
|
Figure 1.-OASDI effective annual interest rates and monthly new-issue rates, calendar years 1940-96 |
|
|
Until the current method for determining the new-issue rate went into effect in October 1960, both the monthly new-issue rates and the effective annual rates were under 3 percent and were relatively flat. Then the new-issue rate jumped 1 percentage point from September to October 1960, from 2.625 percent to 3.625 percent. This accounts for the abrupt jump in the graph of the monthly rates at that time.
From 1960 through 1984, both curves trend upward. During this period, the monthly new-issue rates generally exceed, and the average annual new-issue rates consistently exceed, the effective annual rates. The effective portfolio rate tended to follow the upward path of the new-issue rate as the portfolio gradually lost older lower-interest securities and acquired newer higher-interest rates. More recently, the effective annual rate exceeded the new-issue rate and tended to follow its downward trend.
| Year | OASDI effective annual rate | Average annual new-issue rate | Difference |
| 1940 | 2.385 | 2.500 | -0.115 |
| 1945 | 2.057 | 1.875 | 0.182 |
| 1950 | 2.018 | 2.125 | -0.107 |
| 1955 | 2.198 | 2.292 | -0.094 |
| 1960 | 2.598 | 2.917 | -0.319 |
| 1965 | 3.184 | 4.198 | -1.014 |
| 1970 | 5.074 | 7.260 | -2.186 |
| 1971 | 5.286 | 5.979 | -0.693 |
| 1972 | 5.406 | 5.927 | -0.521 |
| 1973 | 5.754 | 6.646 | -0.892 |
| 1974 | 6.218 | 7.490 | -1.272 |
| 1975 | 6.593 | 7.396 | -0.803 |
| 1976 | 6.731 | 7.146 | -0.415 |
| 1977 | 6.958 | 7.083 | -0.125 |
| 1978 | 7.199 | 8.198 | -0.999 |
| 1979 | 7.524 | 9.115 | -1.591 |
| 1980 | 8.568 | 11.000 | -2.432 |
| 1981 | 9.947 | 13.333 | -3.386 |
| 1982 | 11.178 | 12.781 | -1.603 |
| 1983 | 10.768 | 11.031 | -0.263 |
| 1984 | 11.601 | 12.396 | -0.795 |
| 1985 | 11.213 | 10.781 | 0.432 |
| 1986 | 11.091 | 7.990 | 3.101 |
| 1987 | 10.063 | 8.396 | 1.667 |
| 1988 | 9.773 | 8.823 | 0.950 |
| 1989 | 9.572 | 8.656 | 0.916 |
| 1990 | 9.324 | 8.625 | 0.699 |
| 1991 | 9.090 | 7.958 | 1.132 |
| 1992 | 8.744 | 7.083 | 1.661 |
| 1993 | 8.322 | 6.063 | 2.260 |
| 1994 | 8.040 | 7.052 | 0.988 |
| 1995 | 7.846 | 6.875 | 0.971 |
| 1996 | 7.615 | 6.594 | 1.021 |
The investment performance of the combined OASI and DI Trust Funds has been criticized occasionally as a result of comparisons with the investment yields of privately-managed money funds. Many of the comparisons are inappropriate because they contrast the effective rate earned by the combined OASI and DI portfolio with the current market yield on new public and private issues. As discussed above, in times of rising interest rates, the average yield on the "mature" portfolio would be lower than the rates for new securities. Under such circumstances, conclusions regarding the investment performance of the trust funds must be carefully drawn. A more meaningful comparison would involve the new-issue rate on trust fund securities versus the market yield on new public and private issues. Alternatively, the effective rate earned by trust fund assets could be compared to the effective interest rates on other portfolios with similar time horizons.
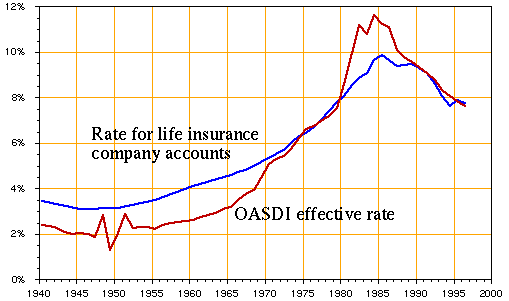
Table 3 compares the effective annual interest rates for the combined OASI and DI Trust Funds with the effective annual interest rates for life insurance company general accounts. Figure 2 shows the comparison graphically. In most years, the life insurance company rates exceed the OASDI rates, although by 1970, the differential is very small. This difference reflects the different types of investments held by the trust funds, as compared to those held by insurance companies. The latter are comprised largely of corporate bonds, some stocks, mortgage loans, and rental properties. These types of investments carry a greater yield in compensation for the greater risk involved. Beginning in 1980, however, the OASDI rates exceed the life insurance company rates; and by 1982, this difference has grown to about 2 percent. Once again, any conclusions must be drawn carefully. In this instance, the more favorable results for the trust funds reflect the rapid diminution in the level of assets held by the trust funds. As the funds were drawn down, they quickly became comprised of recent higher-interest issues only. The insurance company reserves, however, were not similarly depleted and so continued to hold a greater proportion of older, lower-interest securities.
| Year | OASDI effective rate | Average rate for life insurance company accounts | Difference |
| 1940 | 2.39 | 3.45 | -1.06 |
| 1945 | 2.06 | 3.11 | -1.05 |
| 1950 | 2.02 | 3.13 | -1.11 |
| 1955 | 2.20 | 3.51 | -1.31 |
| 1960 | 2.60 | 4.11 | -1.51 |
| 1965 | 3.18 | 4.61 | -1.43 |
| 1970 | 5.07 | 5.34 | -0.27 |
| 1971 | 5.29 | 5.52 | -0.23 |
| 1972 | 5.41 | 5.69 | -0.28 |
| 1973 | 5.75 | 6.00 | -0.25 |
| 1974 | 6.22 | 6.31 | -0.09 |
| 1975 | 6.59 | 6.44 | 0.15 |
| 1976 | 6.73 | 6.68 | 0.05 |
| 1977 | 6.96 | 7.00 | -0.04 |
| 1978 | 7.20 | 7.39 | -0.19 |
| 1979 | 7.52 | 7.78 | -0.26 |
| 1980 | 8.57 | 8.06 | 0.51 |
| 1981 | 9.95 | 8.53 | 1.42 |
| 1982 | 11.18 | 8.87 | 2.31 |
| 1983 | 10.77 | 9.08 | 1.69 |
| 1984 | 11.60 | 9.65 | 1.95 |
| 1985 | 11.21 | 9.87 | 1.34 |
| 1986 | 11.09 | 9.64 | 1.45 |
| 1987 | 10.06 | 9.39 | 0.67 |
| 1988 | 9.77 | 9.41 | 0.36 |
| 1989 | 9.57 | 9.47 | 0.10 |
| 1990 | 9.32 | 9.31 | 0.01 |
| 1991 | 9.09 | 9.09 | 0.00 |
| 1992 | 8.74 | 8.58 | 0.16 |
| 1993 | 8.32 | 8.07 | 0.25 |
| 1994 | 8.04 | 7.63 | 0.41 |
| 1995 | 7.85 | 7.90 | -0.05 |
| 1996 | 7.61 | 7.75 | -0.14 |
| Figure 2.-OASDI effective interest rates and the average annual interest rates for life insurance company general accounts, calendar years 1940-96 |
|
Summary and Conclusions
Despite the relatively minor role played by interest earnings in the financing of the OASDI program, it is important to have an accurate measure of the interest rate earned on the invested assets of the OASI and DI Trust Funds. The new methodology introduced in this Note to calculate more recent effective annual rates utilizes daily investment transaction data to calculate the average daily level of trust fund assets. The resultant effective rates are more accurate than estimates for earlier years. Comparisons of interest rates earned by different portfolios should properly reflect any differences in maturities, types of investments, and cash-flow circumstances.