Figure I.H1.OASDI Income Rates and Cost Rates
[As a percentage of taxable payroll]
Each year estimates of the financial and actuarial status of the OASDI program are prepared for the next 75 years. Although financial estimates for periods as long as 75 years are inherently uncertain, the results can provide valuable information for use by policymakers. In particular, such estimates can indicate whether the program -- as seen from today's vantage point -- is considered to be in satisfactory financial condition.
As mentioned previously, a number of different measures are useful in evaluating the financial status of the trust funds over the next 75 years. In addition to the actuarial balance and the trust fund ratio, emphasis is placed on the relationship between the levels of future tax income and future expenditures for each year (relative to the amount of earnings subject to the OASDI payroll tax). The year-by-year patterns of this relationship are of particular interest.
In addition to the presentation of long-range estimates, a specific test of the program's long-range financial status is applied. This test is referred to as the test for long-range "close actuarial balance."
1. Annual Income Rates, Cost Rates, and Balances
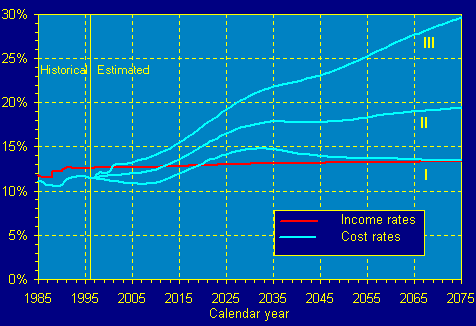
Figure I.H1 compares past and estimated
future OASDI income (from
payroll taxes on covered earnings and income taxes on OASDI benefits)
with OASDI expenditures (for benefits and administrative
expenses). Included are historical data for the past 12 calendar years
(1985-96) and estimates for the 75-year long-range projection period
(1997-2071) under the three alternative sets of assumptions. These
income and expenditure amounts are shown relative to the earnings
in covered employment that are taxable under the OASDI program -- referred
to as "taxable payroll." The ratio of tax income (including
both payroll taxes and income from taxation of benefits) to taxable
payroll is called the "income rate" and the ratio of expenditures to
taxable payroll is the "cost rate."
Figure I.H1.OASDI Income Rates and Cost Rates[As a percentage of taxable payroll] |

|
For calendar year 1997, the income rate for the OASDI program is
estimated to be about 12.63 percent of taxable payroll. This rate is
made up of the combined tax rate payable by employees and employers,
12.40 percent, plus the revenue from the income taxation of
OASDI benefits, equivalent to 0.23 percent of taxable payroll. Since
OASDI payroll tax rates are not scheduled to change in the future
under present law, payroll tax income as a percentage of taxable payroll
remains constant at about 12.40 percent. Income from the taxation of benefits
will gradually increase, primarily because a greater
proportion of benefits will become subject to taxation. Thus, the
income rate is projected to increase somewhat from its current level,
reaching about 13.33 percent of taxable payroll by the year 2071. The
income rate projection shown in figure I.H1
is based on the intermediate set of assumptions (alternative II) only; the
projections under the
low cost and high cost sets of assumptions (alternatives I and III,
respectively) are very similar.
As figure I.H1 indicates, the pattern followed by the estimated cost rates is much different. Costs as a percentage of taxable payroll are estimated to rise slowly for about 13 years (or to decline slowly, in the case of alternative I) and then to increase rapidly for about the next 20 years. Thereafter, cost rates are estimated to grow less rapidly (or to decline somewhat, in the case of alternative I). By the year 2071 the cost rate is estimated to have reached 13.45 percent, 19.23 percent, and 28.91 percent under alternatives I, II, and III, respectively.
The primary reason that the estimated OASDI cost rate increases rapidly after about 2010 is that the number of beneficiaries is projected to increase more rapidly than the number of covered workers. Because the cost rate expresses expenditures (primarily payments to beneficiaries) as a percentage of taxable payroll (the taxable earnings of covered workers), there is a close relationship between the demographic characteristics of the population and the OASDI cost rate.
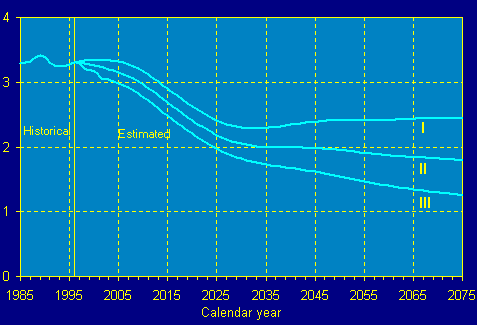
Figure I.H2 shows the estimated number of covered
workers per
OASDI beneficiary. In 1996, there were about 3.3 workers for every
beneficiary. As indicated, this ratio is expected to decline substantially
in the future under all three sets of assumptions. The most rapid
decline will occur as the relatively large number of persons born during the
"baby boom" (from the end of World War II through the mid-1960s)
reaches retirement age and begins to receive benefits. At the
same time, the relatively small number of persons born during the
subsequent period of low fertility rates will comprise the labor force.
Between 2030 and 2050, the number of workers per beneficiary is relatively
stable as the "baby-boom" generation diminishes in size. After
the year 2050, this ratio will continue to decline at a slower pace for
the intermediate and high cost projections, reflecting the increasing
numbers of beneficiaries due to assumed increases in life expectancy.
Based on the low cost assumptions, a slow increase in this ratio is projected
to occur after 2050. By the end of the 75-year projection period,
the number of workers per beneficiary is projected to decline to 2.4,
1.8, and 1.3 under the low cost (alternative I), intermediate (alternative II),
and high cost (alternative III) assumptions, respectively.
Figure I.H2.Number of Workers Per Beneficiary |

|
The difference between the income rate and the cost rate in a given
year is referred to as the "annual balance" for that year. The estimated
pattern of the OASDI annual balance depends significantly on
the economic and demographic conditions assumed to occur in the
future. Income rates are estimated to exceed cost rates until 2019,
2012, and 2001, under alternatives I, II, and III, respectively, resulting
in positive annual balances. Thereafter, under the intermediate
assumptions, the annual deficit would rise rapidly, reaching 4.38 percent
of taxable payroll by 2030 and 5.90 percent in the year 2071.
Under alternative I, a temporary period of deficits in excess of 1 percent
of taxable payroll (from 2024 through 2043) would be followed by
a return to relatively small deficits lasting throughout the remainder
of the projection period. Under adverse conditions, as assumed in
alternative III, the deficit would grow very rapidly, to over 15 percent
of taxable payroll by the year 2071.
2. Summarized Income Rates, Cost Rates, and Balances
It is useful to consider the income and cost rates on a summarized
basis over the three 25-year subperiods that make up the 75-year projection
period. For this purpose, the annual income rates are summarized by
calculating the present value of future tax income for the
subperiod in question, and expressing it as a percentage of the
present value of future taxable payroll for that subperiod. ("Present
values" are used in financial analysis to calculate the lump-sum
equivalent value, at a particular point in time, of a series of future
amounts or transactions. See the Glossary for additional information.)
Similarly, a summarized cost rate is calculated, based on the present
value of future expenditures as a percentage of the present value of
future taxable payroll. The following table shows these summarized
amounts for the OASDI program for the three 25-year subperiods.
Table I.H1. OASDI Income and Cost Rates for 25-Year Subperiods | |||
| Income rate |
Cost rate |
Balance | |
| Intermediate: | |||
| 1997-2021 | 12.72 | 12.76 | -0.04 |
| 2022-2046 | 13.08 | 17.41 | -4.33 |
| 2047-2071 | 13.24 | 18.62 | -5.38 |
| Low Cost: | |||
| 1997-2021 | 12.68 | 11.55 | 1.13 |
| 2022-2046 | 12.95 | 14.42 | -1.47 |
| 2047-2071 | 13.01 | 13.74 | -.73 |
| High Cost: | |||
| 1997-2021 | 12.77 | 14.17 | -1.41 |
| 2022-2046 | 13.26 | 21.20 | -7.95 |
|
2047-2071 |
13.61 |
26.14 |
-12.52 |
A small deficit is shown under the intermediate alternative II
assumptions for the first subperiod; thereafter, the program is projected
to experience substantial deficits, for the reasons outlined previously. Under
the low cost alternative I assumptions, summarized
tax income would exceed summarized costs for the first 25-year subperiod only,
with deficits diminishing to relatively low levels in the
third subperiod. (The less favorable outlook for the second subperiod
occurs under the low cost assumptions because the "baby-boom" generation is
retired essentially throughout this period, while the
assumed higher ultimate fertility rates have not yet had their full
effect on the estimated numbers of workers.) If the high cost conditions of
alternative III are experienced, substantial deficits would
occur for all three subperiods.
To assess the overall financial balance for the long range, it is customary to
calculate summarized income rates and cost rates for the full
75-year valuation period. For this purpose, summarized income and
cost rates are calculated on a present-value basis, as before. In addition,
the summarized income rate is augmented by the value of trust
fund assets on hand at the beginning of the period. Similarly, the
summarized cost rate is adjusted to include the additional cost of
accumulating trust fund assets at the end of the period equal to 100
percent of the following year's expenditures. The results of this
calculation are shown in the following table.
Table I.H2. OASDI Income and Cost Rates for 75-Year Valuation Period | |||
| Income rate |
Cost rate |
Balance | |
| Intermediate: | |||
| 1997-2071 | 13.37 | 15.60 | -2.23 |
| Low Cost: | |||
| 1997-2071 | 13.25 | 13.03 | .21 |
| High Cost: | |||
|
1997-2071 |
13.53 |
19.07 |
-5.54 |
The difference between the summarized income and cost rates for the
75-year valuation period is called the "actuarial balance" and ranges
from a surplus of 0.21 percent of taxable payroll under the low cost
assumptions to a deficit of 5.54 percent under the high cost assumptions.
Based on the intermediate assumptions, an actuarial deficit of
2.23 percent is projected, representing the difference between the
summarized income rate of 13.37 percent and the corresponding cost
rate of 15.60 percent.
The estimated actuarial deficit is slightly larger than the corresponding deficit of 2.19 percent of payroll in last year's report. If the only change for this year's report were to change the long-range valuation period from 1996-2070 to 1997-2071, the deficit for this year's report would have risen to 2.27 percent of payroll. However, there were a number of other changes that, in net, partially offset the effect of the change in valuation period. See section II.F2g for complete details on the change in actuarial balance from last year's report.
The size of the actuarial balance for any valuation period represents a measure of the program's financial adequacy for that period. The actuarial balance can be interpreted as the amount of change which, if made to the payroll tax rates scheduled under present law for each year in the period, would bring the program into exact actuarial balance. For example, if the 75-year actuarial deficit of 2.23 percent under intermediate assumptions were addressed by raising scheduled tax rates by 1.12 percent for employees and employers, each, and by 2.24 percent for the self-employed, then OASDI assets at the beginning of 1997, together with income from payroll taxes, interest, and other sources, would be just sufficient to meet all expenditures for the period and leave a trust fund level at the end of the period equal to about 100 percent of the following year's expenditures. Of course, there are numerous other changes to tax rates or benefit provisions that could also result in the elimination of the long-range actuarial deficit.
The 75-year actuarial balance is a convenient and widely used measure of the OASDI program's overall financial status. It is important to remember, however, that this summary measure reflects the combined effects of several very different periods, as previously described. Thus, while the use of summary measures such as the actuarial balance is often convenient, such measures should not be used as a substitute for a more complete understanding of the underlying year-by-year outlook.
3. Trust Fund Ratios
As noted previously, the total income of the OASDI program currently
exceeds total expenditures by a substantial margin. As a result, the
assets of the combined trust funds are increasing rapidly. Under the
intermediate alternative II assumptions, tax income is expected to
exceed expenditures until 2012, when the cost of the program will
have started to increase with the retirement of the "baby-boom" generation.
From that point on the tax rates scheduled in present law are
expected to be insufficient to cover program expenditures and it will
be necessary to use interest earned by the combined OASI and DI
Trust Funds to make up the shortfall. Total income, including interest
earnings, is expected to exceed expenditures through about 2018.
Thereafter, it will be necessary to redeem assets to make up the shortfall.
If no corrective action were taken, trust fund assets would be
exhausted by the end of 2029, after which full benefits would not be
payable on a timely basis. The resulting pattern of combined OASI
and DI assets, expressed as a percentage of annual expenditures, is
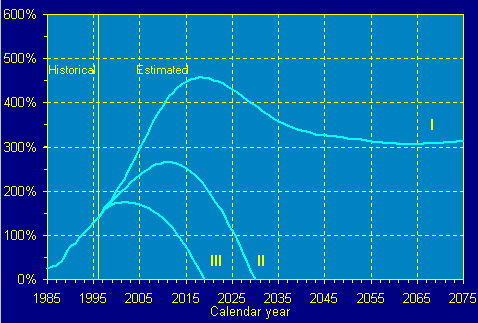
illustrated in figure I.H3 under each of the
three alternative sets of
assumptions.
At the beginning of 1997, the combined assets of the OASI and DI
Trust Funds represented about 153 percent of combined annual
expenditures estimated for the year. Based on the intermediate
assumptions, assets would accumulate to a peak of 265 percent of
expenditures in 2011, and would then decline steadily until exhaustion
in the year 2029. Based on the intermediate estimates in last
year's report, the peak fund ratio for the combined funds was estimated
to be 245 percent in 2011 and the year of exhaustion was also
estimated to be 2029.
Figure I.H3.Trust Fund Ratios for OASI and DI Trust Funds, Combined[Assets as a percentage of annual expenditures] |

|
For OASI and DI, separately, the peak fund ratios based on the intermediate
assumptions are 306 and 152 percent, respectively, in this
year's report and 284 percent and 136 percent, respectively, in last
year's report. The following table summarizes the projections in this
year's report for OASI, DI, and the combined trust funds under the
three sets of assumptions for the period 1997 through 2071.
Table I.H3. OASDI Trust Fund Ratios | ||||
| OASI |
DI |
Combined | ||
| Intermediate: | ||||
| Maximum trust fund ratio (percent) | 306 | 152 | 265 | |
| Year attained | 2013 | 2003 | 2011 | |
| Year of exhaustion | 2031 | 2015 | 2029 | |
| Low Cost: | ||||
| Maximum trust fund ratio (percent) | 469 | 1,276 | 457 | |
| Year attained | 2017 | 2071 | 2018 | |
| Year of exhaustion | - | - | - | |
| High Cost: | ||||
| Maximum trust fund ratio (percent) | 195 | 115 | 175 | |
| Year attained | 2007 | 1998 | 2001 | |
|
Year of exhaustion |
2022 |
2007 |
2018 | |
Under the low cost alternative I assumptions, the combined trust
fund ratio rises rapidly until the retirement of the "baby-boom"
generation, declines during the retirement years of the "baby-boom"
generation, but levels off and then resumes increasing after 2060, even
though annual balances are negative. This occurs because the
assumed trust fund interest rates are high enough to offset the small
annual deficits and still keep the trust funds growing faster than
annual outgo. For the high cost alternative III, the combined trust
fund is permanently exhausted in 2018.
Trust fund assets are generally invested in special Treasury securities so that the excess of cash receipts over expenditures are borrowed from the trust funds by the general fund of the Treasury and used to help meet various Federal outlays. These securities are backed by the full faith and credit of the U.S. Government, the same as other public-debt obligations of the U.S. Government. The assets of the trust funds can be redeemed for cash at any time if required to meet program expenditures. The redemption of a Treasury security held by a trust fund requires that the Treasury transfer cash -- obtained from another revenue source, such as income taxes or borrowing from the public -- to the trust fund. Thus, the investment operations of the trust funds result in various cash flows between the trust funds and the general fund of the Treasury.
Under the intermediate assumptions, the excess of OASDI income over outgo during the next 15 years will result in a substantial net cash flow from the trust funds of amounts borrowed by the general fund. Thereafter, this cash flow is expected to reverse; as trust fund securities are redeemed to meet benefit payments and other expenditures, revenue from the general fund of the Treasury will be drawn upon to provide the necessary cash. The accumulation and subsequent redemption of substantial trust fund assets has important economic and public policy implications that go well beyond the operation of the OASDI program itself. Discussion of these broader issues is not within the scope of this report.
4. Test of Long-Range Close Actuarial Balance
Because the OASI and DI programs, both separately and combined,
have actuarial deficits that are more than 5 percent of the corresponding
summarized cost rates over the next 75 years under the Trustees'
intermediate (alternative II) assumptions, they do not meet the
requirements of the Trustees' formal test for long-range close actuarial
balance. (This test is described in detail in section
II.F entitled
"Actuarial Estimates" later in this report.)