A SUMMARY OF THE 2015 ANNUAL REPORTS
Social Security and Medicare Boards of TrusteesA MESSAGE TO THE PUBLIC:
Each year the Trustees of the Social Security and Medicare trust funds report on the current and projected financial status of the two programs. This message summarizes the 2015 Annual Reports.
Social Security’s Disability Insurance (DI) Trust Fund now faces an urgent threat of reserve depletion, requiring prompt corrective action by lawmakers if sudden reductions or interruptions in benefit payments are to be avoided. Beyond DI, Social Security as a whole as well as Medicare cannot sustain projected long-run program costs under currently scheduled financing. Lawmakers should take action sooner rather than later to address these structural shortfalls, so that the uncertainty now facing disability beneficiaries will not eventually be experienced by other programs’ participants, and so that a broader range of solutions can be considered and more time will be available to phase in changes while giving the public adequate time to prepare. Earlier action will also help elected officials minimize adverse impacts on vulnerable populations, including lower-income workers and people already dependent on program benefits.
Social Security and Medicare together accounted for 42 percent of Federal program expenditures in fiscal year 2014. Current trust fund operations including General Fund transfers into SMI, the portion of interest payments made to the trust funds that are necessary to pay benefits, and any drawdowns of a trust fund’s assets—are resulting in mounting pressure on the unified budget. Both Social Security and Medicare will experience cost growth substantially in excess of GDP growth through the mid-2030s due to rapid population aging caused by the large baby-boom generation entering retirement and lower-birth-rate generations entering employment and, in the case of Medicare, to growth in expenditures per beneficiary exceeding growth in per capita GDP. In later years, projected costs expressed as a share of GDP trend up slowly for Medicare and are relatively flat for Social Security, reflecting very gradual population aging caused by increasing longevity and slower growth in per-beneficiary health care costs.
Social Security
The DI program satisfies neither the Trustees’ long-range test of close actuarial balance nor our short-range test of financial adequacy and faces the most immediate financing shortfall of any of the separate trust funds. DI Trust Fund reserves expressed as a percent of annual cost (the trust fund ratio) declined to 40 percent at the beginning of 2015, and the Trustees project trust fund depletion late in 2016, the same year projected in the last Trustees Report. DI costs have exceeded non-interest income since 2005, and the trust fund ratio has declined in every year since peaking in 2003. While legislation is needed to address all of Social Security’s financial imbalances, the need has become urgent with respect to the program’s disability insurance component. Lawmakers need to act soon to avoid automatic reductions in payments to DI beneficiaries in late 2016.
To summarize overall Social Security finances, the Trustees have traditionally emphasized the financial status of the hypothetical combined trust funds for DI and for Old Age and Survivors Insurance (OASI). The combined trust funds, and expenditures that can be financed in the context of the combined trust funds, are hypotheticals because there is no legal authority to finance one program’s expenditures with the other program’s taxes or reserves.
Social Security’s total expenditures have exceeded non-interest income of its combined trust funds since 2010, and the Trustees estimate that Social Security cost will exceed non-interest income throughout the 75-year projection period. The Trustees project that this annual cash-flow deficit will average about $76 billion between 2015 and 2018 before rising steeply as income growth slows to its sustainable trend rate after the economic recovery is complete while the number of beneficiaries continues to grow at a substantially faster rate than the number of covered workers.
Interest income and redemption of trust fund assets from the General Fund of the Treasury, will provide the resources needed to offset Social Security’s annual aggregate cash-flow deficits until 2034. Since the cash-flow deficit will be less than interest earnings through 2019, total income will exceed expenditures and reserves of the combined trust funds will continue to grow but not by enough to prevent the ratio of reserves to one year’s projected cost (the combined trust fund ratio) from declining. (This ratio peaked in 2008, declined through 2014, and is expected to decline steadily in future years.) After 2019, Treasury will redeem trust fund asset reserves to the extent that program cost exceeds tax revenue and interest earnings until depletion of total trust fund reserves in 2034, one year later than projected in last year’s Trustees Report. Thereafter, tax income is projected to be sufficient to pay about three-quarters of scheduled benefits through the end of the projection period in 2089.
Under current projections, the annual cost of Social Security benefits expressed as a share of workers’ taxable earnings will grow rapidly from 11.3 percent in 2007, the last pre-recession year, to roughly 16.7 percent in 2038, and will then decline lightly before slowly increasing after 2050. Costs display a slightly different pattern when expressed as a share of GDP. Program costs equaled 4.1 percent of GDP in 2007, and the Trustees project these costs will increase to 6.0 percent of GDP for 2037, then stay about flat through 2060, and thereafter rise slowly reaching 6.2 percent by 2089.
The projected 75-year actuarial deficit for the combined Old-Age and Survivors Insurance and Disability Insurance (OASDI) Trust Funds is 2.68 percent of taxable payroll, down from 2.88 percent projected in last year’s report. This deficit amounts to 20 percent of program non-interest income or 16 percent of program cost. A 0.06 percentage point increase in the OASDI actuarial deficit would have been expected if nothing had changed other than the one-year extension of the valuation period to 2089. The effects of recently enacted legislation, updated demographic and economic data, and improved methodologies on net improved the actuarial deficit by 0.26 percent of taxable payroll.
While the hypothetical combined OASDI Trust Fund fails the long-range test of close actuarial balance, it does satisfy the test for short-range (ten-year) financial adequacy. The Trustees project that the combined trust fund asset reserves at the beginning of each year will exceed that year’s projected cost through 2028.
Medicare
The Trustees project that the Medicare Hospital Insurance (HI) Trust Fund will be depleted in 2030, the same year projected in last year’s report. At that time dedicated revenues will be sufficient to pay 86 percent of HI costs. The Trustees project that the share of HI cost that can be financed with HI dedicated revenues will decline slowly to 80 percent in 2050, and will then rise gradually to 84 percent in 2089. HI non-interest income less HI expenditure is projected to be negative this year and next (as it has been in every year since 2008), and then turn positive for four years (2017-2020) before turning negative again in 2021. The HI fund again fails the test of short-range financial adequacy, as its trust fund ratio is already below 100 percent and is expected to decline in a near continuous fashion until reserve depletion in 2030.
The HI Trust Fund’s projected long-term actuarial imbalance is smaller than that of the combined Social Security trust funds under the intermediate assumptions employed in the 2015 Trustees Report. The estimated 75-year actuarial deficit in the HI Trust Fund is 0.68 percent of taxable payroll, which amounts to 18 percent of tax receipts or 15 percent of program cost. This estimate is down from 0.87 percent projected in last year’s report, in large part due to a change in the projection methodology that results in a lower estimate for long-range health care cost growth for HI and other parts of Medicare.
The Trustees project that Part B of Supplementary Medical Insurance (SMI), which pays doctors’ bills and other outpatient expenses, and Part D of SMI that pays for prescription drug coverage, will remain adequately financed into the indefinite future because current law provides financing from general revenues and beneficiary premiums each year to meet the next year’s expected costs. However, the aging population and rising health care costs cause SMI projected costs to grow steadily from 2.0 percent of GDP in 2014 to approximately 3.4 percent of GDP in 2035, and then more slowly to 3.8 percent of GDP by 2089. General revenues will finance roughly three quarters of these costs, and premiums paid by beneficiaries almost all of the remaining quarter. SMI also receives a small amount of financing from special payments by States and from fees on manufacturers and importers of brand-name prescription drugs.
The Trustees project that total Medicare costs (including both HI and SMI expenditures) will grow from approximately 3.50 percent of GDP in 2014 to 5.4 percent of GDP by 2035 and will increase gradually thereafter to about 6.0 percent of GDP by 2089.
Relative to last year’s projections, the projections for Medicare’s total costs are little changed over the next 20 years, but are substantially lower over the longer range. The improvement in the longer-term Medicare outlook is principally due to the methodological change mentioned above, and also to provisions of the recently enacted Medicare Access and CHIP Reauthorization Act of 2015 (MACRA) that lowers projected long-range Medicare Part B costs. After 20 years, Medicare reimbursement rates for physicians’ services under MACRA are substantially reduced relative to last year’s featured baseline projection that assumed continued overrides of the prior-law mechanism for setting Medicare’s physician reimbursement rates.
In recent years U.S. national health expenditure (NHE) growth has slowed considerably. There is uncertainty regarding the degree to which this slowdown reflects the impacts of the recent economic downturn and other non-persistent factors or structural changes in the health care sector that may continue to produce cost savings in the years ahead. The Trustees are hopeful that U.S. health care practices are in the process of becoming more efficient as new payment models become more prevalent and providers anticipate less rapid growth of reimbursement rates in both the public and private sectors than has occurred during the past several decades.
For a number of years the methodology the Trustees have employed for projecting Medicare finances over the long term has assumed a substantial reduction in per capita health expenditure growth rates relative to historical experience. In addition, the Trustees have been revising down their projections for near-term Medicare expenditure growth in light of the recent favorable experience, in part due to effects of payment changes and delivery system reform that are changing how health care is practiced. However, the Trustees have not assumed additional, specific cost saving arising from structural changes in the delivery system that may result from MACRA’s new payment mechanisms and the cost-reduction incentives in the Affordable Care Act, as well as from payment reforms initiated by the private sector.
Notwithstanding the assumption of a substantial slowdown of per capita health expenditure growth, the projections indicate that Medicare still faces a substantial financial shortfall that will need to be addressed with further legislation. Such legislation should be enacted sooner rather than later to minimize the impact on beneficiaries, providers, and taxpayers.
Conclusion
Lawmakers should address the financial challenges facing Social Security and Medicare as soon as possible. Taking action sooner rather than later will permit consideration of a broader range of solutions and provide more time to phase in changes so that the public has adequate time to prepare.
By the Trustees:Secretary of the Treasury,
and Managing Trustee
of the Trust Funds.
Sylvia M. Burwell,
Secretary of Health
and Human Services,
and Trustee.
Charles P. Blahous III,
Trustee.
Secretary of Labor,
and Trustee.
Carolyn W. Colvin,
Acting Commissioner of
Social Security,
and Trustee.
Robert D. Reischauer,
Trustee.
A SUMMARY OF THE 2015 ANNUAL SOCIAL SECURITY
AND MEDICARE TRUST FUND REPORTS
The Trustees continue to project depletion of the Social Security Disability Insurance (DI) Trust Fund in late 2016 if lawmakers take no action. This impending DI funding shortfall, which threatens beneficiaries with sudden and substantial benefit reductions, is but the first manifestation of larger financial imbalances facing Social Security as a whole as well as Medicare. The Trustees strongly urge lawmakers to enact legislation promptly to achieve sustainable financial balance which, in view of current financing needs, would almost certainly need to include at least a temporary increase in resources for the DI Trust Fund.
Social Security’s and Medicare’s projected long-range costs are not sustainable with currently scheduled financing and will require legislative action to avoid disruptive consequences for beneficiaries and taxpayers. The sooner that lawmakers take action, the wider will be the range of solutions to consider and the more time that will be available to phase in changes, giving the public adequate time to prepare. Timely resolution of the financial imbalances will prevent the uncertainty currently facing the disabled population from being experienced by other Social Security and Medicare participants. Earlier action would also provide more opportunity to ameliorate adverse impacts on vulnerable populations, including lower-income workers and people already significantly dependent on program benefits.
What Were the Trust Fund Results in 2014? In 2014, 48.1 million people received Old-Age and Survivors Insurance (OASI) benefits, 10.9 million received DI benefits, and 53.8 million were covered under Medicare. A summary of Social Security and Medicare trust fund operations is shown in the following table. The OASI Trust Fund increased asset reserves in 2014; reserves in the DI, Hospital Insurance (HI), and Supplemental Medical Insurance (SMI) Trust Funds declined.
| OASI | DI | HI | SMI | |
|---|---|---|---|---|
| Reserves (end of 2013) | $2,674.0 | $90.4 | $205.4 | $75.1 |
| Income during 2014 | 769.4 | 114.9 | 261.2 | 338.0 |
| Cost during 2014 | 714.2 | 145.1 | 269.3 | 344.0 |
| Net change in Reserves | 55.2 | -30.2 | -8.1 | -6.0 |
| Reserves (end of 2014) | 2,729.2 | 60.2 | 197.3 | 69.1 |
Note: Totals do not necessarily equal the sum of rounded components.
The following table shows payments, by category, from each trust fund in 2014.
| Category (in billions) | OASI | DI | HI | SMI |
|---|---|---|---|---|
| Benefit payments | $706.8 | $141.7 | $264.9 | $339.6 |
| Railroad Retirement financial interchange | 4.3 | 0.4 | — | — |
| Administrative expenses | 3.1 | 2.9 | 4.5 | 4.4 |
| Total | 714.2 | 145.1 | 269.3 | 344.0 |
Note: Totals do not necessarily equal the sum of rounded components.
Trust fund income, by source, in 2014 is shown below.
| Source (in billions) | OASI | DI | HI | SMI |
|---|---|---|---|---|
| Payroll taxes | $646.2 | $109.7 | $227.4 | — |
| Taxes on OASDIa benefits | 28.0 | 1.7 | 18.1 | — |
| Beneficiary premiums | — | — | 3.3 | $77.0 |
| Transfers from States | — | — | — | 8.7 |
| General Fund reimbursements | 0.4 | 0.1 | 2.0 | 3.0 |
| General revenues | — | — | — | $243.7 |
| Interest earnings | 94.8 | 3.4 | 8.8 | 2.4 |
| Other | b | — | 1.6 | 3.3 |
| Total | 769.4 | 114.9 | 261.2 | 338.0 |
a
OASDI designates the combined operations of the OASI and DI programs.
b
Less than $50 million.
In 2014, Social Security’s cost continued to exceed the combined program’s tax income, a situation that the Trustees project to persist throughout the long-range period (2015-89) and beyond. The 2014 deficit of tax income (Table 3, first two lines) relative to cost was $74 billion.
In 2014, the HI fund used $9 billion of interest income (Table 3) and $8 billion of asset reserves (Table 1) to finance expenditures beyond those that could have been made solely on the basis of tax and premium income. For SMI, transfers from the General Fund of the Treasury, which are set prospectively based on projected costs, represent the largest source of income. Part B spending was higher than anticipated in 2014, accounting for half of the $6 billion decrease in account asset reserves (Table 1).
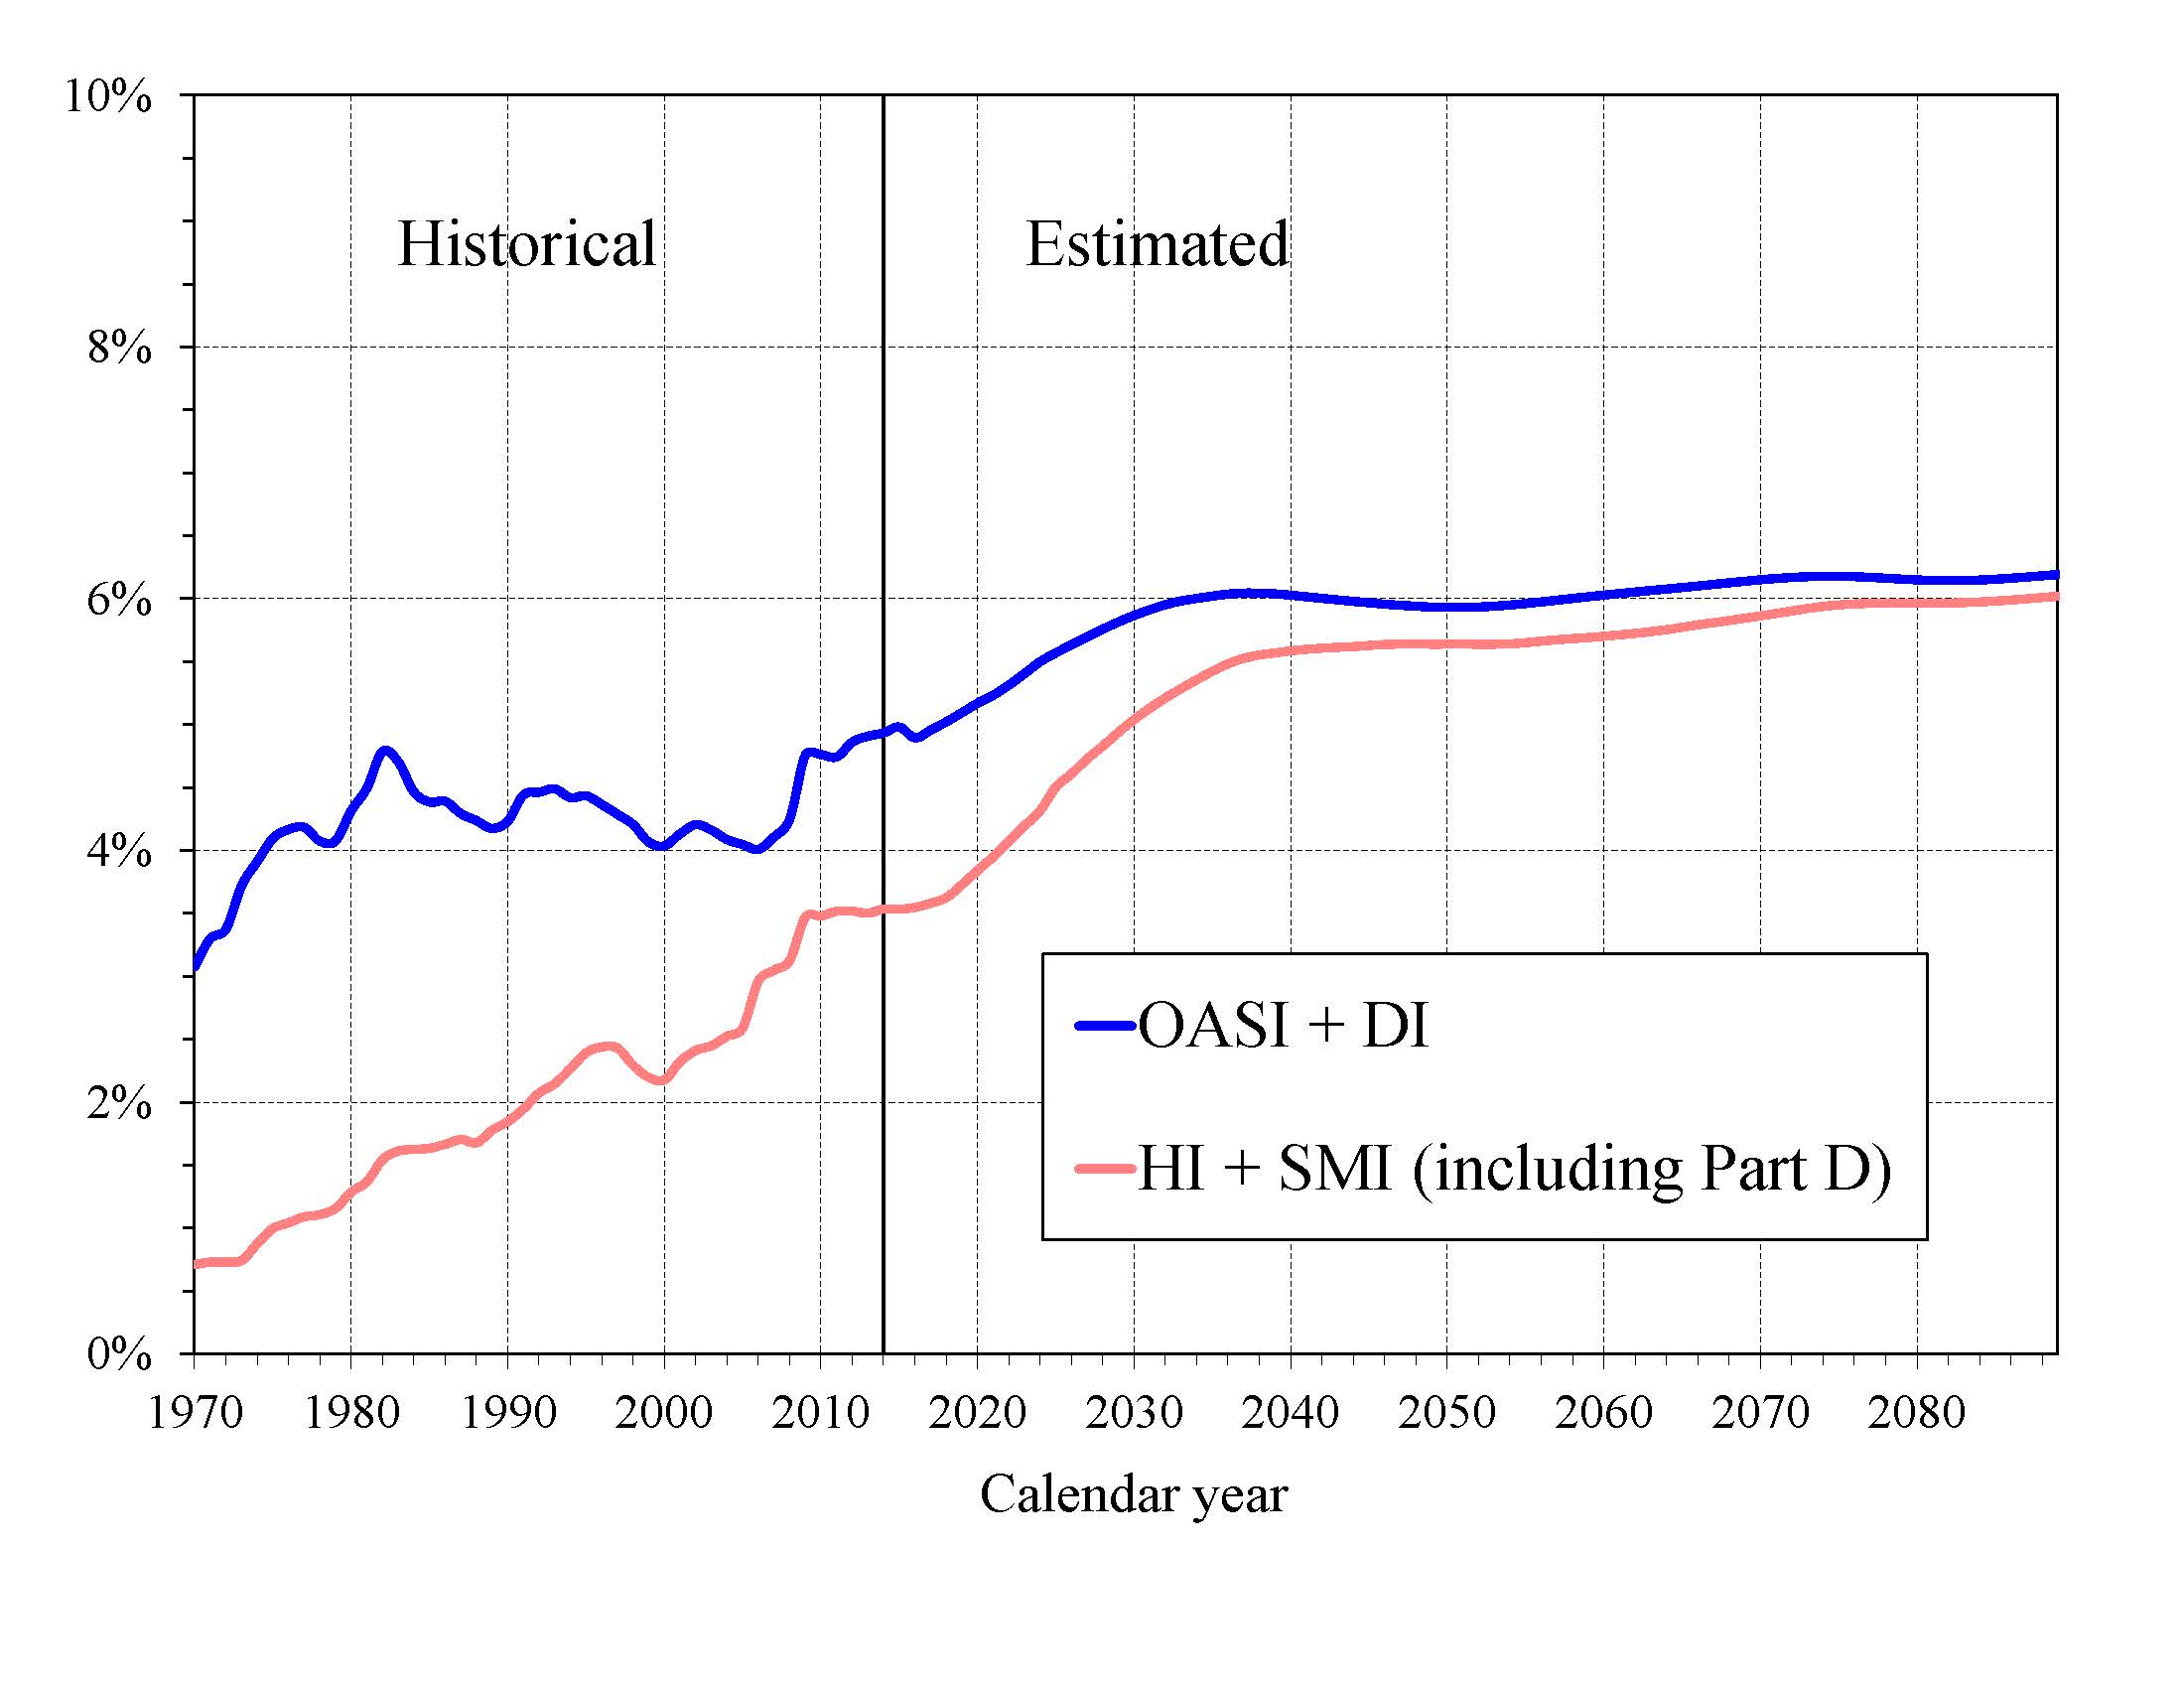
What is the Outlook for Future Social Security and Medicare Costs in Relation to GDP? One instructive way to view the projected costs of Social Security and Medicare is to compare the costs of scheduled benefits nd administrative costs for the programs with the gross domestic product (GDP), the most frequently used measure of the total output of the U.S. economy (Chart A). Under the intermediate assumptions employed in the reports and throughout this Summary, costs for the programs increase substantially through 2035 when measured this way because: (1) the number of beneficiaries rises rapidly as the baby-boom generation retires; and (2) the lower birth rates that have persisted since the baby boom cause slower growth of the labor force and GDP.
|
Social Security’s projected annual cost increases to about 6.0 percent of GDP by 2035, declines to 5.9 percent by 2050, and rises to 6.2 percent of GDP by 2089. Under the intermediate assumptions, Medicare cost rises to 5.4 percent of GDP by 2035 due mainly to the rapid growth in the number of beneficiaries, and then to 6.0 percent by 2089. The growth in health care cost per beneficiary becomes the larger factor later in the valuation period, particularly in Part D
In 2014, the combined cost of the Social Security and Medicare programs equaled 8.5 percent of GDP. The Trustees project an increase to 11.4 percent of GDP by 2035 and to 12.2 percent of GDP by 2089. Medicare’s relative cost (3.5 percent of GDP) is expected to rise gradually from 71 percent of the cost of Social Security (5.0 percent of GDP) in 2015 to about 97 percent by 2089.
The projected costs for OASDI and HI depicted in Chart A and elsewhere in this document reflect the full cost of scheduled current-law benefits without regard to whether the trust funds will have sufficient resources to meet these obligations. Current law precludes payment of any benefits beyond the amount that can be financed by the trust funds, that is, from annual income and trust fund reserves. In years after trust fund depletion, the amount of benefits that would be payable is lower than shown, as described later in this summary, because benefit cost exceeds annual income. In addition, the projected costs assume realization of the full estimated savings of the Affordable Care Act and the physician payment rate updates specified in the Medicare Access and CHIP Reauthorization Act (MACRA) of 2015. As described in the Medicare Trustees Report, the projections for HI and SMI Part B depend significantly on the sustained effectiveness of various current-law cost-saving measures, in particular, the lower increases in Medicare payment rates to most categories of health care providers.
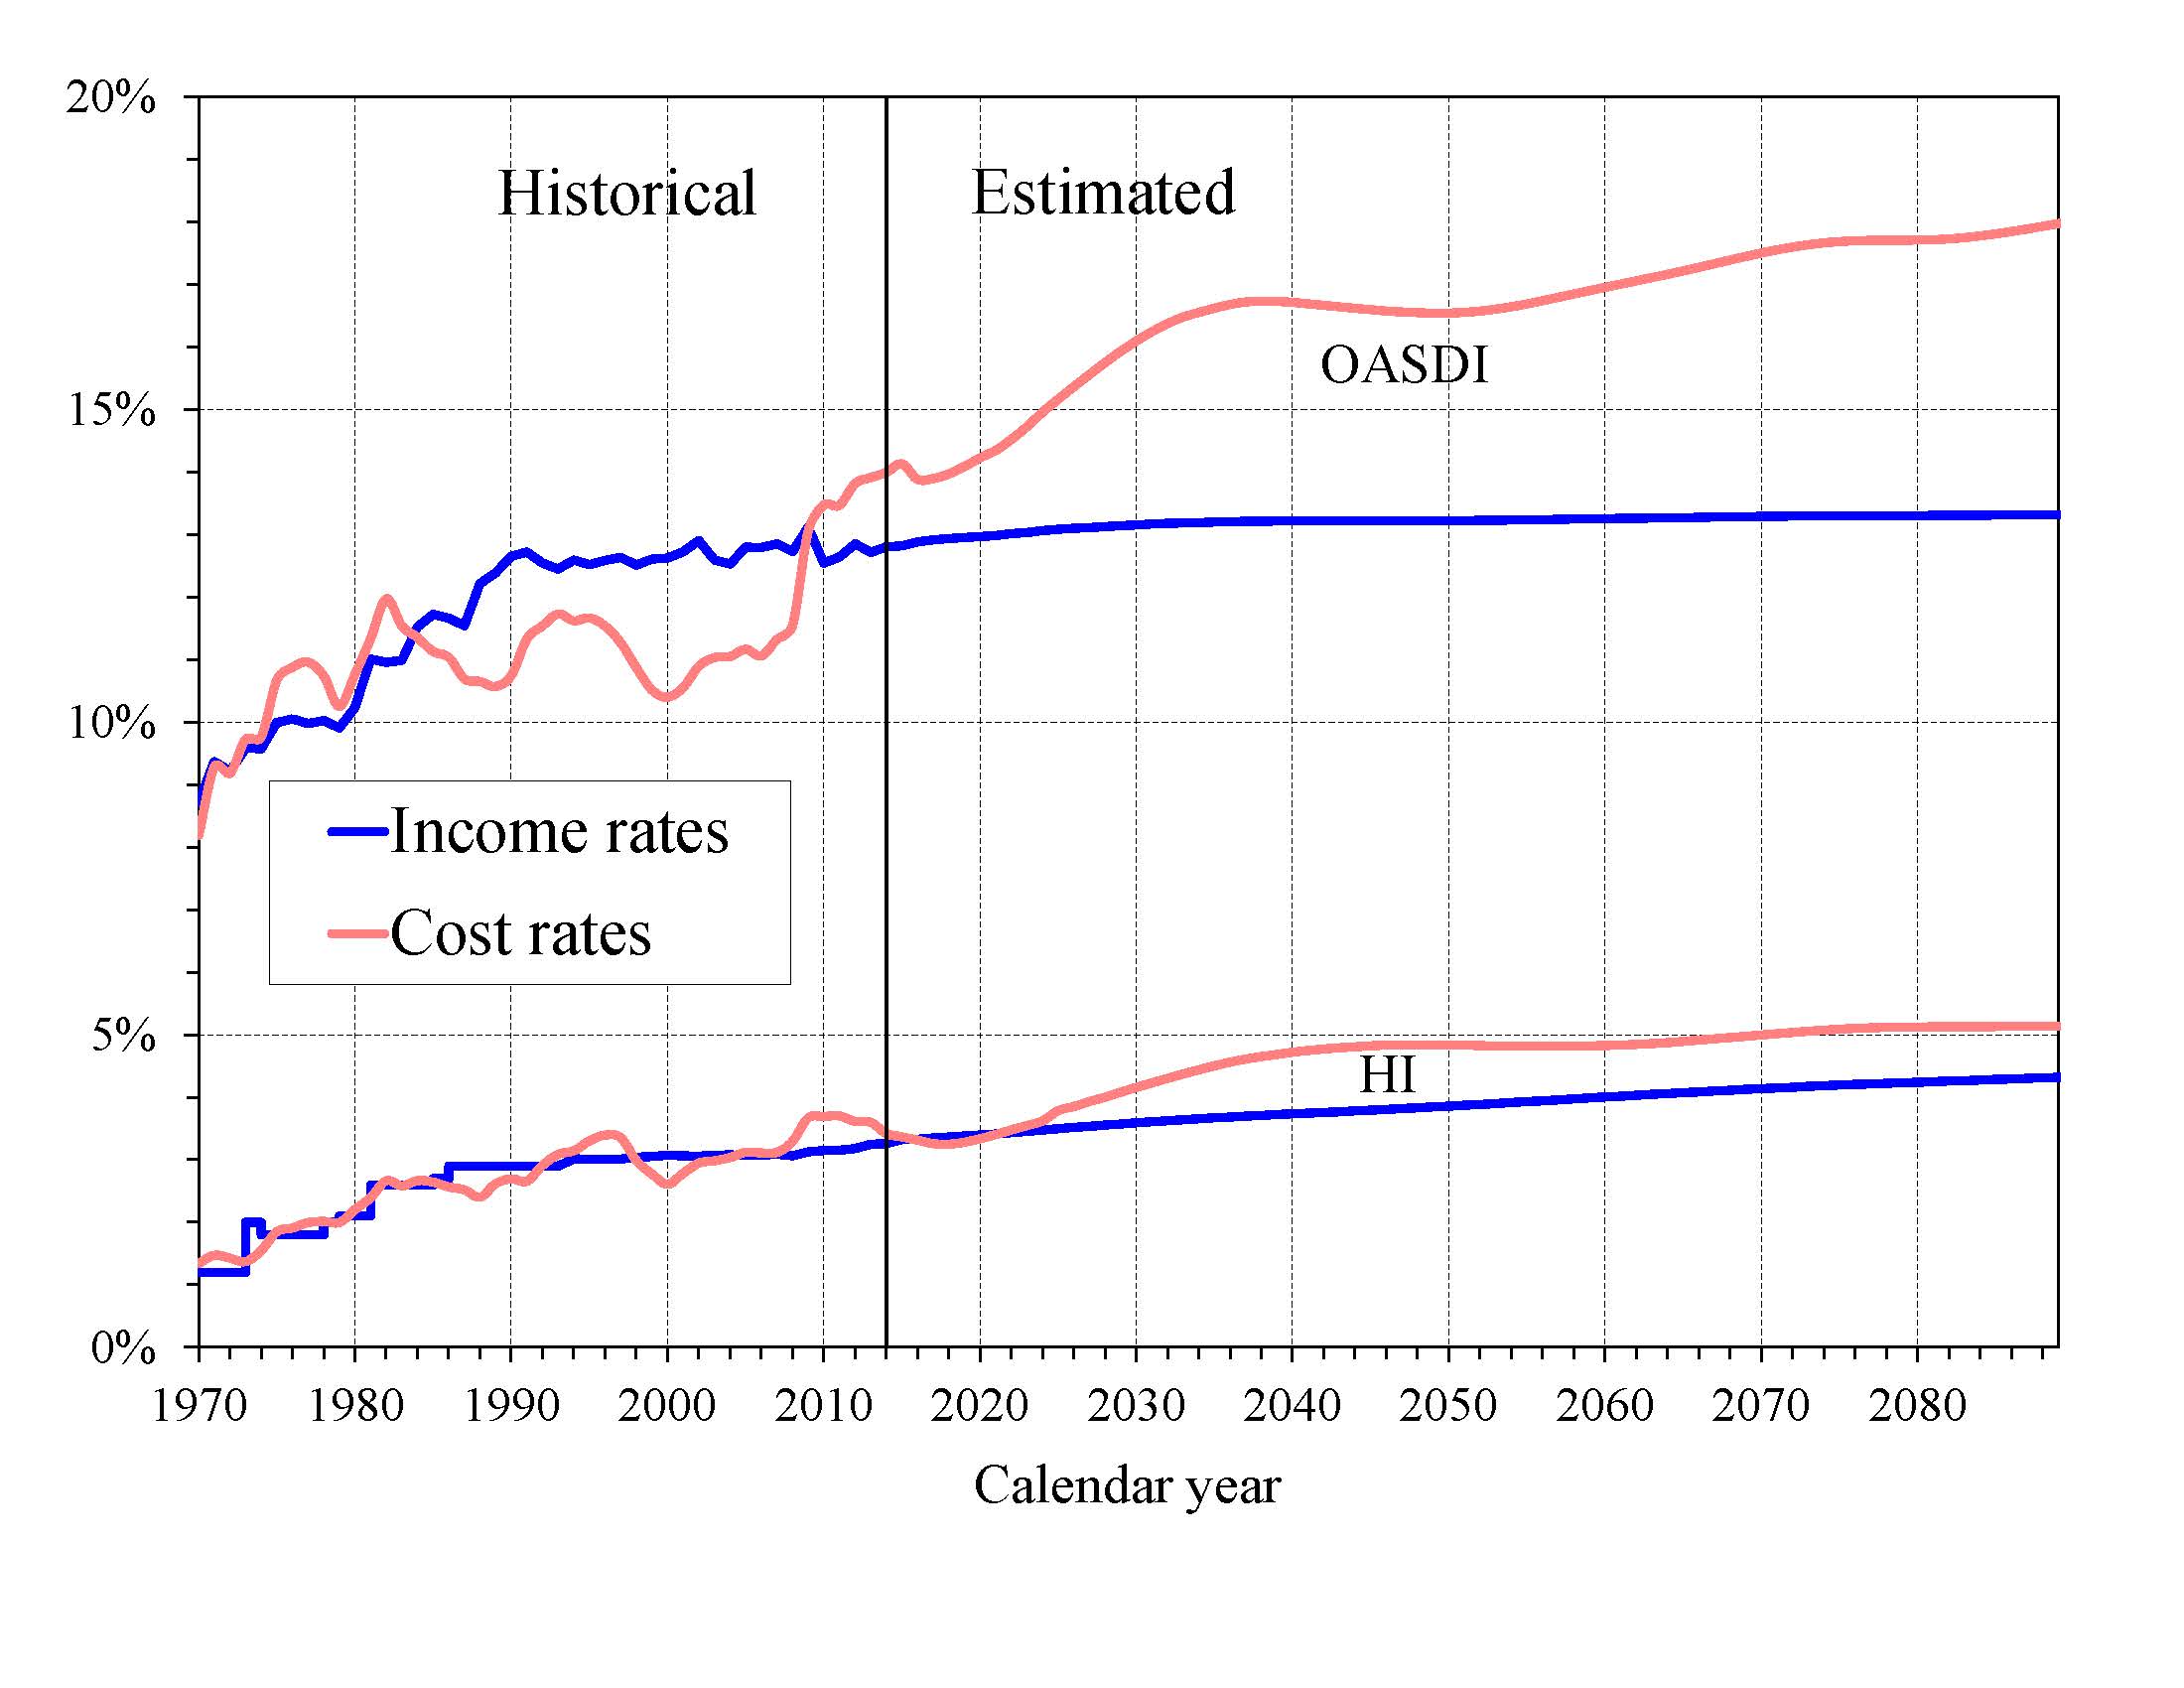
What is the Outlook for Future Social Security and Medicare HI Costs and Income in Relation to Taxable Earnings? Since the primary source of income for OASDI and HI is the payroll tax, it is informative to express the programs’ incomes and costs as percentages of taxable payroll—that is, of the base of worker earnings taxed to support each program (Chart B). Both the OASDI and HI annual cost rates rise over the long run from their 2014 levels (13.99 and 3.42 percent). Projected Social Security cost grows to 16.73 percent of taxable payroll by 2038, declines to 16.54 percent in 2050, and then rises gradually to 17.97 percent in 2089. The projected Medicare HI cost rate rises to 4.84 percent of taxable payroll in 2050, and thereafter increases to 5.14 percent in 2089.
|
HI taxable payroll is about 25 percent larger than that of OASDI because the HI payroll tax is imposed on all earnings while OASDI taxes apply only to earnings up to a maximum ($118,500 in 2015) which ordinarily is adjusted each year.
The OASDI income rate—which includes scheduled payroll taxes at the current 12.4 percent level, taxes on benefits, and any other transfers of revenues to the trust funds excepting interest payments—was 12.80 percent in 2014 and increases slowly over time, reaching 13.32 percent in 2089. Annual income from the taxation of OASDI benefits will increase gradually relative to taxable payroll as a greater proportion of Social Security benefits is subject to taxation in future years, but will continue to be a relatively small component of program income.
The HI income rate—which includes payroll taxes and taxes on OASDI benefits, but excludes interest payments—rises gradually from 3.26 percent in 2014 to 4.32 percent in 2089 due to the Affordable Care Act’s increase in payroll tax rates for high earners that began in 2013. Individual tax return filers with earnings above $200,000, and joint return filers with earnings above $250,000, pay an additional 0.9 percent tax on earnings above these earnings thresholds. An increasing fraction of all earnings will be subject to the higher tax rate over time because the thresholds are not indexed. By 2089, an estimated 80 percent of workers would pay the higher rate.
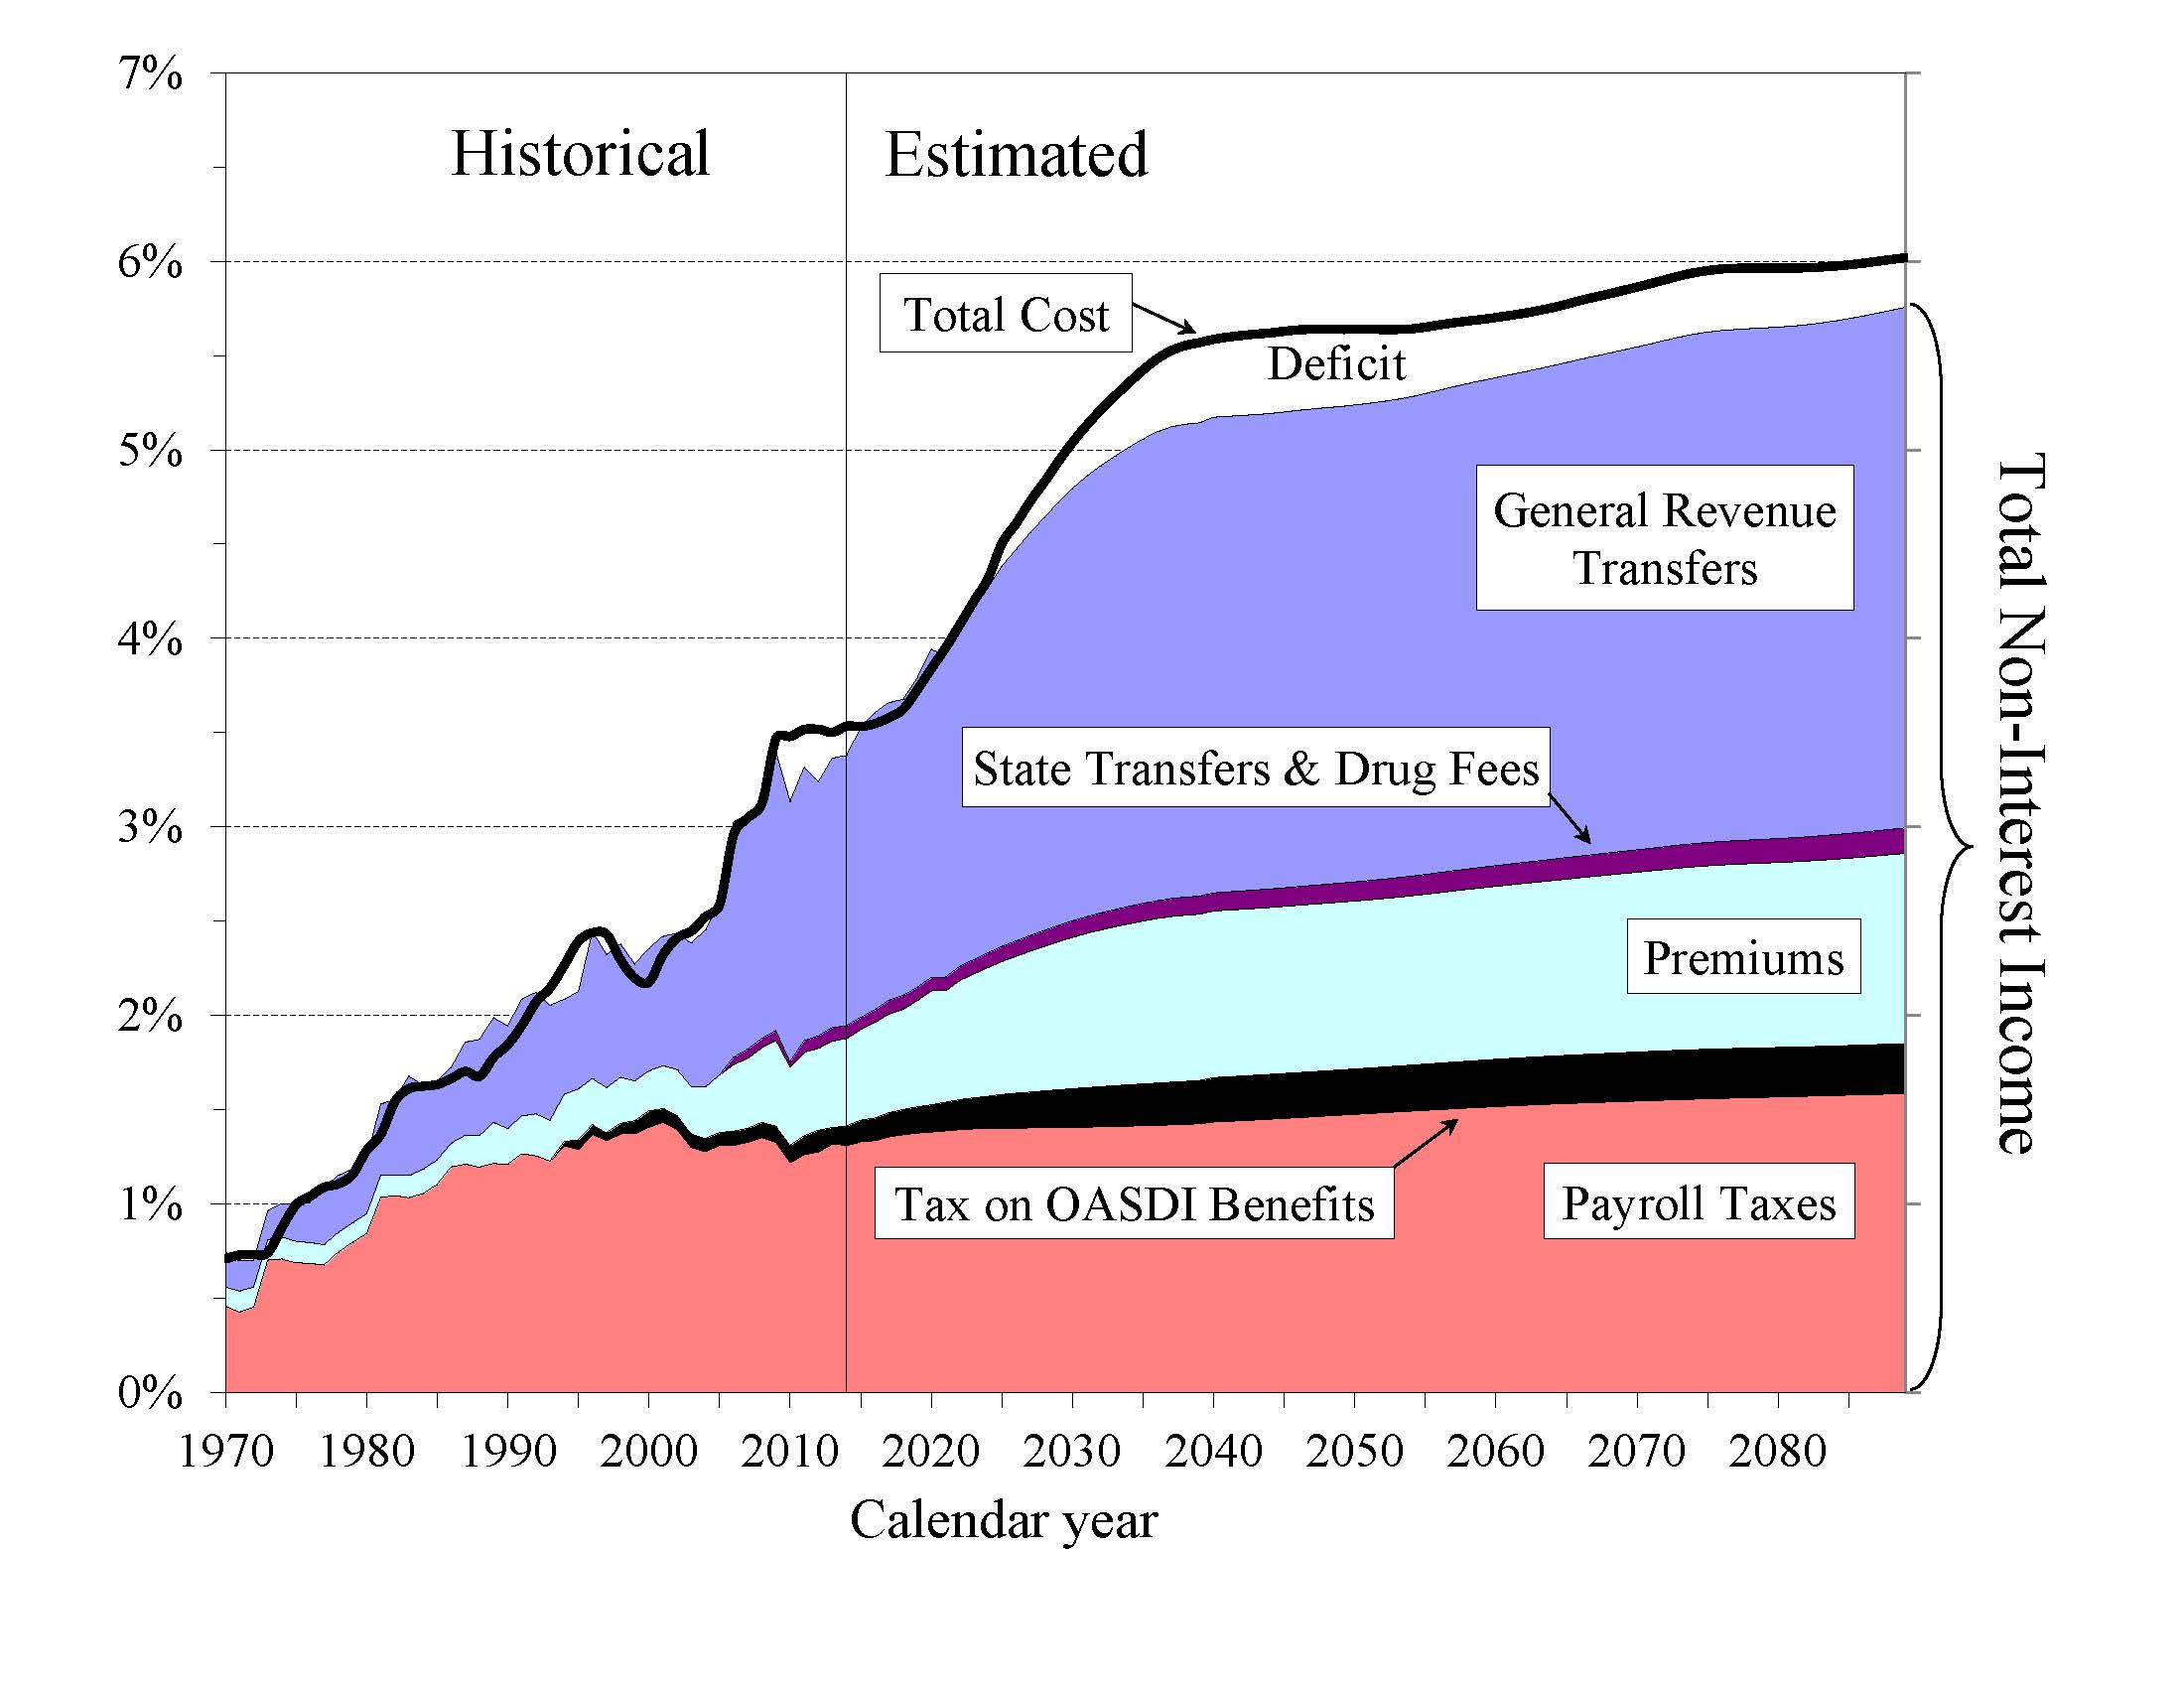
How Will Cost Growth in the Different Parts of Medicare Change the Sources of Program Financing? As Medicare cost grows over time, general revenue and beneficiary premiums will play an increasing role in financing the program. Chart C shows scheduled cost and non-interest revenue sources under current law for HI and SMI combined as a percentage of GDP. The total cost line is the same as displayed in Chart A and shows Medicare cost rising to 6.0 percent of GDP by 2089.
Projected revenue from payroll taxes and taxes on OASDI benefits credited to the HI Trust Fund increases from 1.4 percent of GDP in 2015 to 1.9 percent in 2089 under the projected baseline, while projected general revenue transfers to the SMI Trust Fund increase from 1.5 percent of GDP in 2015 to 2.8 percent in 2089, and beneficiary premiums increase from 0.5 to 1.0 percent of GDP. The share of total non-interest Medicare income from taxes falls substantially (from 41 percent to 32 percent) while general revenue transfers rises (from 44 percent to 48 percent), as does the share of premiums (from 14 percent to 18 percent). The distribution of financing changes in part because in Parts B and D—the Medicare components that are financed largely from general revenues—costs increase at a faster rate than Part A cost under the Trustees’ projections. By 2089, the projected HI deficit represents 0.5 percent of GDP and there is no provision under current law to finance that shortfall through general revenue transfers or any other revenue source.
Projected revenue from payroll taxes and taxes on OASDI benefits credited to the HI Trust Fund increases from 1.4 percent of GDP in 2015 to 1.9 percent in 2089 under current law, while projected general revenue transfers to the SMI Trust Fund increase from 1.5 percent of GDP in 2015 to 2.8 percent in 2089, and beneficiary premiums increase from 0.5 to 1.0 percent of GDP during the same period. Thus, the share of total non-interest Medicare income from taxes falls substantially (from 41 percent to 32 percent) while general revenue transfers rises (from 44 percent to 48 percent), as does the share of premiums (from 14 percent to 18 percent). The distribution of financing changes in large part because in Part B and especially Part D—the Medicare components that are financed largely from general revenues—costs increase at a faster rate than Part A cost under the Trustees’ projections. The projected annual HI financial deficit beyond 2035 through 2089 averages about 0.4 percent of GDP and there is no provision under current law to finance that shortfall through general revenue transfers or any other revenue source.
|
The Medicare Modernization Act (2003) requires that the Board of Trustees determine each year whether the annual difference between program cost and dedicated revenues (the bottom four layers of Chart C) under current law exceeds 45 percent of total Medicare cost in any of the first seven fiscal years of the 75-year projection period, in which case the annual Trustees Report must include, as it did from 2006 through 2013, a determination of “excess general revenue Medicare funding.” Because the difference between program cost and dedicated revenues is not expected to exceed the 45 percent threshold during fiscal years 2015-21, there is no such determination in this year’s report.
What are the Budgetary Implications of Rising Social Security and Medicare Costs? Concern about the long-range financial outlook for Medicare and Social Security often focuses on the depletion dates for the HI and OASDI trust funds—the times when the projected trust fund balances under current law will be insufficient to pay the full amounts of scheduled benefits. A more immediate issue is the effect the programs have on the unified Federal budget prior to depletion of the trust funds.
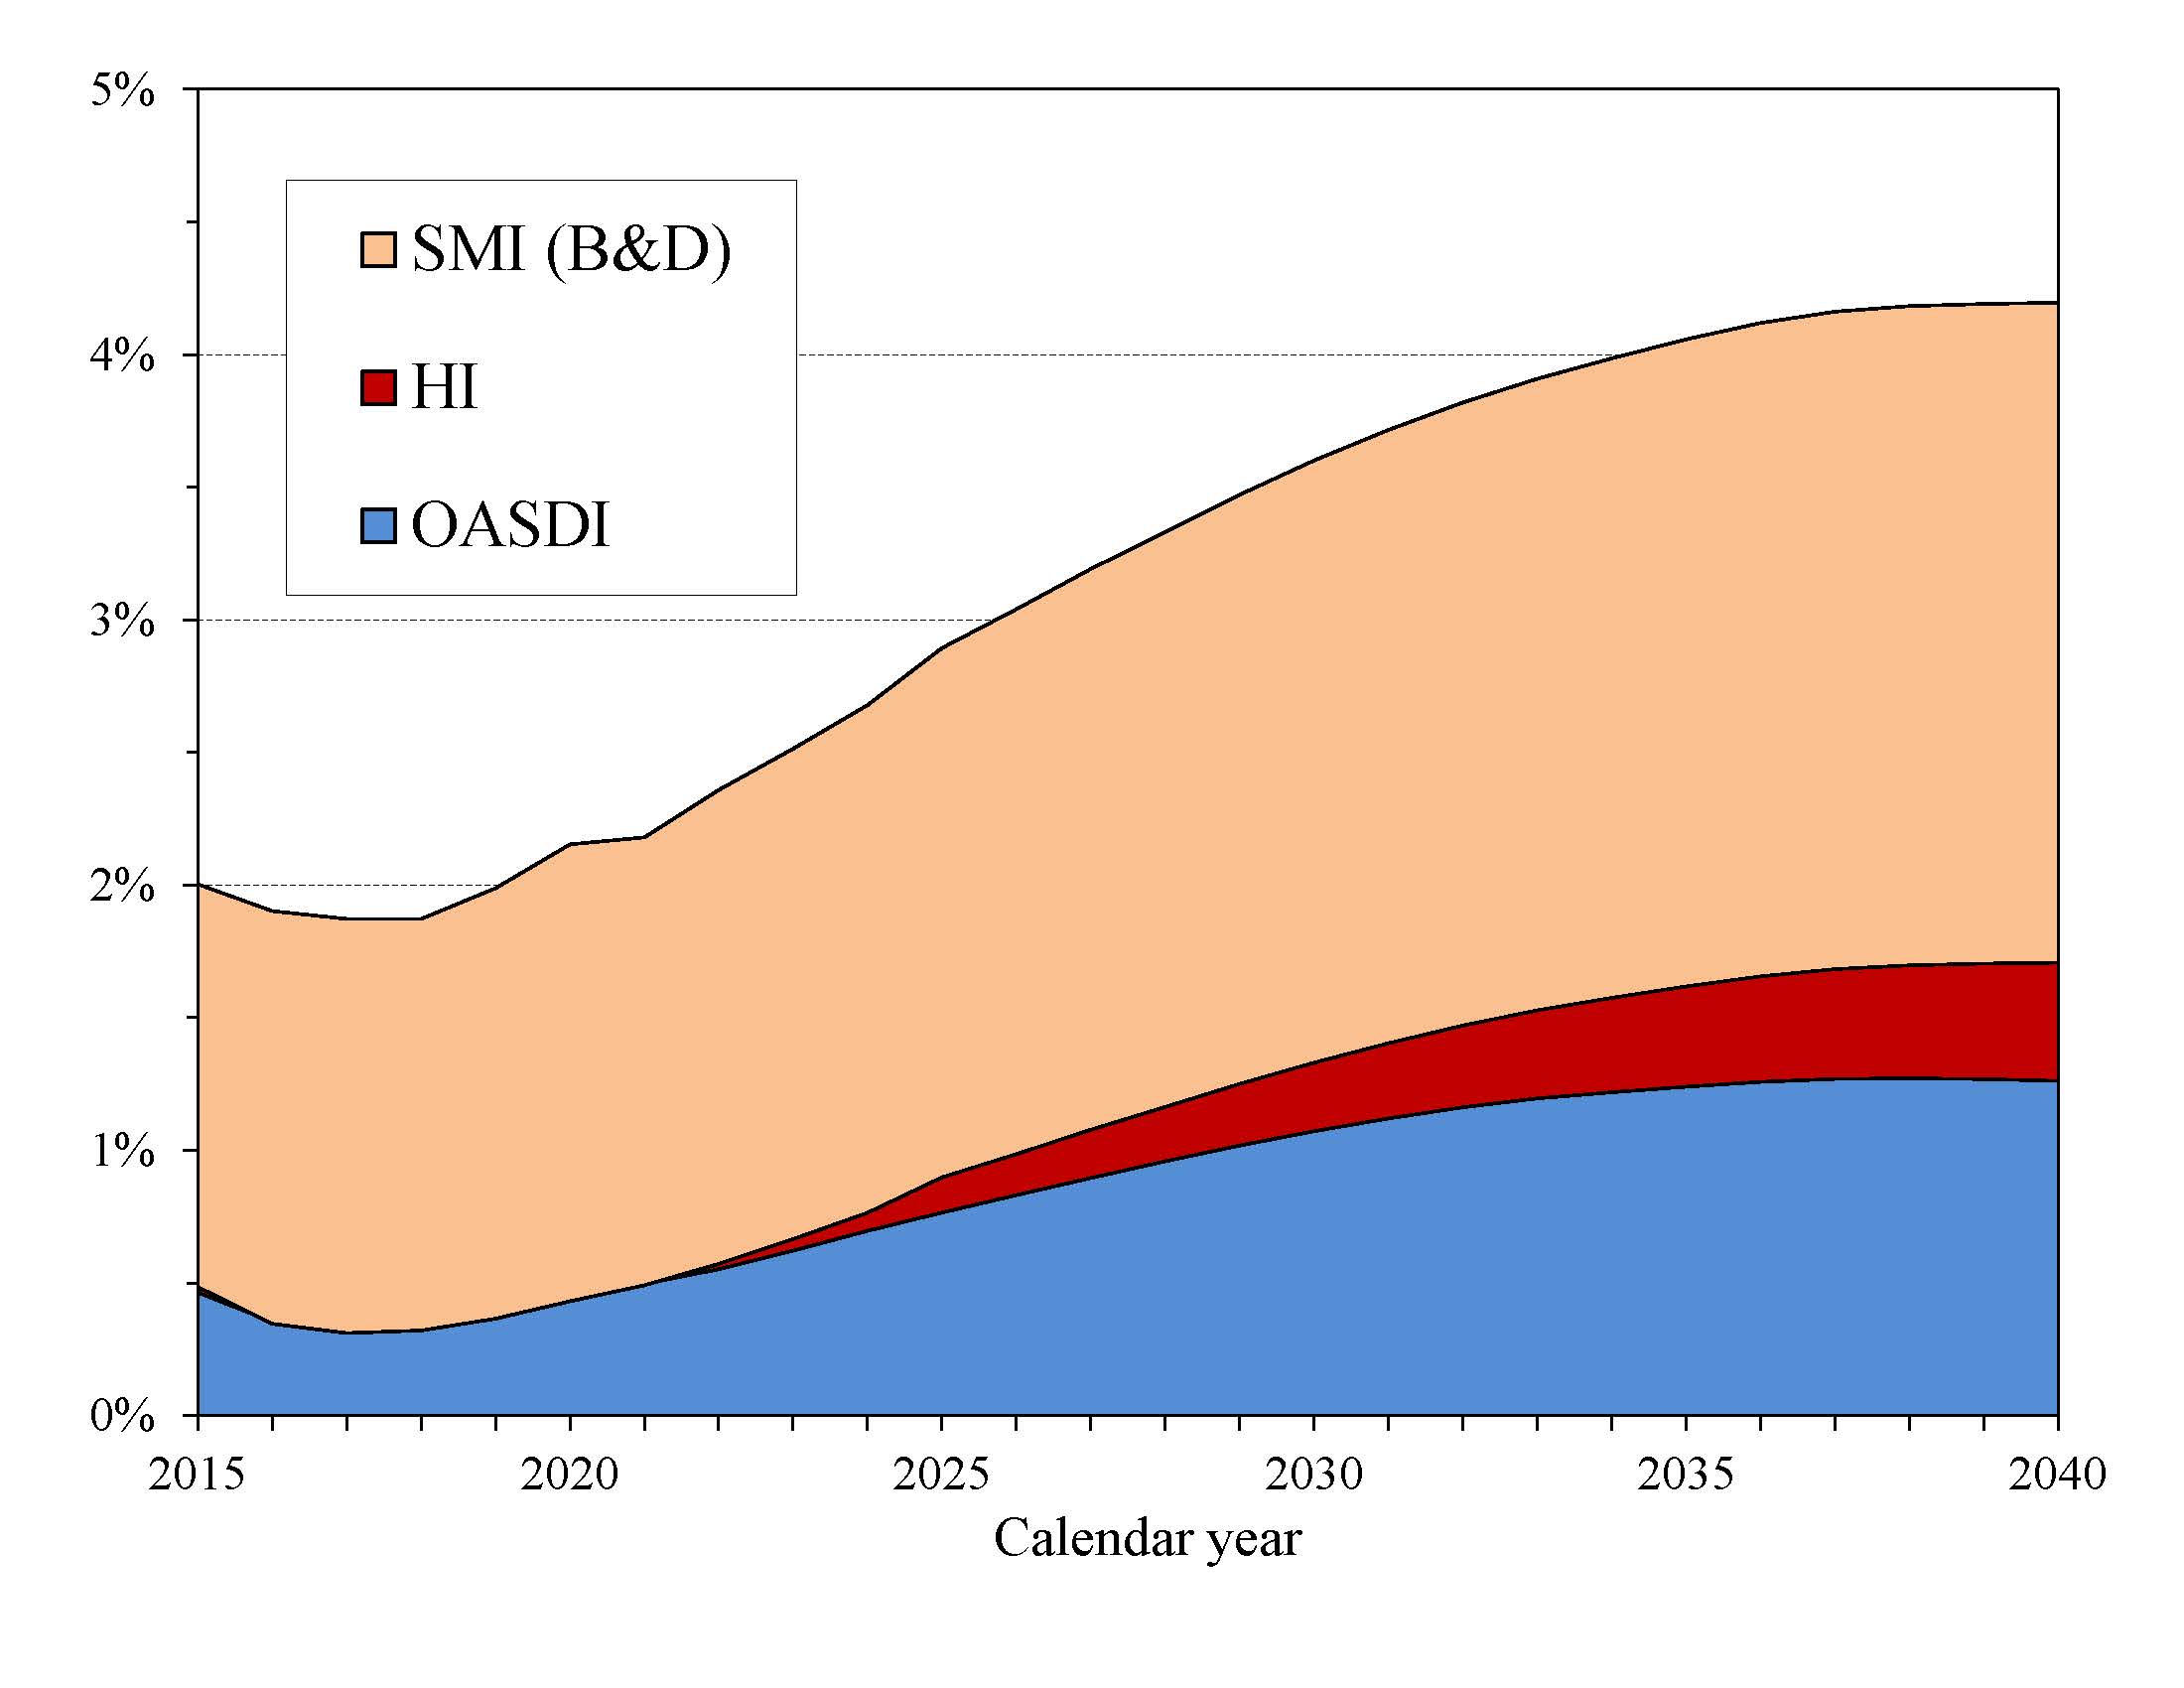
Chart D shows the excess of scheduled costs over dedicated tax and premium income for the OASDI, HI, and SMI trust funds expressed as percentages of GDP through 2040.1 Each of these trust funds’ operations will contribute increasing amounts to Federal unified budget deficits in future years. General revenues pay for roughly 75 percent of all SMI costs. Until 2030, interest earnings and asset redemptions, financed from general revenues, will cover the shortfall of HI tax and premium revenues relative to expenditures. In addition, general revenues must cover similar payments as a result of OASDI deficits through 2034.2
|
In 2015, the projected difference between Social Security’s expenditures and dedicated tax income is $84 billion. For HI, the projected difference between expenditures and dedicated tax and premium income is $4 billion. 3 The projected general revenue demands of SMI are $276 billion. Thus, the total General Fund requirements for Social Security and Medicare in 2015 are $364 billion, or 2.0 percent of GDP. Redemption of trust fund bonds, interest paid on those bonds, and transfers from the General Fund provide no new net income to the Treasury, which must finance these payments through some combination of increased taxation, reductions in other government spending, or additional borrowing from the public.
Chart D shows that the difference between cost and revenue (expressed as a percentage of GDP) from dedicated payroll taxes, income taxation of benefits, and premiums will grow rapidly through the 2030s as the baby-boom generation reaches retirement age, under the assumption that scheduled benefits will be paid even in the absence of an increase in dedicated tax revenues. 4 This imbalance would result in vastly increasing pressure on the unified Federal budget, with such financing requirements equaling 4.2 percent of GDP by 2040.
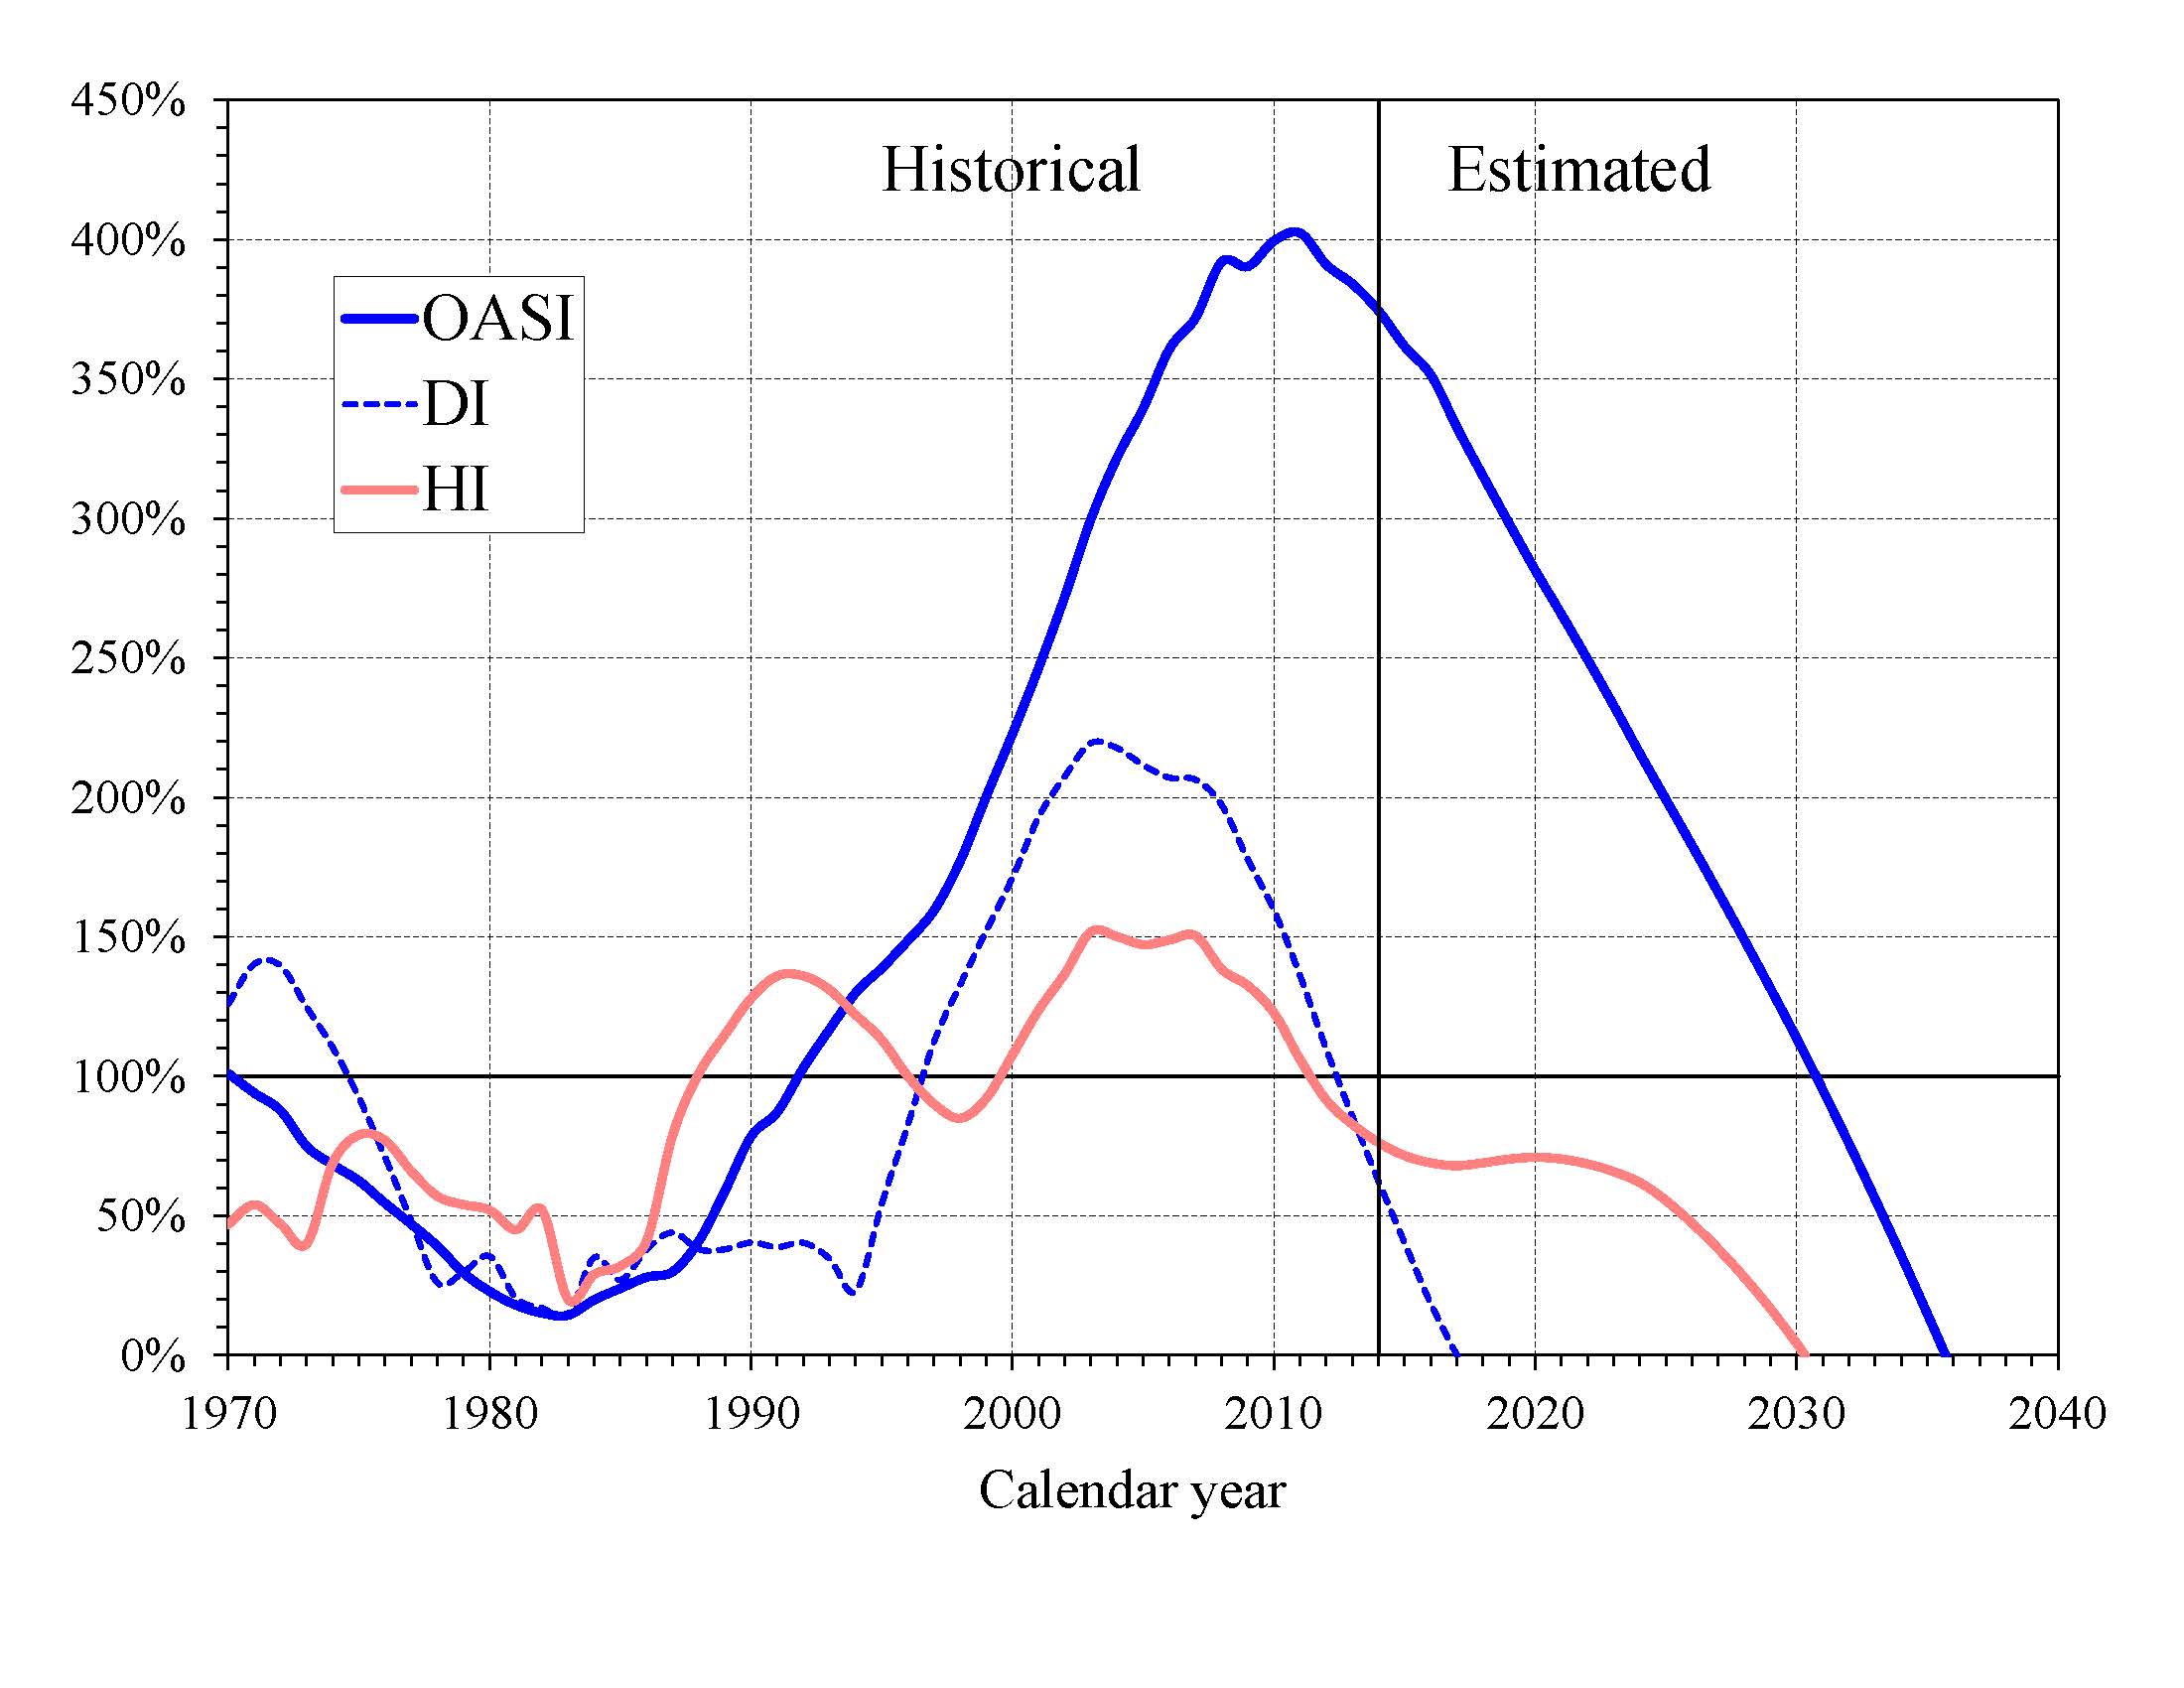
What Is the Outlook for Short-Term Trust Fund Adequacy? The reports measure the short-range adequacy of the OASI, DI, and HI Trust Funds by comparing fund asset reserves at the start of a year to projected costs for the ensuing year (the “trust fund ratio”). A trust fund ratio of 100 percent or more—that is, asset reserves at least equal to projected cost for the year—is a good indicator of a fund’s short-range adequacy. That level of projected reserves for any year suggests that even if cost exceeds income, the trust fund reserves, combined with annual tax revenues, would be sufficient to pay full benefits for several years.
By this measure, the OASI Trust Fund is financially adequate throughout and beyond the short-range period (2015-24) period, but the DI Trust Fund fails the short-range test because its estimated trust fund ratio was 40 percent at the beginning of 2015, with projected depletion of all reserves in late 2016.
The HI Trust Fund also does not meet the short-range test of financial adequacy; its trust fund ratio was 72 percent at the beginning of 2015 based on the year’s anticipated expenditures, and the projected ratio does not rise to 100 percent within five years. Projected HI Trust Fund asset reserves become fully depleted in 2030. Chart E shows the trust fund ratios through 2040 under the intermediate assumptions.
The Trustees apply a less stringent annual “contingency reserve” test to SMI Part B asset reserves because (i) the financing for that account is set each year to meet expected costs, and (ii) the overwhelming portion of the financing for that account consists of general revenue contributions and beneficiary premiums, which were 73 percent and 25 percent of total Part B income in calendar year 2014. Part D premiums paid by enrollees and the amounts apportioned from the General Fund of the Treasury are determined each year. Moreover, flexible appropriation authority typically established by lawmakers for Part D allows additional General Fund financing if costs are higher than anticipated, limiting the need for a contingency reserve in that account.
|
What Are Key Dates in OASI, DI, and HI Financing? The 2015 reports project that the DI, OASI, and HI Trust Funds will all be depleted within the next 20 years. The following table shows key dates for the respective trust funds as well as for the theoretical combined OASDI trust funds. 5
| OASI | DI | OASDIa | HI | |
|---|---|---|---|---|
| Year of peak trust fund ratiob | 2011 | 2003 | 2008 | 2003 |
| First year outgo exceeds income excluding interestc | 2010 | 2005 | 2010 | 2021 |
| First year outgo exceeds income including interestc | 2022 | 2009 | 2020 | 2023 |
| Year trust funds are depleted | 2035 | 2016 | 2034 | 2030 |
a Column entries represent key dates for the hypothetical combined OASI and DI funds.
b Dates pertain to the post-2000 period.
c Dates indicate the first year that a condition is projected to occur and to
persist annually thereafter through 2088.
DI Trust Fund asset reserves, which have been declining since 2008, are projected to be fully depleted in late 2016, as reported last year. Payment of full DI benefits beyond 2016, when tax income would cover only 81 percent of scheduled benefits, will require legislation to address the financial imbalance. The OASI Trust Fund, when considered separately, has a projected reserve depletion date of 2035, one year later than in last year’s report. At that time income would be s ufficient to pay 77 percent of scheduled OASI benefits.
The theoretical combined OASDI trust funds have a projected depletion date of 2034, one year later than indicated in last year’s report. After the depletion of reserves, continuing tax income would be sufficient to pay 79 percent of scheduled benefits in 2034 and 73 percent in 2089.
The OASDI reserves are projected to grow in 2015 because anticipated interest earnings ($93 billion in 2015) still exceed the non-interest income deficit ($84 billion). This year’s report indicates that annual OASDI income, including payments of interest to the trust funds from the General Fund, will exceed annual cost every year until 2020, increasing the nominal value of combined OASDI trust fund asset reserves. The trust fund ratio (the ratio of projected reserves to annual cost) will continue to decline gradually (Chart E), as it has since 2008, despite this nominal balance increase. Beginning in 2020, net redemptions of trust fund asset reserves with General Fund payments will be required until projected depletion of these reserves in 2034.sset reserves with General Fund payments will be required until projected depletion of these reserves in 2034.
The projected HI Trust Fund depletion date is 2030, unchanged from last year’s report. Under current law, scheduled HI tax and premium income would be sufficient to pay 86 percent of estimated HI cost after trust fund depletion in 2030, declining to 79 percent by 2039, and then gradually increasing to 84 percent by 2089.
This report anticipates that HI Trust Fund reserve assets will increase by $2.0 billion in 2015 because interest earnings ($9 billion) will exceed the non-interest income deficit ($7 billion). Annual non-interest HI income is projected to exceed expenditures from 2017 through 2020, after which annual shortfalls reappear and persist through the remainder of the long-range projection period.
What is the Long-Range Actuarial Balance of the OASI, DI, and HI Trust Funds? Another way to view the outlook for payroll tax-financed trust funds (OASI, DI, and HI) is to consider their actuarial balances for the 75-year valuation period. The actuarial balance measure includes the trust fund asset reserves at the beginning of the period, an ending fund balance equal to the 76th year’s costs, and projected costs and income during the valuation period, all expressed as a percentage of taxable payroll for the 75-year projection period. Actuarial balance is not an informative concept for the SMI program because Federal law sets premium increases and general revenue transfers at the levels necessary to bring SMI into annual balance.
The actuarial deficit represents the average amount of change in income or cost that is needed throughout the valuation period in order to achieve actuarial balance. The actuarial balance equals zero if cost for the period can be met for the period as a whole and trust fund asset reserves at the end of the period are equal to the following year’s cost. The OASI, DI, and HI Trust Funds all have long-range actuarial deficits under the intermediate assumptions, as shown in the following table.
| OASI | DI | OASDI | HI | |
|---|---|---|---|---|
| Actuarial deficit | 2.37 | 0.31 | 2.68 | 0.68 |
The Trustees project that the annual deficits for Social Security as a whole, expressed as the difference between the cost rate and income rate for a particular year, will decline from 1.31 percent of taxable payroll in 2015 to 0.98 percent in 2017 before increasing steadily to 3.52 percent in 2038. Annual deficits then decline slightly to 3.32 percent in 2050 before resuming an upward trajectory and reaching 4.65 percent of taxable payroll in 2089 (Chart B). The relatively large annual variations in deficits indicate that a single tax rate increase for all years starting in 2015 sufficient to achieve actuarial balance would result in sizable annual surpluses early in the period followed by increasing deficits in later years. Sustained solvency would require payroll tax rate increases or benefit reductions (or a combination thereof) by the end of the period that are substantially larger than those needed on average for this report’s long-range period (2015-89).
The Trustees project that the HI cost rate will exceed the income rate in 2015 by 0.05 percent of taxable payroll, followed by a period of small tax-income surpluses in 2016 through 2021. Deficits subsequently re-emerge to grow rapidly with the aging of the baby boom population through about 2045, when the annual deficit reaches a peak of 1.03 percent of taxable payroll. Annual deficits then decline to 0.82 percent of payroll by 2060 and remain in the range of 0.80 to 0.90 percent of taxable payroll through 2089.
The financial outlooks for both OASDI and HI depend on a number of demographic and economic assumptions. Nevertheless, the actuarial deficit in each of these programs is large enough that averting trust fund depletion under current-law financing is extremely unlikely. An analysis that allows plausible random variations around the intermediate assumptions employed in the report indicates that OASDI trust fund depletion is highly probable by mid-century.
How Has the Financial Outlook for Social Security and Medicare Changed Since Last Year? Under the intermediate assumptions, the combined OASDI trust funds have a projected 75-year actuarial deficit equal to 2.68 percent of taxable payroll, 0.20 percentage point smaller than last year’s estimate. The anticipated depletion date for the theoretical combined asset reserves is 2034. If the assumptions, methods, starting values, and the law had remained unchanged from last year, the actuarial deficit would have increased by about 0.06 percent of payroll due to advancing the valuation date by one year and including the year 2089. Changes in methods (for example, improved earnings projections for future beneficiaries), updated starting values, and revised economic assumptions (for example, an increased average real wage differential) account for most of the net decline in the actuarial deficit.
Medicare’s HI Trust Fund has a long-range actuarial deficit equal to 0.68 percent of taxable payroll under the intermediate assumptions, 0.19 percentage point smaller than reported last year. This improvement is primarily due to a reduction in projected long-range health care cost growth based on 1) changed assumptions about the effect of increases in income, technology, and health care prices on health care costs (0.23 percent of payroll), and 2) provider payment reductions due to legislation (0.03 percent of payroll). Partly offsetting these gains, by -0.07 percent of payroll, was an increase in the projected number of beneficiaries enrolled in Medicare Advantage plans, where benefits are more costly. The projected date of depletion of the HI Trust Fund remains 2030.
What Are the Trust Funds? Congress established trust funds managed by the Secretary of the Treasury to account for Social Security and Medicare income and disbursements. The Treasury credits Social Security and Medicare taxes, premiums, and other income to the funds. There are four separate trust funds. For Social Security, the Old-Age and Survivors Insurance (OASI) Trust Fund pays retirement and survivors benefits and the Disability Insurance (DI) Trust Fund pays disability benefits. (OASDI is the designation for the two trust funds when they are considered on a theoretical combined basis.) For Medicare, the Hospital Insurance (HI) Trust Fund pays for inpatient hospital and related care. The Supplementary Medical Insurance (SMI) Trust Fund comprises two separate accounts: Part B, which pays for physician and outpatient services, and Part D, which covers the prescription drug benefit.
The only disbursements permitted from the funds are benefit payments and administrative costs. Federal law requires that all excess funds be invested in interest-bearing securities backed by the full faith and credit of the United States. The Department of the Treasury currently invests all program revenues in special non-marketable securities of the U.S. Government which earn interest equal to rates on marketable securities with durations defined in law. The balances in the trust funds, which represent the accumulated value, including interest, of all prior program annual surpluses and deficits, provide automatic authority to pay benefits.
How Are Social Security and Medicare Financed? For OASDI and HI, the major source of financing is payroll taxes on earnings paid by employees and their employers. Self-employed workers pay the equivalent of the combined employer and employee tax rates. During 2014, an estimated 166 million people had earnings covered by Social Security and paid payroll taxes; for Medicare the corresponding figure was 169.6 million. Current law establishes payroll tax rates for OASDI, which apply to earnings up to an annual maximum ($118,500 in 2015) that ordinarily increases with the growth in the nationwide average wage. In contrast to OASDI, covered workers pay HI taxes on total earnings. The scheduled payroll tax rates (in percent) for 2015 are:
| OASI | DI | OASDI | HI | Total | |
|---|---|---|---|---|---|
| Employees | 5.30 | 0.90 | 6.20 | 1.45 | 7.65 |
| Employers | 5.30 | 0.90 | 6.20 | 1.45 | 7.65 |
| Combined total | 10.60 | 1.80 | 12.40 | 2.90 | 15.30 |
Self-employed persons pay the combined rates. The Affordable Care Act applies an additional HI tax equal to 0.9 percent of earnings over $200,000 for individual tax return filers, and on earnings over $250,000 for joint return filers.
Taxation of Social Security benefits is another source of income for the Social Security and Medicare trust funds. Beneficiaries with incomes above $25,000 for individuals (or $32,000 for married couples filing jointly) pay income taxes on up to 50 percent of their benefits, with the revenues going to the OASDI trust funds. This income from taxation of benefits made up about 3 percent of Social Security’s income in 2014. Those with incomes above $34,000 (or $44,000 for married couples filing jointly) pay income taxes on up to 85 percent of benefits, with the additional revenues going to the Medicare trust fund. This income from taxation of benefits made up about 7 percent of HI Trust Fund income in 2014.
The trust funds also receive income from interest on their accumulated reserves, which are invested in U.S. Government securities. In 2014, interest income made up 11 percent of total income to the OASDI trust funds, 3 percent for HI, and less than 1 percent for SMI.
Payments from the General Fund currently finance about 75 percent of SMI Part B and Part D costs, with most of the remaining costs covered by monthly premiums charged to enrollees or in the case of low-income beneficiaries, paid on their behalf by Medicaid for Part B and Medicare for Part D. Part B and Part D premium amounts are determined by methods defined in law and increase as the estimated costs of those programs rise.
In 2015, the Part B standard monthly premium is $104.90. There are also income-related premium surcharges for Part B beneficiaries whose modified adjusted gross income exceeds a specified threshold. In 2015 through 2019, the threshold is $85,000 for individual tax return filers and $170,000 for joint return filers. Income-related premiums range from $146.90 to $335.70 per month in 2015.
In 2015, the Part D “base monthly premium” is $33.13. Actual premium amounts charged to Part D beneficiaries depend on the specific plan they have selected and average around $32 for standard coverage. Part D enrollees with incomes exceeding the thresholds established for Part B must pay income-related monthly adjustment amounts in addition to their normal plan premium. For 2015, the adjustments range from $12.30 to $70.80 per month. Part D also receives payments from States that partially compensate for the Federal assumption of Medicaid responsibilities for prescription drug costs for individuals eligible for both Medicare and Medicaid. In 2015, State payments will cover about 9 percent of Part D costs.
Who Are the Trustees? There are six Trustees, four of whom serve by virtue of their positions in the Federal Government: the Secretary of the Treasury, the Secretary of Labor, the Secretary of Health and Human Services, and the Commissioner of Social Security. The other two Trustees are public representatives appointed by the President and confirmed by the Senate: Charles P. Blahous III, Senior Research Fellow at the Mercatus Center and Research Fellow at the Hoover Institution, and Robert D. Reischauer, President Emeritus and Distinguished Fellow of the Urban Institute.
2 As noted earlier in this summary, if trust fund depletion actually occurred as projected for HI in 2030 and for theoretical combined OASDI in 2034, each program could pay benefits thereafter only up to the amount of continuing dedicated revenues. Chart D, by contrast, compares dedicated sources of tax and premium income with the full cost of paying scheduled benefits under each program. In practice, lawmakers have never allowed the asset reserves of the Social Security or Medicare HI trust funds to become depleted.
3 This difference is projected on a cash rather than the incurred expenditures basis applied elsewhere in the long-range projections, except where explicitly noted otherwise.
4 As previously noted, this scenario would require a change in law to allow for the timely payment of all scheduled benefits upon trust fund depletion.
5 HI results in this section of the Summary are on a cash rather than the incurred expenditures basis.
A MESSAGE FROM THE PUBLIC TRUSTEES
Participation in our fifth annual Trustees Reports provides an opportunity to reflect on the great privilege it has been to serve as Public Trustees for the Social Security and Medicare trust funds. Not only do the Social Security and Medicare programs remain exceptional public policy achievements, but also we have found that the Trustees’ process itself accords with the highest standards of public service. The ex officio Trustees and their capable staffs with whom we have worked have invariably approached their responsibilities with an attitude of respect for a process that well serves lawmakers and the public. The same can be said of the independent and tirelessly working Chief Actuaries at the Social Security Administration and Centers for Medicare & Medicaid Services and their skilled staffs.We have also benefited tremendously from the insights of the Social Security and Medicare technical panels that have reviewed the assumptions and methodologies underlying the annual reports. Although only time will allow us to judge the accuracy of the Trustees’ long-term projections, it is not too soon for us to vouch for the methodological rigor, objectivity, and integrity with which the work has been conducted.
As noted in last year’s Message, the public trustee positions were created pursuant to a recommendation of the 1983 Greenspan Commission, based on its view that “the presence of such public members would inspire more confidence in the investment procedure” for trust fund assets. This recommendation followed the Commission’s finding that the trust fund investment procedures were “equitable to both the trust funds and the General Fund of the Treasury.” It preceded the Commission recommendation on budget procedures to “make clear the effect and presence of any payments from the General Fund of the Treasury to the Social Security program.” While it emphasized the usefulness of public trustees in monitoring these interactions, the Commission also opined that establishing public trustees “would help to assure that the demographic and economic assumptions for the cost estimates of the future operations of the program would continue to be developed in an objective manner.”
Our positions thus require that we monitor several important aspects of Social Security and Medicare financing. The language of the Social Security Act, statements of influential legislators and commission members, and the structures of the Social Security and Medicare programs themselves, all convey that a positive trust fund balance is a necessary but insufficient condition for financial viability. To ensure that these programs function adequately, policy makers will need to consult other information in our reports beyond the mere projected duration of trust fund adequacy. This is true for both Social Security and Medicare, though the underlying considerations are distinct in each case.
The importance of financial information beyond a trust fund’s solvency status is most readily apparent in Medicare, a significant portion of which is kept automatically solvent by statutory design. For example, lawmakers have long required that the Trustees provide an annual report on the finances of Medicare’s Supplemental Medical Insurance (SMI) Trust Fund, using statutory terminology similar to that used for the Social Security and Hospital Insurance trust funds despite the fact that, in contrast to these other trust funds, the SMI fund can never be depleted. By this and other actions, lawmakers have conveyed to the Trustees a desire for a range of pertinent financial information. In the specific case of SMI, financing strains are manifested not in a threat of Trust Fund reserve depletion but in rising costs facing premium payers as well as the Federal Government’s General Fund. The budgetary pressures that arise from maintaining Trust Fund solvency are among the issues about which the annual Trustees Reports are intended to inform lawmakers and the public.
With Social Security, much of the need to look more critically at program finances arises from the pattern of trust fund operations that has developed over time. Throughout much of Social Security’s early history annual income and outgo were kept in reasonably proximate annual balance, such that when the Trust Funds faced a threat of depletion in the early 1980s it was still fully possible, though difficult to be sure, to close the financing gap. After the 1977 and 1983 program amendments, Social Security experienced substantial surpluses of tax income relative to expenditures from the late 1980s through the 2000s. Notwithstanding the fact that the aggregate program has been running annual cash deficits since 2010, these surpluses have accumulated to a substantial positive balance in the hypothetical combined trust funds, one that will peak in 2019 and then decline gradually to depletion in 2034. A critical unintended consequence of large trust fund balances has been that unavoidable corrective actions have been postponed. Continued inaction going forward to the point where the combined trust funds near depletion would—unlike the situation in 1983—likely preclude any plausible opportunity to maintain Social Security’s historical financing structure.
To appreciate these dangers, consider that under the Trustees’ current projections, annual Social Security costs will be more than 25 percent higher than income by 2034. There is no historical precedent for closing annual gaps of this size within the space of just a few years. As the Trustees Report notes, even the total elimination of Social Security benefits for those newly eligible in 2034 would be insufficient to restore short-term financial balance. Similarly, a payroll tax increase of the magnitude needed to maintain scheduled benefits would have a profound adverse impact on the economy and employment. Thus, while legislative action is not yet necessary to prevent imminent reductions in Old-Age and Survivors Insurance (OASI) benefits (the immediate threat being confined to disability benefits), prompt action is needed to prevent Social Security’s aggregate financial shortfall from growing to an intractable size.
The imminent depletion of Social Security’s Disability Insurance (DI) Trust Fund reserves is but the first financing crisis arising from program cost growth trends that have been evident for the past few decades. Social Security DI faces unique policy challenges that lawmakers should address, distinct from those facing the OASI Trust Fund. At the same time, however, the projected imbalance of the OASI Trust Fund is larger in both absolute and relative terms than that facing the DI fund and arises from many of the same sources.
Conflicting considerations arise from these factors. At this late date, it is impracticable to reduce DI costs sufficiently to prevent imminent Trust Fund depletion (and thus, sudden benefit reductions for highly vulnerable individuals) without at least a temporary increase in DI Trust Fund resources, irrespective of its source or combination with other measures. But on the other hand, DI already receives a higher share of the Social Security payroll tax relative to its projected obligations, than does OASI. Moreover, past DI income increases have generally been enacted in the context of legislation affecting projected program outlays, the sole recent exception in 1994 being preceded by a Trustees’ warning that a further reallocation to DI from OASI “would ultimately raise concern about the financial viability of the retirement and survivors program.” Any necessary resource reallocation that does occur should not be regarded as a substitute for action to sustain the finances of DI and Social Security as a whole, nor enacted in a manner that has the effect of further postponing those required corrections.
Several years of delay in legislating financing corrections has led to the current situation in which there are few options for preventing sudden DI benefit reductions affecting many of our society’s most vulnerable members. Substantial further delay in enacting financial repairs to Social Security as a whole would compound these problems, creating uncertainty on an even larger scale for millions of vulnerable OASI beneficiaries and taxpayers, and leaving even less palatable options than now exist.
Though Medicare has long been considered the relatively more difficult financing challenge, by some measures it is in better financial shape than Social Security. Medicare’s actuarial imbalance is smaller and its Hospital Insurance Trust Fund depletion date (2030) is substantially more distant than that facing Social Security’s DI fund (2016). But two important factors complicate this picture. One is that, as earlier noted, Medicare SMI is constructed to remain solvent by statutory design. Thus the absence of a projected SMI Trust Fund depletion date does not by itself signify that Medicare is free from financing strains. Instead, these pressures are simply manifested in different ways—as projected financial burdens on Federal income taxpayers and Medicare premium payers.
The other important factor is that the relatively smaller size of Medicare’s financing gap depends in large part on sustaining ambitious cost-containment provisions under current law whose effectiveness has yet to be fully tested over the long term. Irrespective of whether one supported or opposed the enactment of these provisions, Medicare participants and those with insurance obtained through employers, unions and exchanges share a common stake in their success. If these provisions were to be scaled back or repealed, other more aggressive savings measures would need to be enacted in their place. Because even under current projections Medicare faces a substantial financing gap, we will need all of current law’s cost containment and more to ensure that it remains on a financially secure footing.
We hope that the information contained in these reports will prove useful to policy makers as they undertake the important work of strengthening Social Security and Medicare finances.
Trustee.
Trustee.