Status of the Social Security and Medicare Programs
A SUMMARY OF THE 2022 ANNUAL REPORTS
Social Security and Medicare Boards of TrusteesEach year the Trustees of the Social Security and Medicare trust funds report on the current and projected financial status of the two programs. The Trustees Reports include extensive information about the current operations of these important social insurance programs and careful analysis of their outlook. We believe the reports fully and fairly present the current and projected financial condition of the programs. This summary of the 2022 reports presents results based on the intermediate set of assumptions, which represents our best estimates of likely future demographic, economic, and program-specific conditions.1
Social Security and Medicare both face long-term financing shortfalls under currently scheduled benefits and financing. Costs of both programs will grow faster than gross domestic product (GDP) through the mid-2030s primarily due to the rapid aging of the U.S. population. Medicare costs will continue to grow faster than GDP through the late 2070s due to projected increases in the volume and intensity of services provided.
The projections presented include our best estimates of the effects of the COVID-19 pandemic. Economic recovery from the 2020 recession has been stronger and faster than assumed in last year's reports, with positive effects on the projected actuarial status of the trust funds in these reports.
At this time, there is no consensus among experts on the lasting effects of the COVID-19 pandemic. We currently assume that the pandemic will have no net effect on our long-range projections. In addition, the assumptions for this report were determined in mid-February 2022. Developments since then have added to the uncertainty regarding the path of the COVID-19 pandemic and the economy in the near-term. The Trustees will continue to monitor these and any future developments and modify the projections in later reports as appropriate.
Based on our best estimates, the 2022 reports determine:
• The Old-Age and Survivors Insurance (OASI) Trust Fund, which pays retirement and survivors benefits, will be able to pay scheduled benefits on a timely basis until 2034, one year later than reported last year. At that time, the fund's reserves will become depleted and continuing tax income will be sufficient to pay 77 percent of scheduled benefits.
• The Disability Insurance (DI) Trust Fund, which pays disability benefits, is no longer projected to be depleted within the 75-year projection period. By comparison, last year's report projected that it would be able to pay scheduled benefits only until 2057.
• The OASI and DI funds are separate entities under law. The report also presents information that combines the reserves of these two funds in order to illustrate the actuarial status of the Social Security program as a whole. The hypothetical combined OASI and DI funds would be able to pay scheduled benefits on a timely basis until 2035, one year later than reported last year. At that time, the combined funds' reserves will become depleted and continuing tax income will be sufficient to pay 80 percent of scheduled benefits.
• The Hospital Insurance (HI) Trust Fund, or Medicare Part A, which helps pay for services such as inpatient hospital care, will be able to pay scheduled benefits until 2028, two years later than reported last year. At that time, the fund's reserves will become depleted and continuing total program income will be sufficient to pay 90 percent of total scheduled benefits.
• The Supplemental Medical Insurance (SMI) Trust Fund is adequately financed into the indefinite future because current law provides financing from general revenues and beneficiary premiums each year to meet the next year's expected costs. Due to these funding provisions and the rapid growth of its costs, SMI will place steadily increasing demands on both taxpayers and beneficiaries.
• For the sixth consecutive year, the Trustees are issuing a determination of projected excess general revenue Medicare funding, as is required by law whenever annual tax and premium revenues of the combined Medicare funds will be below 55 percent of projected combined annual outlays within the next 7 fiscal years. Under the law, two such consecutive determinations of projected excess general revenue consitute a "Medicare funding warning." Under current law and the Trustees' projections, such determinations and warnings will recur every year through the 75-year projection period.
Key Changes Since Last Year
The long-range 75-year actuarial deficit of the combined OASI and DI trust funds decreased from 3.54 to 3.42 percent of taxable payroll since the 2021 reports.2 As shown in Table 1, this result was due to the combined effects of changes in methodology, legislation, regulation, economic, demographic, and programmatic assumptions, and recent observed experience. The following changes had the largest effects on the actuarial deficit.
• One long-range ultimate assumption was changed. The disability incidence rate was reduced from 5.0 to 4.8 per thousand individuals who meet insured requirements but who are not receiving benefits, reflecting that program applications and incidence rates have continued to decline in recent years from a peak in 2010.
• Changes were made to near-term demographic data and assumptions to reflect updated birth and immigration data and to better reflect the expected effects of the recovery from the pandemic.
• Changes were made to near-term economic data and assumptions reflecting that the recovery of employment, earnings, and GDP from the 2020 recession has been faster and stronger than projected in last year's report, resulting in higher payroll tax receipts and higher revenue from income taxation of Social Security benefits. Real interest rates are projected to be slightly higher in the near term, lowering the present value of projected future deficits.
• The 75-year valuation period advanced from 2021-95 to 2022-96.
| Item | OASI | DI | OASDI |
|---|---|---|---|
| Actuarial balance shown in the 2021 Report | -3.46 | -0.08 | -3.54 |
| Changes in actuarial balance due to changes in: | Legislation / Regulation | .00 | .00 | .00 |
| Valuation period | -.05 | -.01 | -.06 |
| Demographic data and assumptions | -.04 | .00 | -.04 |
| Economic data and assumptions | .13 | .00 | .13 |
| Disability data and assumptions | .00 | .08 | .07 |
| Methods and programmatic data | .01 | .00 | .01 |
| Total change in actuarial balance | .05 | .07 | .12 |
| Actuarial balance shown in the 2022 Report | -3.41 | -.01 | -3.42 |
Note: Totals do not necessarily equal the sums of components due to rounding. A negative actuarial balance is a deficit.
The long-range 75-year actuarial deficit of the HI Trust Fund decreased from 0.77 to 0.70 percent of taxable payroll. As shown in Table 2, this result was due to the combined effects of economic, demographic, and programmatic assumptions, including the changes discussed above for OASDI, as well as adjustments to assumptions about private health plan spending.
| HI | |
|---|---|
| Actuarial balance shown in the 2021 Report | -0.77 |
| Changes in actuarial balance due to changes in: | Valuation period | -.01 |
| Base estimate | .00 |
| Private health plan assumptions | .07 |
| Hospital assumptions | -.03 |
| Other provider assumptions | -.02 |
| Other economic and demographic assumptions | .06 |
| Total change in actuarial balance | .07 |
| Actuarial balance shown in the 2022 Report | -.70 |
Note: A negative actuarial balance is a deficit.
Conclusion
Lawmakers have many policy options that would reduce or eliminate the long-term financing shortfalls in Social Security and Medicare. Taking action sooner rather than later will allow consideration of a broader range of solutions and provide more time to phase in changes so that the public has adequate time to prepare.
By law, there are six Trustees, four of whom serve by virtue of their positions in the Federal Government: the Secretary of the Treasury, the Secretary of Labor, the Secretary of Health and Human Services, and the Commissioner of Social Security. The other two Trustees are public representatives appointed by the President, subject to confirmation by the Senate. The two Public Trustee positions have been vacant since 2015.
2 The 75-year actuarial balance is a summary measure that calculates the difference between the projected summarized income rate and the summarized cost rate of the trust funds as a percentage of taxable payroll. When that balance is negative, or in "deficit," projected income over the long-range valuation period (2022-96 for the 2022 reports) plus any trust fund reserves at the start of the period are insufficient to pay all program costs over the period and leave an adequate "contingency reserve" at the end of the period.
By the Trustees:
Secretary of the Treasury,
and Managing Trustee of the Trust Funds.
Xavier Becerra,
Secretary of Health and Human Services,
and Trustee.
Secretary of Labor,
and Trustee.
Kilolo Kijakazi,
Acting Commissioner of Social Security,
and Trustee.
This summary of the 2022 annual reports presents results based on the intermediate set of assumptions, which represents the Trustees’ best estimates of likely future demographic, economic, and program-specific conditions. The COVID-19 pandemic has had significant effects on the finances of both the Social Security and Medicare programs in the near term. The economic recovery from the brief 2020 recession has been stronger and faster than assumed in last year’s reports. The Trustees project that the pandemic and recession will have little effect on the long-term actuarial status of both programs. With the course of the pandemic still uncertain, the Trustees will continue to monitor developments and modify the projections accordingly in future reports.
At the end of 2021, Social Security’s trust fund reserves were $2,852 billion, having decreased by $56 billion over the year. The Trustees project that the Old-Age and Survivors Insurance (OASI) Trust Fund will be able to pay full benefits on a timely basis until 2034, a year later than in last year’s Social Security report. For the first time since the 1983 Trustees Report, the Disability Insurance (DI) Trust Fund is projected to be able to pay full benefits through the end of the 75-year projection period (2096 for this year’s report). Last year’s report projected DI Trust Fund depletion in 2057. The DI Trust Fund’s reserve depletion date is very sensitive to changes in program cash flows and the Trustees have lowered anticipated long-range disability incidence rates in this year’s report. The number of disabled-worker beneficiaries in current payment status continued to fall in 2021, as it has since 2014.
The projected reserve depletion date for the combined OASI and DI funds is 2035, a year later than in last year’s report.1 Over the 75-year projection period, Social Security faces an actuarial deficit of 3.42 percent of taxable payroll, decreased from the 3.54 percent figure projected last year. The main reasons for the smaller deficit are a stronger than expected recovery from the pandemic-induced recession, higher expected levels of labor productivity, and lower future disability incidence rates that reflect recent experience. The actuarial deficit equals 1.2 percent of gross domestic product (GDP) through 2096.
Reserves in Medicare’s Hospital Insurance (HI) Trust Fund increased by $9 billion to a total of $143 billion at the end of 2021 due in part to repayments of the accelerated and advance payments that were made in 2020. These repayments are assumed to continue until Spetember 2022, when the outstanding balance is expected to be fully repaid, resulting in another surplus in 2022. After that, the Trustees project deficits in all years until the Trust Fund becomes depleted in 2028.
The HI Trust Fund now has a projected depletion date of 2028, two years later than in last year’s report. HI income is projected to be higher than last year’s estimates because both the number of covered workers and average wages are projected to be higher. HI expenditures are expected to be lower in the beginning of the short-range period mainly due to the pandemic, but are projected to become larger after 2023 due to higher projected provider payment updates. For the 75-year projection period, the HI actuarial deficit has decreased to 0.70 percent of payroll from 0.77 percent in last year’s report, and is equivalent to 0.3 percent of GDP through 2096.
The Supplementary Medical Insurance (SMI) Trust Fund held $183 billion in assets at the end of 2021. The Trustees expect Parts B and D to be adequately financed over the next 10 years and beyond because income from premiums and general revenue are reset each year to cover expected costs and, for Part B, to ensure an adequate contingency reserve.
What Are the Trust Funds? Congress established trust funds managed by the Secretary of the Treasury to account for Social Security and Medicare income and disbursements. The Treasury credits Social Security and Medicare taxes, premiums, and other income to the funds. There are four separate trust funds. For Social Security, the OASI Trust Fund pays retirement and survivors benefits and the DI Trust Fund pays disability benefits. For Medicare, the HI Trust Fund pays for Part A inpatient hospital and related care. The SMI Trust Fund comprises two separate accounts: Part B, which pays for physician and outpatient services, and Part D, which covers prescription drug benefits.
The only disbursements permitted from the funds are benefit payments and administrative expenses. Federal law requires that the Trustees invest all excess funds in interest-bearing securities backed by the full faith and credit of the United States. The Department of the Treasury currently invests all program revenues in special non-marketable U.S. Government securities, which earn interest equal to rates on marketable securities with durations defined in law. The balances in the trust funds, which represent the accumulated value, including interest, of all prior program annual surpluses and deficits, provide automatic authority to pay benefits.
Who Are the Trustees? By law, there are six Trustees, four of whom serve by virtue of their positions in the Federal Government: the Secretary of the Treasury, the Secretary of Labor, the Secretary of Health and Human Services, and the Commissioner of Social Security. The other two Trustees are public representatives appointed by the President, subject to confirmation by the Senate. The two Public Trustee positions have been vacant since July 2015.
How Are Social Security and Medicare Financed? For OASDI and HI, the major source of financing is payroll taxes on earnings paid by employees and their employers. Self-employed workers pay the equivalent of the combined employer and employee tax rates. During 2021, an estimated 179.3 million people had earnings covered by Social Security and paid payroll taxes; for Medicare the corresponding figure was 183.1 million. Current law establishes payroll tax rates for OASDI, which apply to earnings up to an annual maximum ($147,000 in 2022) that ordinarily increases with the growth in the nationwide average wage. In contrast to OASDI, covered workers pay HI taxes on total earnings. The scheduled payroll tax rates (in percent) for 2022 and later are shown in Table 1.
| OASI | DI | OASDI | HI | Total | |
|---|---|---|---|---|---|
| Employees | 5.30 | 0.90 | 6.20 | 1.45 | 7.65 |
| Employers | 5.30 | 0.90 | 6.20 | 1.45 | 7.65 |
| Combined total | 10.60 | 1.80 | 12.40 | 2.90 | 15.30 |
There is an additional HI tax equal to 0.9 percent of earnings over $200,000 for individual tax return filers, and on earnings over $250,000 for joint return filers.
Taxation of Social Security benefits is another source of income for the Social Security and Medicare trust funds. Beneficiaries with incomes above $25,000 for individuals (or $32,000 for married couples filing jointly) pay income taxes on up to 50 percent of their benefits, with the revenues going to the OASDI trust funds. This income from taxation of benefits made up about 3 percent of Social Security’s income in 2021. Those with incomes above $34,000 (or $44,000 for married couples filing jointly) pay income taxes on up to 85 percent of benefits, with the additional revenues going to the HI Trust Fund. This income from taxation of benefits represented about 7 percent of HI Trust Fund income in 2021.
The trust funds also receive income from interest on their accumulated reserves, which are invested in U.S. Government securities. In 2021, interest income made up 6 percent of total income to the OASDI trust funds and less than 1 percent for both HI and SMI.
Payments from the General Fund of the U.S. Treasury financed about 79 percent of SMI Part B and Part D costs in 2021. These payments were higher than usual because the Continuing Appropriations Act, 2021 and Other Extensions Act required a transfer to Part B to cover the premium income that was lost in 2021 as a result of the legislated specification of the aged actuarial rate calculation. The money will be repaid over time. Monthly premiums paid by enrollees, or in the case of low-income beneficiaries, monthly Part B premiums paid on their behalf by Medicaid for Part B and Medicare for Part D, cover most of the remaining SMI costs. Under current law, Part B and Part D premium amounts increase as the estimated costs of those programs rise.
In 2022, the Part B standard monthly premium is $170.10. There are also income-related monthly adjustment amounts for Part B beneficiaries whose modified adjusted gross income exceeds a specified threshold. In 2022, the threshold is $91,000 for individual tax return filers and $182,000 for joint return filers. Income-related monthly adjustment amounts range from $68.00 to $408.20 per month in 2022.
In 2022, the Part D “base monthly premium” is $33.37. Actual premium amounts charged to Part D beneficiaries depend on the specific plan they have selected and are projected to average around $32 for standard coverage in 2022. Part D enrollees with incomes exceeding the thresholds established for Part B must pay income-related monthly adjustment amounts in addition to their normal plan premium. For 2022, the adjustments range from $12.40 to $77.90 per month. Part D also receives payments from States that partially compensate for the Federal assumption of Medicaid responsibilities for prescription drug costs for individuals eligible for both Medicare and Medicaid. In 2021, State payments covered about 11 percent of Part D costs.
What Were the Trust Fund Operations in 2021? At the end of 2021, 56.0 million people received OASI benefits, 9.2 million received DI benefits, and 63.8 million were enrolled under Medicare. A summary of the trust fund operations is shown below (Table 2). The OASI Trust Fund reserves declined in 2021; DI, HI, and SMI Trust Fund reserves increased.
| OASI | DI | HI | SMI | |
|---|---|---|---|---|
| Reserves (end of 2020) | $2,811.7 | $96.6 | $134.1 | $143.3 |
| Income during 2021 | 942.9 | 145.5 | 337.4 | 550.2 |
| Cost during 2021 | 1001.9 | 142.6 | 328.9 | 510.4 |
| Net change in Reserves | -59.1 | 2.8 | 8.5 | 39.7 |
| Reserves (end of 2020) | 2,752.6 | 99.4 | 142.7 | 183.0 |
Note: Totals do not necessarily equal the sums of rounded components.
Table 3 shows payments, by category, from each trust fund in 2021.
| Category | OASI | DI | HI | SMI |
|---|---|---|---|---|
| Benefit payments | $993.1 | $140.1 | $323.6 | $504.9 |
| Railroad Retirement financial interchange | 4.8 | 0.1 | — | — |
| Administrative expenses | 4.0 | 2.5 | 5.3 | 5.5 |
| Total | 1001.9 | 142.6 | 328.9 | 510.4 |
Note: Totals do not necessarily equal the sums of rounded components.
In 2021, the cost of administrative expenses, shown as a percentage of program costs from each trust fund, was:
| Source | OASI | DI | HI | SMI |
|---|---|---|---|---|
| Administrative expenses | 0.4 | 1.7 | 1.6 | 1.1 |
Trust fund income, by source, in 2021 is shown in Table 5.
| Source | OASI | DI | HI | SMI |
|---|---|---|---|---|
| Payroll taxes | $838.2 | $142.4 | $302.5 | — |
| Taxes on OASDI benefits | 37.2 | 0.5 | 25.0 | — |
| Interest earnings | 67.5 | 2.6 | 2.6 | $2.7 |
| General Fund reimbursements | a | a | 1.4 | 12.5 |
| General revenues | — | — | — | 391.4 |
| Beneficiary premiums | — | — | 4.2 | 127.9 |
| Transfers from States | — | — | — | 12.1 |
| Other | a | — | 1.7 | 3.6 |
| Total | 942.9 | 145.5 | 337.4 | 550.2 |
a Less than $50 million.
In 2021, Social Security’s total cost exceeded total income, including interest on trust fund asset reserves, by $56 billion. The Trustees project that total cost will exceed total income in all future years.
In 2021, the HI Trust Fund’s total income ($337 billion), including $3 billion of interest income (Table 5), exceeded program expenditures ($329 billion) by $9 billion as repayment began of accelerated and advance payments made from the Trust Fund to providers in 2020. Continuing repayments will result in a larger surplus in 2022. The Trustees project annual deficits for 2023 and the remainder of the projection period, with depletion of reserves in 2028. For SMI, general revenues, which are set prospectively based on projected costs, are the largest source of income.
What Is the Outlook for Short-Term Trust Fund Adequacy? The "trust fund ratio" is the value of trust fund asset reserves at the start of a year expressed as a percentage of the projected costs for the ensuing year. The Trustees measure the short-range adequacy of the OASI, DI, and HI Trust Funds with this ratio. A trust fund ratio of 100 percent or more, or a ratio that is expected to reach 100 percent within 5 years and remain at or above 100 percent through the short-range period, indicates that the fund’s reserves are adequate in the short-range. That level of projected reserves for any year suggests that even if cost exceeds income, the trust fund reserves, combined with annual tax revenues, would be sufficient to pay full benefits for several years. Chart A shows the trust fund ratios through 2096 under the intermediate assumptions.
Chart A—OASI, DI, and HI Trust Fund Ratios
[Asset reserves as a percentage of annual cost]
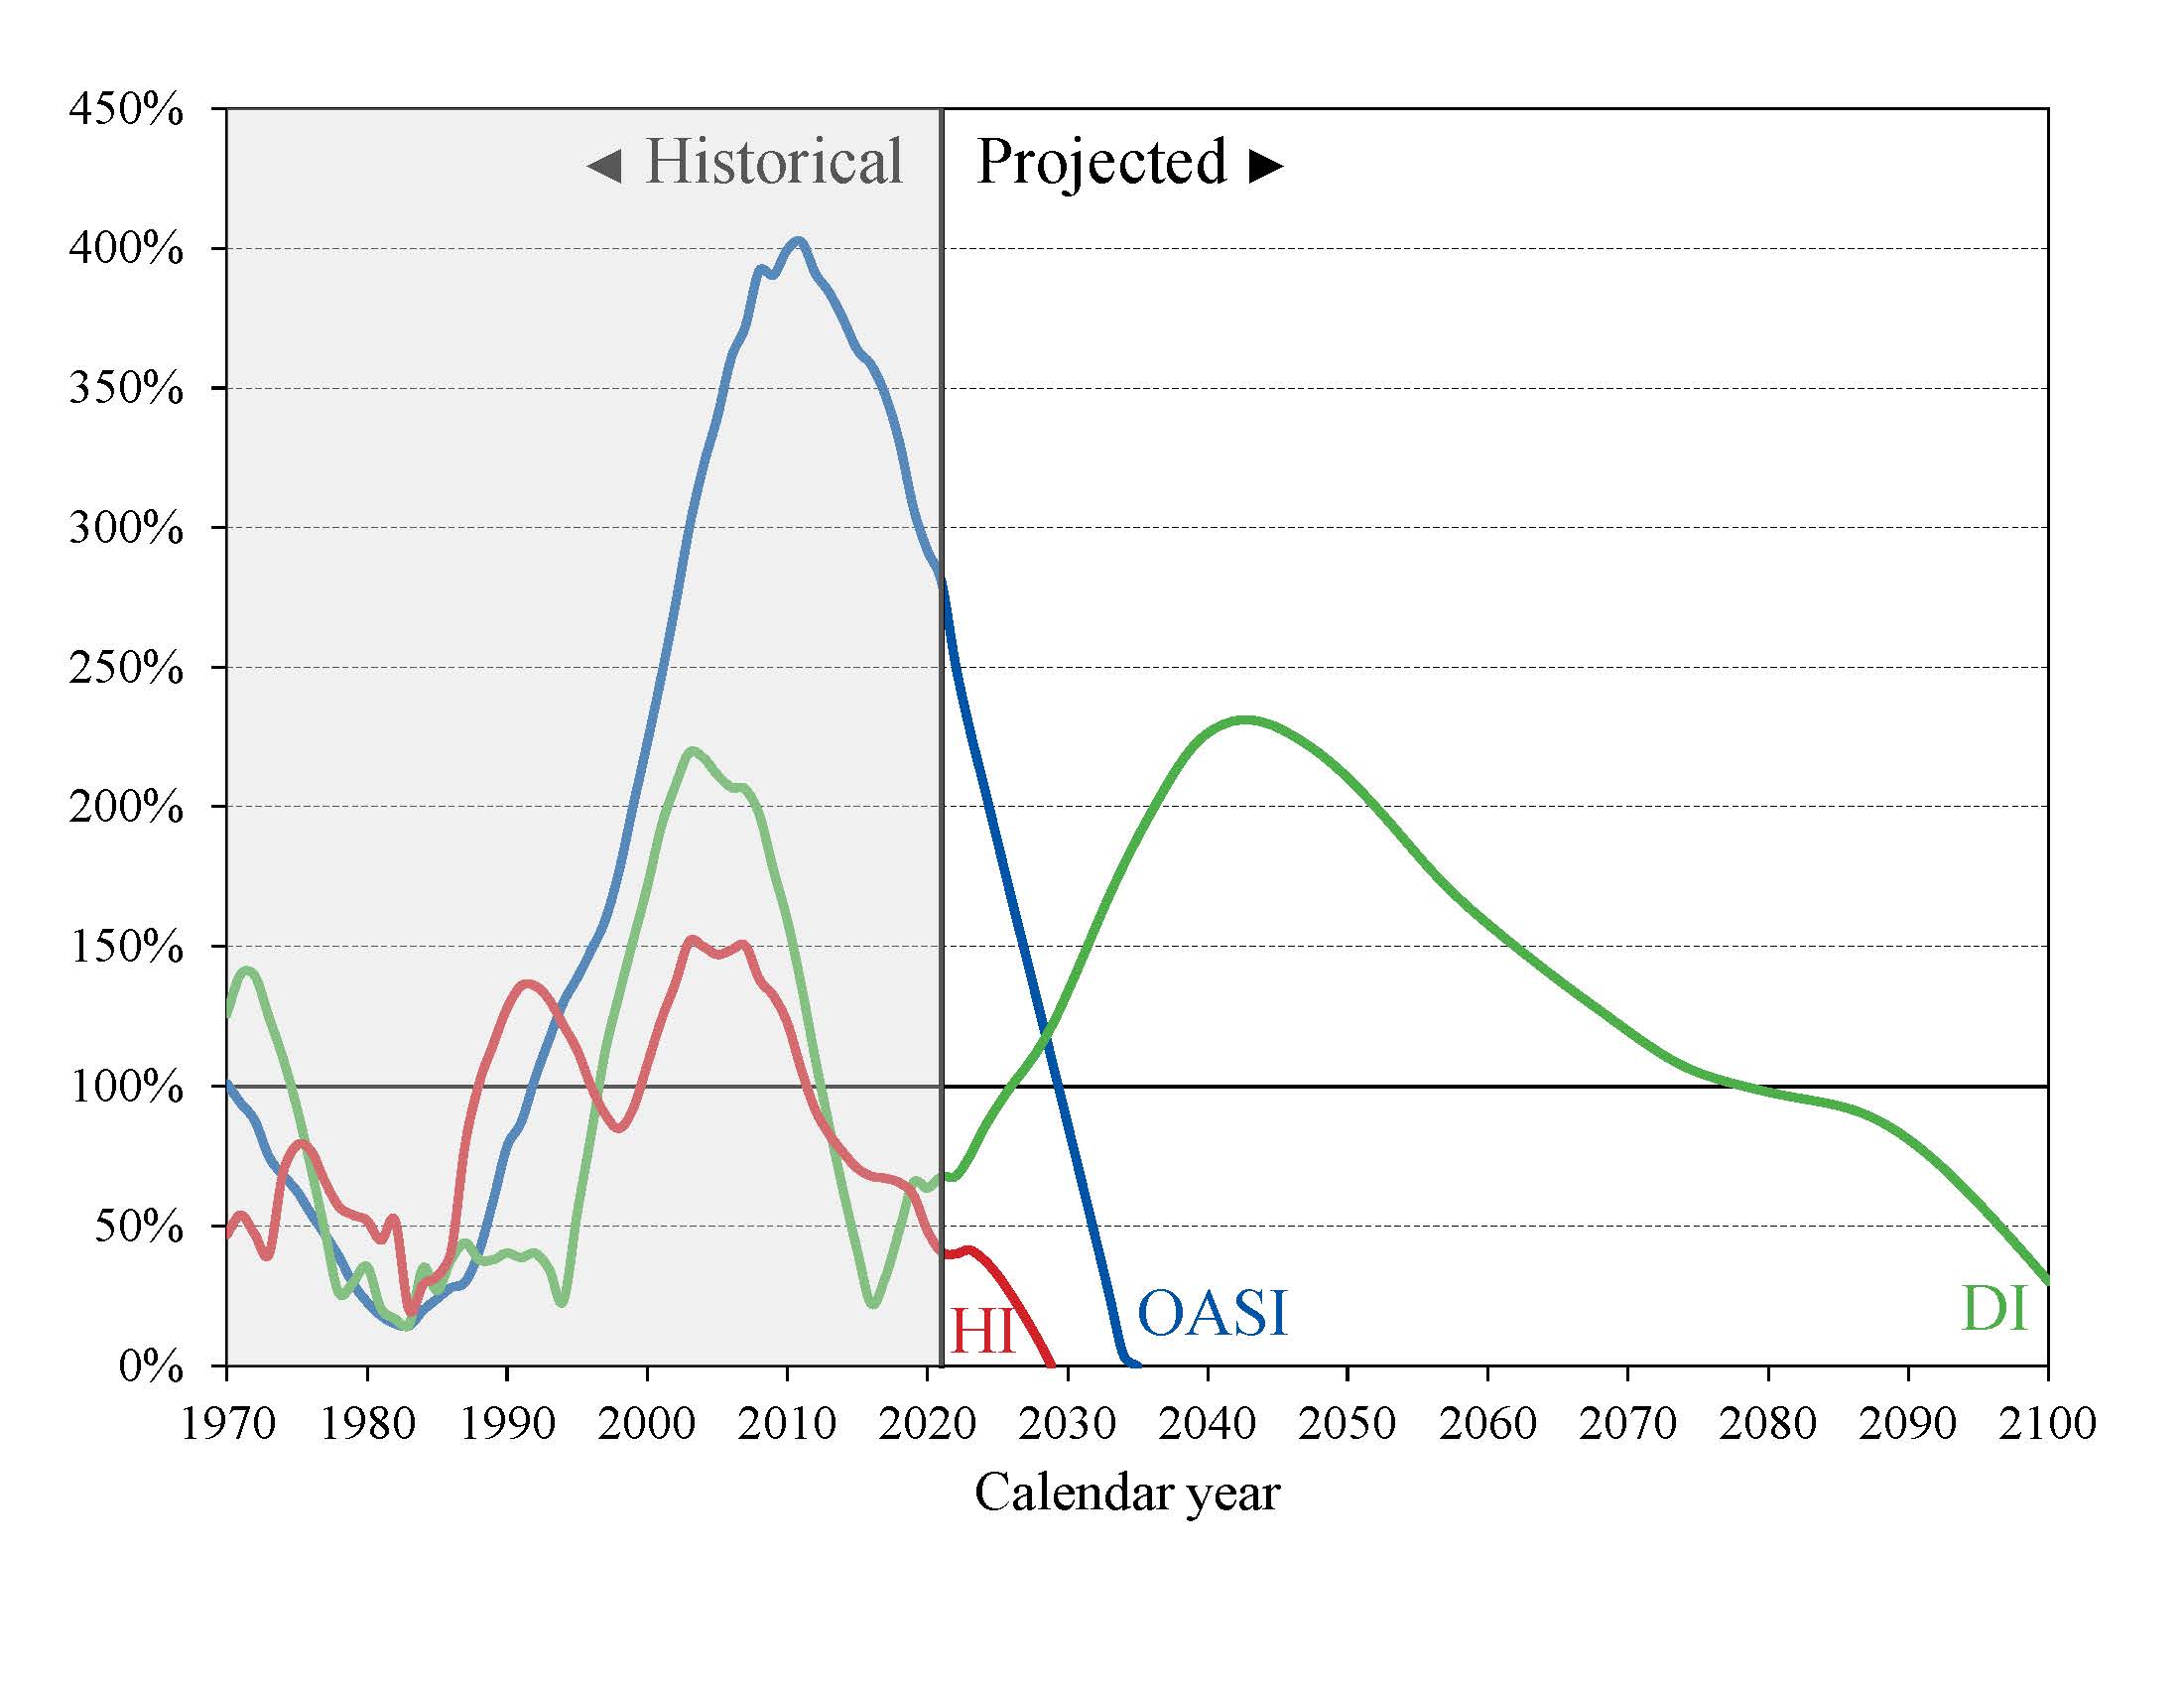
By this measure, the OASI Trust Fund is not financially adequate throughout the short-range period (2022-31). The OASI Trust Fund fails the short-range test because its trust fund ratio is projected to decline from 251 percent at the beginning of 2022 to 87 percent at the beginning of 2030. The Trustees project the DI Trust Fund to be adequately financed throughout the short-range period. Its trust fund ratio was 68 percent at the beginning of 2022 and increases to a value of 100 percent by the beginning of the fifth projected year (2026) and continues to increase for the remainder of the short-range period.
The HI Trust Fund has not met the Trustees' formal test of short-range test financial adequacy since 2003. Its trust fund ratio was 40 percent at the beginning of 2022 based on the year’s anticipated expenditures, and the projected ratio does not rise to 100 percent within 5 years. Projected HI Trust Fund asset reserves become fully depleted in 2028.
The Trustees apply a less stringent annual “contingency reserve” test to SMI Part B asset reserves because (1) the financing for that account is set each year to meet expected costs, and (2) the overwhelming portion of the financing for that account consists of transfers from the Treasury's General Fund and beneficiary premiums, which were 73 percent and 25 percent, respectively, of total Part B income in calendar year 2021.
The Centers for Medicare and Medicaid Services (CMS) calculate Part D premiums paid by enrollees based on the plan bids. Moreover, lawmakers established flexible appropriation authority for Part D to allow additional general revenue transfers if costs are higher than anticipated, limiting the need for a contingency reserve in that account.
What Are Key Dates in OASI, DI, and HI Financing? The 2022 reports project that the HI Trust Fund will be depleted in 6 years and the OASI Trust Fund in 12 years. The DI Trust Fund is projected to be adequate to pay full scheduled benefits through the end of the long-range period (2096). Table 6 shows key dates for the three trust funds as well as for the combined OASDI trust funds. 2
| OASI | DI | OASDI | HI | |
|---|---|---|---|---|
| First year cost exceeds income excluding interesta | 2010 | 2044 | 2010 | 2008 |
| First year cost exceeds total incomea | 2021 | 2090 | 2021 | 2023 |
| Year trust funds are depleted | 2034 | b | 2035 | 2028 |
a Dates indicate the first year a condition is projected to occur and to persist annually thereafter through 2096.
b The trust fund is not projected to become depleted during the 75-year period ending in 2096.
The OASI Trust Fund has a projected reserve depletion date of 2034, a year later than in last year's report. At that time, 77 percent of scheduled OASI benefits would be payable, declining to 72 percent in 2096.
The Trustees project that DI Trust Fund reserves will increase annually through 2089 before gradually declining through the end of the 75-year projection period (2096) when the trust fund ratio would equal 47 percent. Program income is sufficient to pay full scheduled benefits thoughout the long-range period.
The combined OASI and DI Trust Fund reserves have a projected depletion date of 2035, a year later than in last year’s report. After the depletion of reserves, continuing tax income would be sufficient to pay 80 percent of scheduled benefits in 2035, and 74 percent by 2096. The Trustees project that the combined OASI and DI Trust Fund reserves will continue to decrease in 2022 because total cost ($1,243 billion) is expected to exceed total income ($1,196 billion) and that OASDI total cost will continue to exceed total income each year throughout the 75-year projection period. Net redemptions of trust fund asset reserves with Treasury General Fund payments will be required to pay scheduled benefits until projected depletion of these reserves in 2035, a year later than in last year’s report.
The projected HI Trust Fund depletion date is 2028, two years later than reported last year. Under current law, scheduled HI tax and premium income would be sufficient to pay 90 percent of estimated HI cost after trust fund depletion in 2028, declining to 80 percent by 2046, and then gradually increasing to 93 percent by 2096. The Medicare report projects an increase in HI Trust Fund asset reserves in 2022 as total income ($386 billion) is expected to exceed total cost ($356 billion). Anticipated 2022 income includes net repayments of $34.4 billion for the Medicare Accelerated and Advance Payments Program. After 2022, anticipated annual HI cost exceeds program income throughout the 75-year projection period.
What is the Outlook for Future Social Security and Medicare HI Costs and Income in Relation to Taxable Earnings? Because the primary source of income for OASDI and HI is the payroll tax, it is useful in assessing the financial outlook to express the programs’ incomes and costs as percentages of taxable payroll—that is, showing their size relative to the base of worker earnings taxed to support each program (Chart B).
When interpreting Chart B, consider that the two programs have different taxable payrolls. HI taxable payroll is about 25 percent larger than that of OASDI because the HI payroll tax is imposed on all covered earnings while OASDI taxes apply only to earnings up to a maximum ($147,000 in 2022), which ordinarily is adjusted each year. Thus, the percentages in Chart B are comparable within each program, but not across programs.
Both the OASDI and HI annual cost rates rise over the long run from their 2021 levels (13.92 and 3.42 percent of taxable payroll, respectively). Projected Social Security cost grows to 18.32 percent of taxable payroll for 2078, and then decreases to 17.64 percent in 2096. The projected Medicare HI cost rate rises to 4.89 percent of taxable payroll in 2046, and thereafter remains at about that level, eventually declining slightly to 4.79 percent in 2096.
Chart B—OASDI and HI Income and Cost as Percentages
of Their Respective Taxable Payrolls
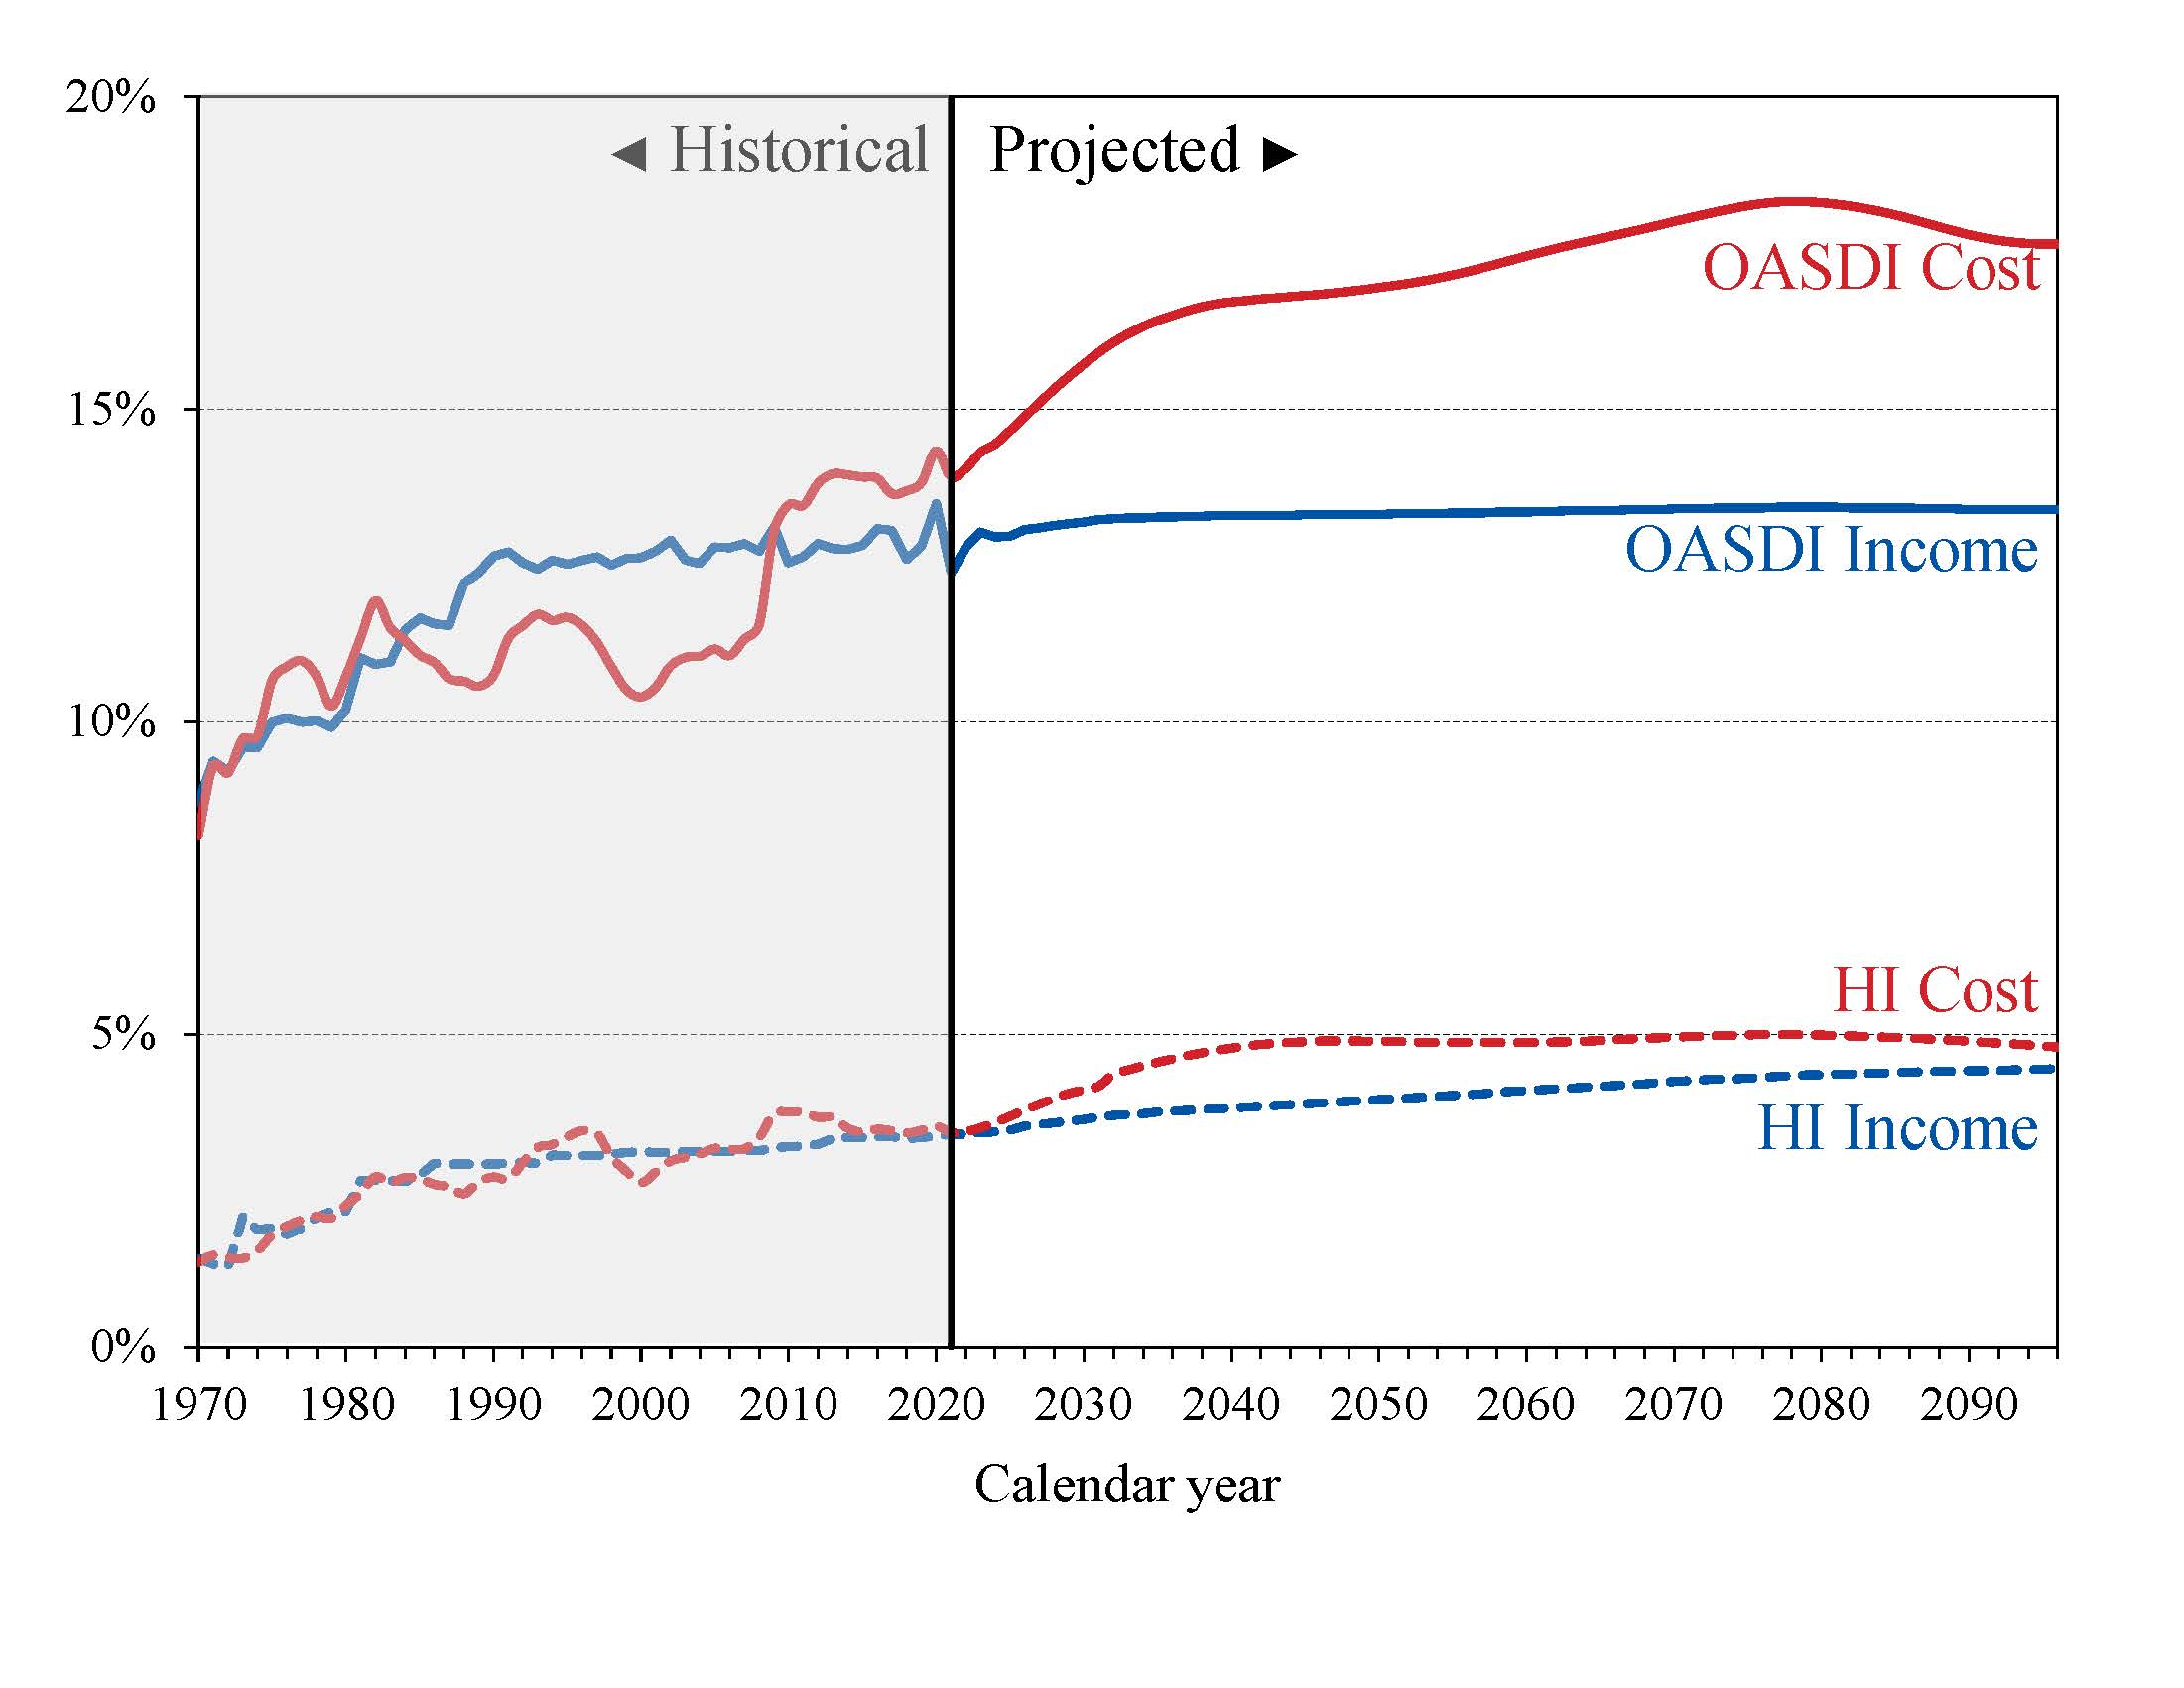
The OASDI and HI income rates in Chart B include payroll taxes and taxes on OASDI benefits, but not interest payments. The projected OASDI income rate is stable at about 13 percent throughout the long-range period. The HI income rate rises gradually from 3.40 percent in 2021 to 4.45 percent in 2096 primarily due to the higher payroll tax rates for high earners that began in 2013. Individual tax return filers with earnings above $200,000, and joint return filers with earnings above $250,000, pay an additional 0.9 percent tax on earnings above these earnings thresholds. An increasing fraction of all earnings will be subject to the higher tax rate over time because the thresholds are not indexed. By 2096, an estimated 80 percent of workers would pay the higher rate.
What is the Long-Range Actuarial Balance of the OASI, DI, and HI Trust Funds? Another way to view the outlook for payroll tax-financed trust funds (OASI, DI, and HI) is to consider their actuarial balances for the 75-year valuation period. The actuarial balance measure includes the trust fund asset reserves at the beginning of the period, an ending fund balance equal to the 76th year’s costs, and projected costs and income during the valuation period, all expressed as a percentage of taxable payroll for the 75-year projection period. The actuarial balance is the difference between the summarized income rate and the summarized cost rate as a percentage of taxable payroll over the valuation period. A negative actuarial balance is an actuarial deficit. Note that actuarial balance is not relevant for the Medicare SMI Trust Fund because Federal law sets premium increases and general revenue transfers at the levels necessary to bring the SMI Trust Fund into annual balance.
An actuarial deficit represents the average amount of change in income or cost that is needed throughout the valuation period in order to achieve actuarial balance. The actuarial balance for the period equals zero if cost can be met for the period as a whole and trust fund asset reserves at the end of the period are equal to the following year’s cost. The OASI, DI, and HI Trust Funds all have long-range actuarial deficits, as shown in Table 7.
| OASI | DI | OASDI | HI | |
|---|---|---|---|---|
| Actuarial deficit | 3.41 | 0.01 | 3.42 | 0.70 |
NOTE: Totals do not necessarily equal the sums of rounded components.
For the combined OASI and DI Trust Funds, the annual deficit, expressed as the difference between the cost rate and income rate for a particular year, was 1.54 percent of taxable payroll in 2021. Compared with last year’s report, the Trustees project smaller annual deficits for Social Security throughout the 75-year projection period, on average about 0.18 percentage point lower. For 2096, the projected annual deficit is 4.25 percent of taxable payroll in this report, compared to 4.35 percent in last year’s report.
Projected annual deficits for the combined OASI and DI programs gradually increase from 1.26 percent of taxable payroll in 2022 to 4.89 percent in 2078, before declining to 4.25 percent of taxable payroll in 2096 (Chart B). The relatively large variation in annual deficits for the Social Security trust funds indicates that a one-time, uniform increase in the payroll tax rate for all years starting in 2022 sufficient to achieve actuarial balance would result in large annual surpluses early in the period, but followed by increasing deficits in later years. Sustainable solvency beyond the end of the 75-year period would require larger payroll tax rate increases and/or benefit reductions than those needed on average for this report’s long-range period (2022-96).
In 2021, the HI annual deficit—again, expressed as the difference between the cost rate and income rate—was 0.03 percent of taxable payroll and is expected to rise to 0.04 percent in 2022. Projected annual deficits increase gradually to a high of 0.99 percent of taxable payroll in 2044 before declining gradually to 0.35 percent in 2096. The projected HI cost rates in this year’s Medicare report are lower than those from the 2021 report because of (i) lower health care utilization through 2028 due to the pandemic and (ii) higher taxable payroll in all years resulting from the changing economic and demographic assumptions. The Trustees expect annual HI deficits to increase during the next two decades as cost rates grow faster than income rates. The cost rate increases primarily due to rising per beneficiary spending and the aging of the baby boom population. Throughout the long-range period, cost rate growth is constrained by the productivity reductions in provider payments. At the same time, income rates increase as a larger share of earnings becomes subject to the additional 0.9 percent payroll tax and a larger share of Social Security benefits becomes subject to income tax that is credited to the HI Trust Fund.
The financial outlooks for both OASDI and HI depend on a number of demographic and economic assumptions. Nevertheless, the actuarial deficit in each of these programs is large enough that averting trust fund depletion under current-law financing is extremely unlikely. An analysis that allows plausible random variations around the intermediate assumptions indicates that OASDI trust fund depletion is highly probable (denoted by a 95-percent confidence interval) by 2043.
How Has the Financial Outlook for Social Security and Medicare Changed Since Last Year? The COVID-19 pandemic and 2020 recession have had significant effects on the short-range finances of both programs. The economic recovery has been stronger than assumed in last year’s reports with faster-than-expected increases in employment, earnings, and GDP in late 2020, 2021, and early 2022. This year’s reports incorporate increases in both the level of total economy labor productivity and the level of potential GDP for 2021 and later years. Disabled-worker application and incidence rates continued to fall in 2020 and 2021, as they have since 2010, prompting the Trustees to reduce the assumed long-range disability incidence rate from 5.0 to 4.8 per thousand exposed. Although the ultimate demographic assumptions remain unchanged from last year, the 2022 reports incorporate slightly lower fertility rates and smaller pandemic effects on immigration in the near term. Taken together, these data and assumptions cause the projected reserve depletion date for the combined OASI and DI Trust Funds to move from 2034 to 2035. For Medicare, there have been notable impacts on short-term financing and spending patterns, but the Trustees expect these to play out by 2024, although lingering morbidity effects will continue through 2028. There is an unusually large degree of uncertainty associated with the eventual effects of COVID-19 and future projections could change significantly as more information becomes available.
Under the intermediate assumptions, the combined OASDI trust funds now have a projected 75-year actuarial deficit equal to 3.42 percent of taxable payroll, compared with the 3.54 percent figure reported last year. The projected depletion date for the combined asset reserves is 2035, a year later than in last year’s report. Advancing the valuation period by one year to include 2096, a year with a large negative balance, alone increases the actuarial deficit by 0.06 percent of taxable payroll. That factor is more than offset by the combined effects of changes in law, methods, starting values, and assumptions that decrease the actuarial deficit by 0.17 percent of taxable payroll and result in the net reduction in the actuarial deficit of 0.12 percentage point. Roughly 60 percent of the change in the actuarial balance for the combined OASDI trust funds is attributable to the improved outlook for the DI Trust Fund.
Medicare’s HI Trust Fund has a long-range actuarial deficit equal to 0.70 percent of taxable payroll, down from 0.77 in last year’s report. This change is mainly due to an improved method for allocating projected Medicare Advantage spending between Parts A and B, which lowers projected Part A private health care spending, and economic and demographic assumptions that were partially offset by changes in hospital and other provider assumptions. The anticipated date of depletion of the HI Trust Fund is now 2028. Projected HI income is higher than in last year’s report due to increases in the expected number of covered workers and higher average wages. HI expenditures are projected to be lower early in the short range because of the pandemic but larger after 2023 due to higher projected provider payment updates.
Due to the nature of the financing for both Part B and Part D of SMI, each account is separately in financial balance under current law, as they were last year. The projected Part B costs (expressed as a share of GDP) in this year’s Medicare report are slightly lower than the estimates in last year’s report in the near term due mainly to higher anticipated GDP, but are slightly higher in the long term, with high spending growth for outpatient hospital services and physician-administered drugs being contributing factors. The Part D projected cost (as a share of GDP) are slightly lower due to (i) higher anticipated GDP and (ii) lower spending attributable to slower price growth and higher direct and indirect remuneration (DIR), which are partially offset by higher enrollment. SMI spending was 2.4 percent of GDP in 2021, is expected to grow to 4.0 percent within 25 years, and further increase to 4.5 percent of GDP in 2096.
What Is the Outlook for Future Social Security and Medicare Costs in Relation to GDP? Future Social Security and Medicare costs consist of scheduled benefits and administrative expenses. To better understand the size of these future projected costs, one can compare them to GDP, the most frequently used measure of the total output of the U.S. economy (Chart C).
Chart C—Social Security and Medicare Cost as a Percentage of GDP
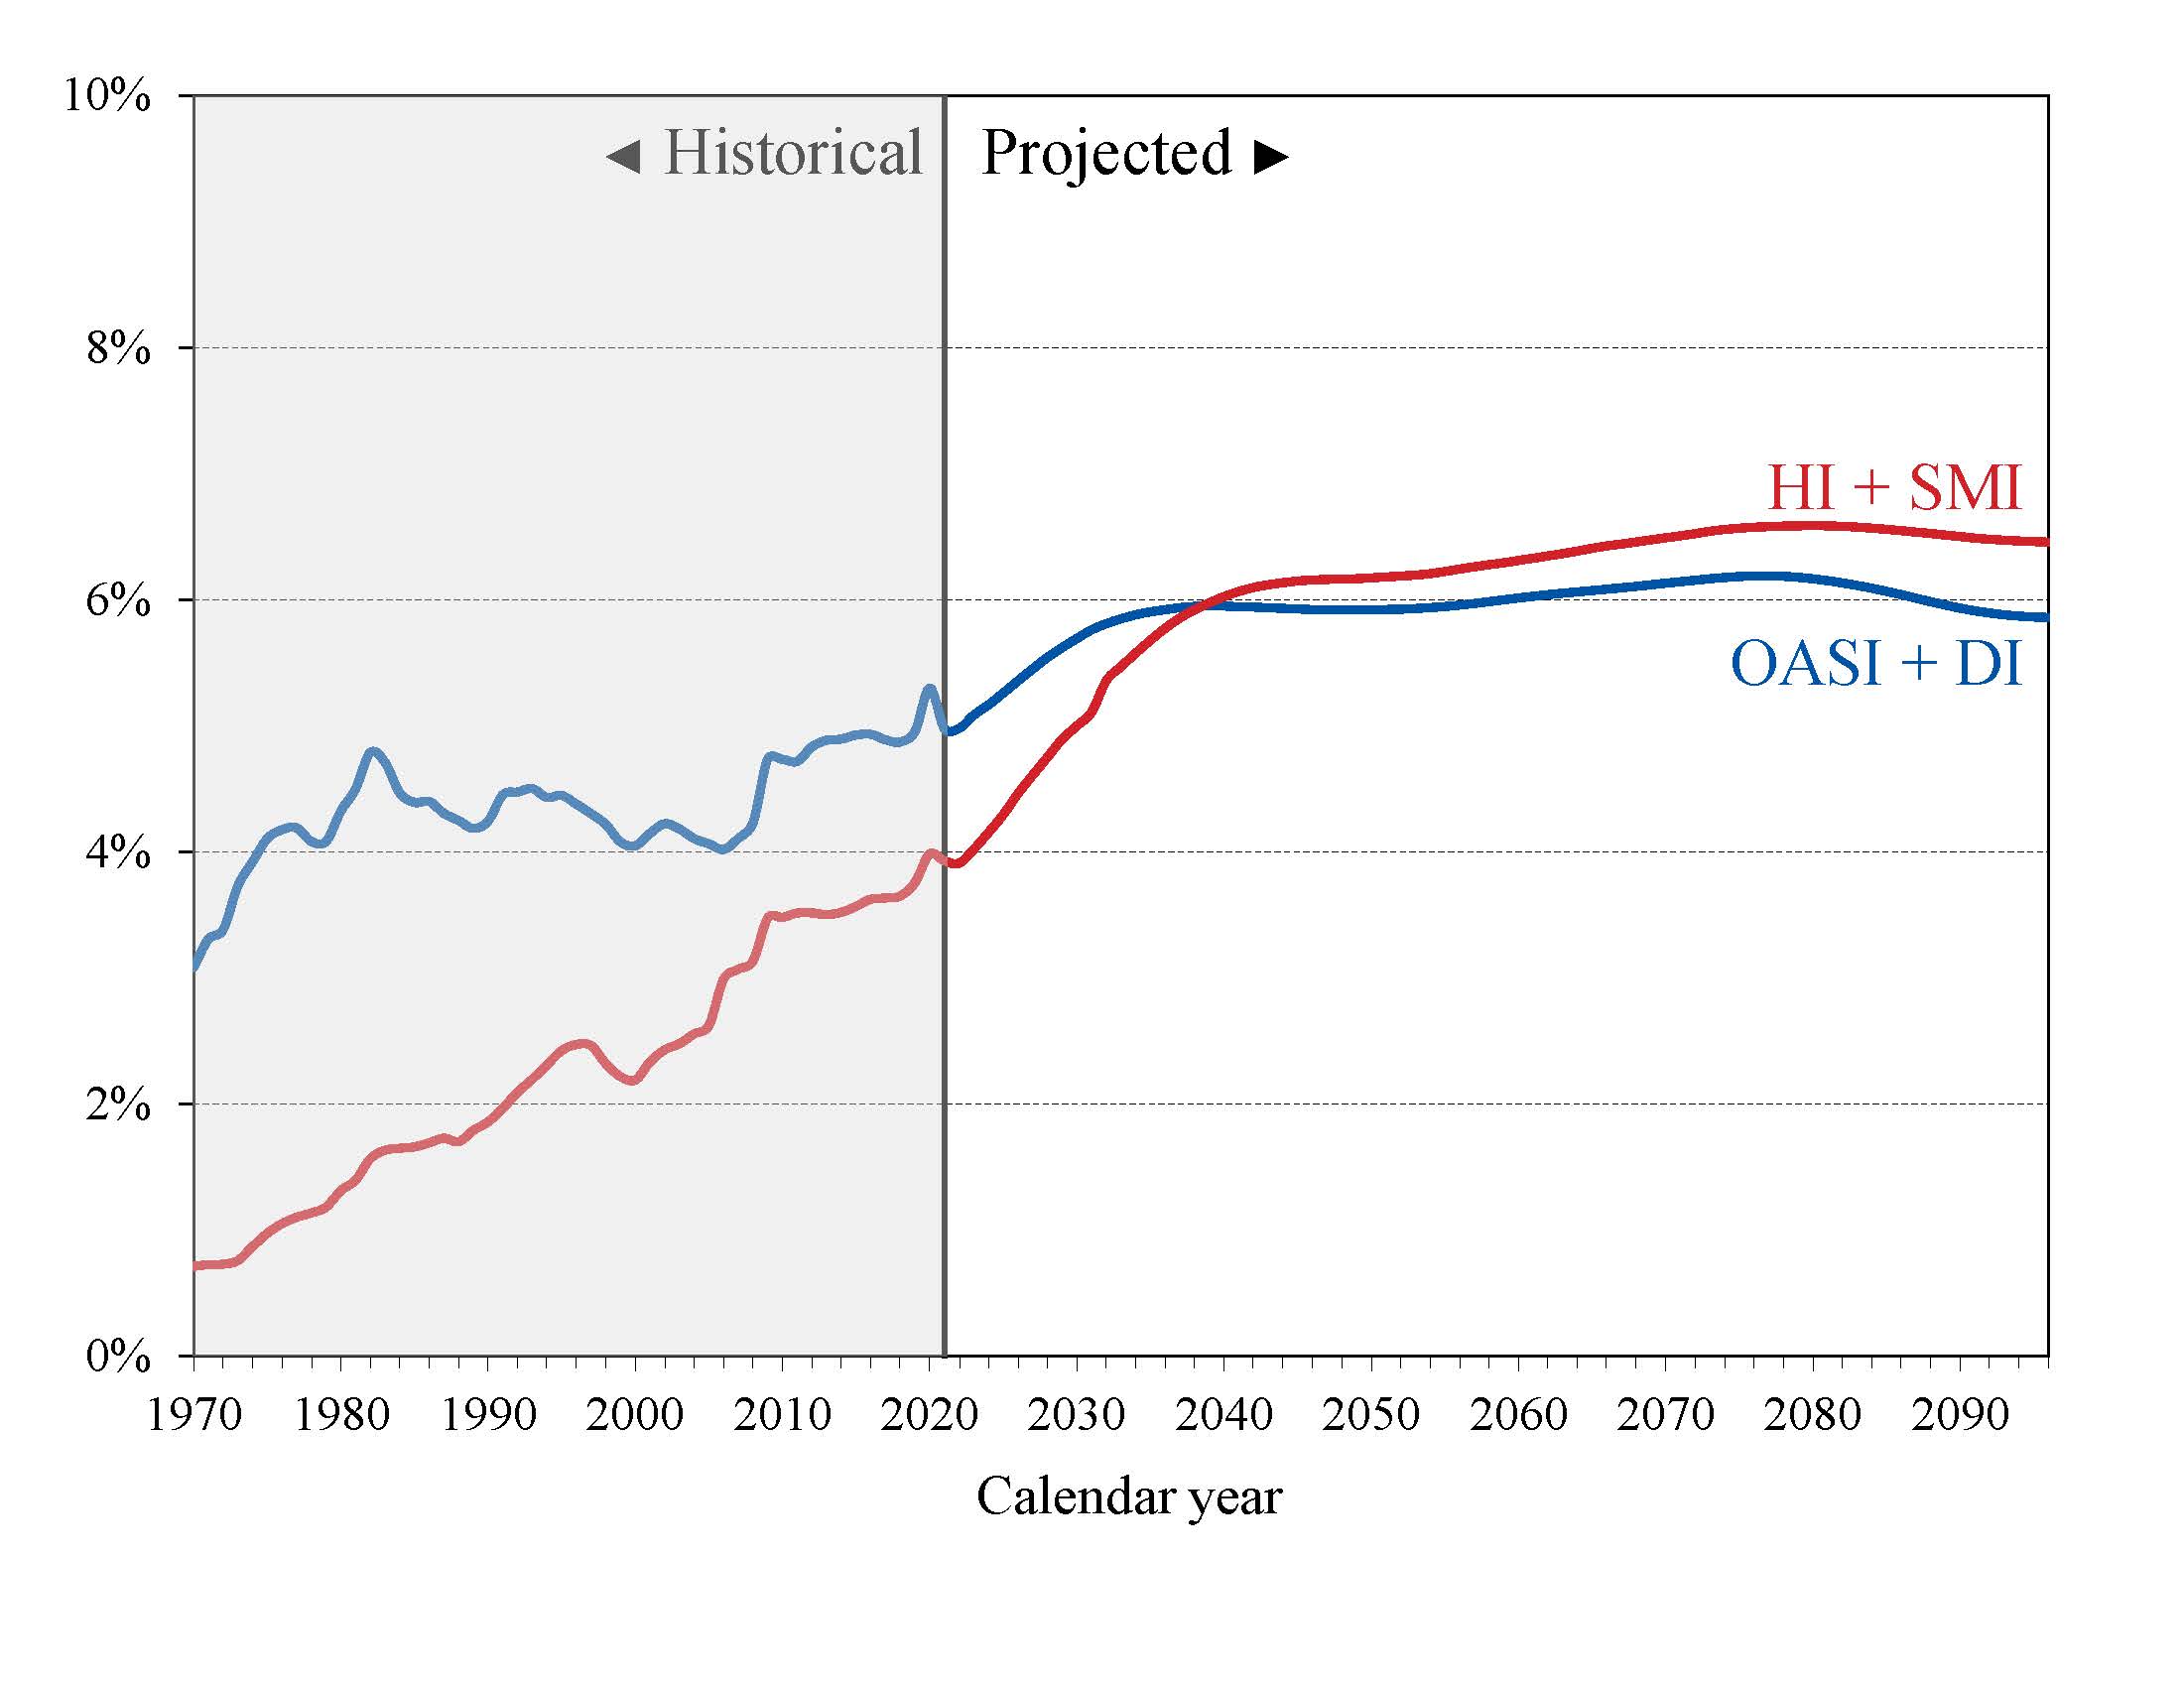
Under the intermediate assumptions employed in the reports, the costs of these programs as a percentage of GDP increase substantially through about 2035 because: (1) the number of beneficiaries rises rapidly as the baby-boom generation retires; and (2) the lower birth rates that have persisted since the baby boom cause slower growth of employment and GDP.
Social Security’s annual cost as a percentage of GDP is projected to increase from 5.0 percent in 2022 to about 6.0 percent for 2039. It then declines slightly through 2049, then resumes rising to a peak of 6.2 percent in 2077, before gradually decreasing to 5.9 percent by 2096. Medicare’s annual cost rises from 3.9 percent of GDP in 2022 to 6.2 percent by 2046 due mainly to the rapid growth in the number of beneficiaries, and then increases further to 6.5 percent by 2096. The growth in health care cost per beneficiary becomes the larger factor later in the valuation period, particularly in Part D.
In 2022, the combined cost of the Social Security and Medicare programs is about 8.9 percent of GDP. The Trustees project an increase to 11.6 percent of GDP by 2035 and to 12.3 percent by 2096, with most of the increase coming from Medicare. In 2022, Medicare’s annual cost is about 79 percent of Social Security’s annual cost. By 2039, Medicare will be more costly than Social Security. During the last 25 years of the long-range period, Medicare is, on average, about 8 percent more costly than Social Security.
The projected costs for OASDI and HI as shown in Chart C and elsewhere in this summary assume that the full scheduled current-law benefits will continue to be paid without regard to whether the trust funds will have sufficient resources to meet these obligations. These programs, however, are not allowed to pay any benefits beyond what is available from annual income and trust fund reserves, and they cannot borrow money. Therefore, after the trust fund reserves become depleted, the amount of benefits that would be paid under current law is lower than shown in Chart C. The projected Medicare costs assume realization of the full estimated savings set out in the Affordable Care Act will be achieved. As described in the Medicare Trustees Report, the projections for Medicare assume that the cost-saving measures will be effective, in particular, the lower increases in Medicare payment rates to most categories of health care providers.
How Will Cost Growth in the Different Parts of Medicare Change the Sources of Program Financing? Over time, general revenues and beneficiary premiums will finance a growing share of Medicare costs. Chart D shows scheduled cost and non-interest revenue sources under current law for HI and SMI combined as a percentage of GDP. The total cost line is the same as displayed in Chart C and shows that the Trustees project Medicare cost to rise to 6.5 percent of GDP by 2096.
Projected revenue from payroll taxes and income taxes on OASDI benefits credited to the HI Trust Fund increases from 1.5 percent of GDP in 2022 to 1.8 percent in 2096 under current law. During the same period, however, projected general revenue transfers to the SMI Trust Fund increase more rapidly from 1.7 percent of GDP in 2022 to 3.1 percent in 2096, and beneficiary premiums increase from 0.6 to 1.3 percent of GDP. Thus, the share of total non-interest Medicare income from taxes declines (from 39 percent to 29 percent) while the general revenue share rises (from 43 percent to 49 percent), as does the share of premiums (from 16 percent to 20 percent). Medicare’s distribution of financing changes in large part because the Trustees project that costs for Part B and especially Part D—the Medicare components that are financed mainly from general revenues—increase at a faster rate than for Part A. The projected annual HI financial deficits beyond 2035 are about 0.4 of GDP through 2057, and they gradually decline to about 0.1 percent of GDP by 2096. There is no provision under current law to finance that shortfall through general revenue transfers or any other revenue source.
Chart D—Medicare Cost and Non-Interest Income by Source as a Percentage of GDP
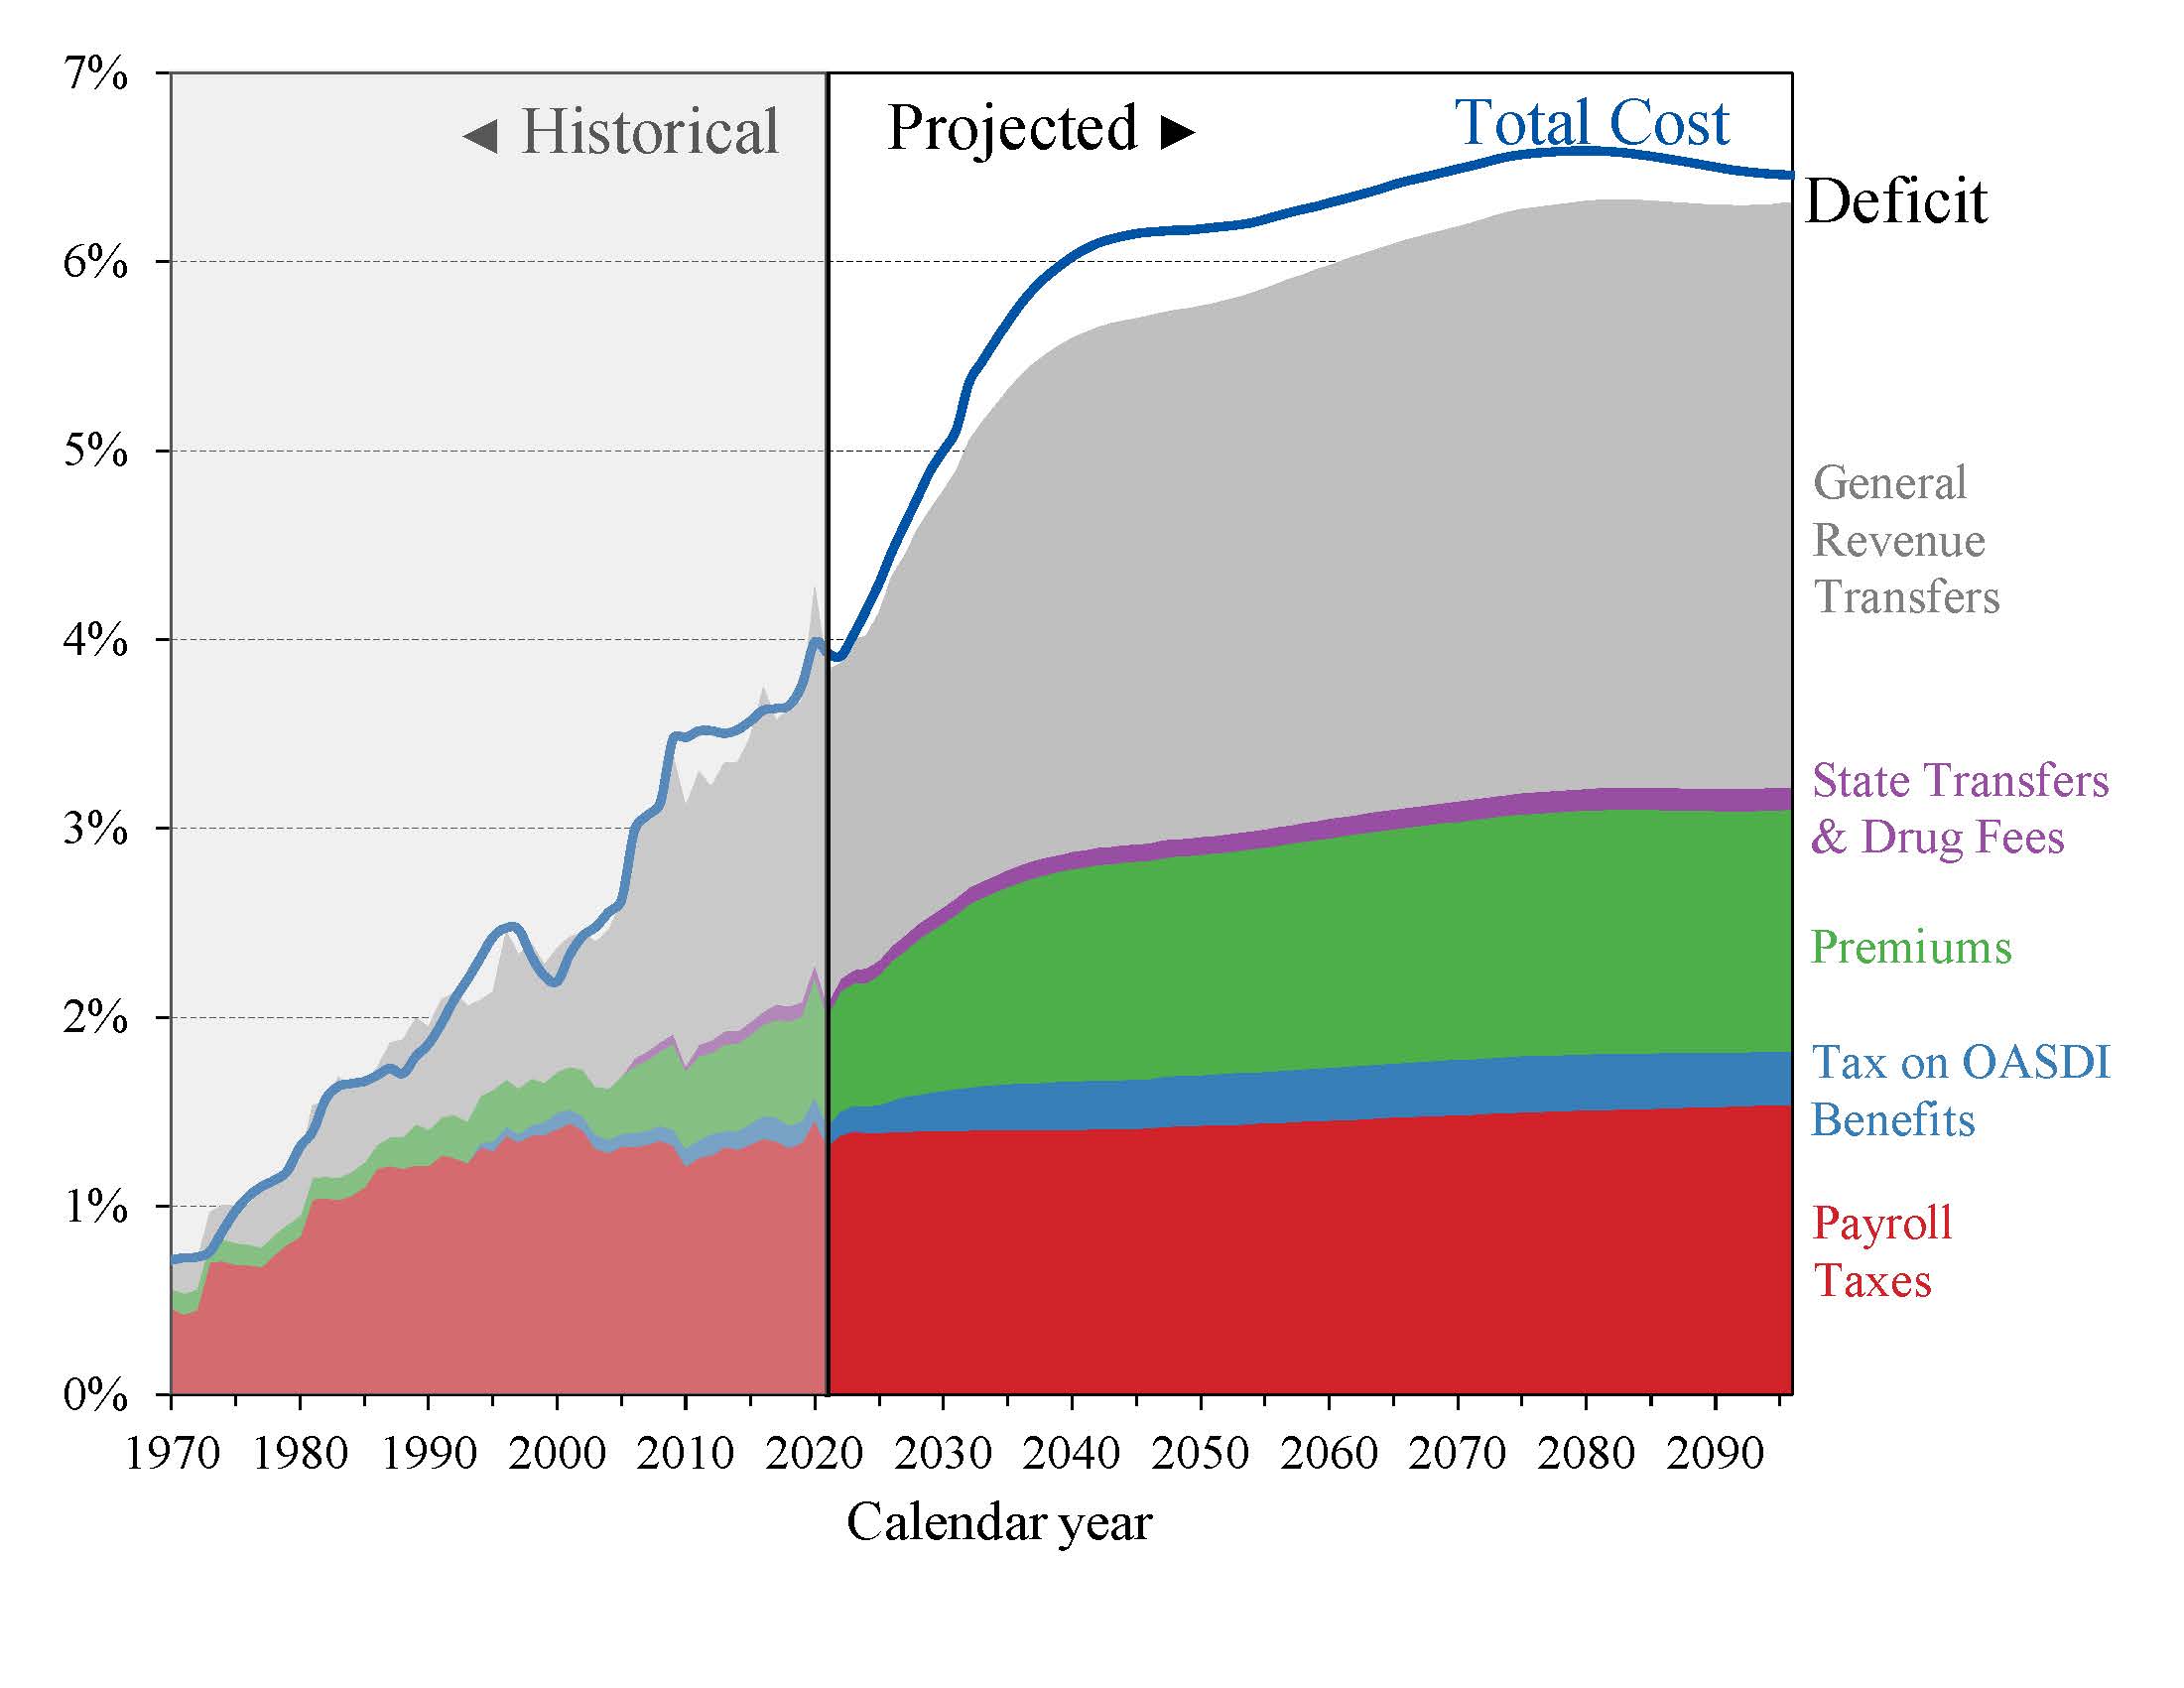
Each year the law requires the Board of Trustees to determine whether the annual difference between Medicare costs and dedicated financing sources exceeds 45 percent of total Medicare cost in any of the next 7 fiscal years. (These dedicated financing sources are shown by the bottom four layers of Chart D.) Because the Trustees estimate this difference to exceed the 45-percent threshold in fiscal year 2025, they are issuing a determination of “excess general revenue Medicare funding” in this year’s report. This is the sixth consecutive report with that determination. Issuing that determination for at least 2 consecutive years triggers a statutory “Medicare funding warning,” which requires that the President submit to Congress proposed legislation to respond to the warning within 15 days after the submission of the Fiscal Year 2024 Budget. The law then requires Congress to consider the legislation on an expedited basis.
2 HI results in this section of the Summary are on a cash rather than the incurred expenditures basis.
A MESSAGE FROM THE PUBLIC TRUSTEES
Because the two Public Trustee positions are currently vacant, there is no Message from the Public Trustees for inclusion in the Summary of the 2022 Annual Reports.