This section presents projections of the numbers of persons receiving federally administered SSI payments by category and age group.
1 The SSI recipient categories of: (1)
aged; or (2)
blind or
disabled identify the criteria under which the recipient established eligibility for SSI benefit
s. The following paragraphs discuss the recipient categories in more detail.
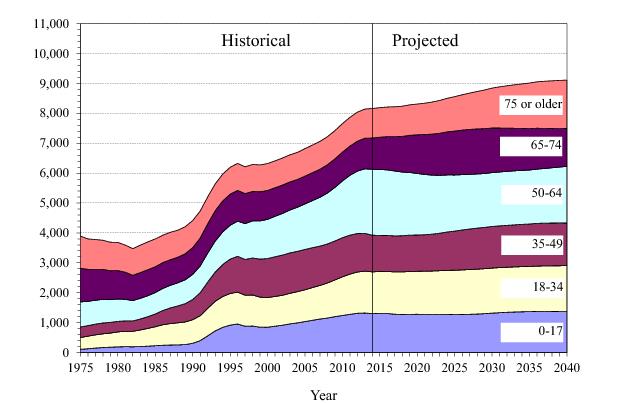
Table IV.B1 presents historical and projected numbers of persons applying for SSI benefits by calendar year. Figure
IV.B1 presents the same information as a graph. Following a 4-year period in the mid-2000s when applications remained fairly level at 2.1 million per year, applications started increasing in 2008, largely due to the severe economic recession that began at the end of 2007 and continued into 2009. The level of applications, which continued to increase through 2010, decreased only slightly in 2011 as the economy recovered slowly but decreased at a faster rate in 2012 through 2014 as the economic recovery continued. We are projecting that applications in 2015 will decrease slightly from 2014 levels, reflecting the impact of some individuals having come on the SSI rolls earlier due to the economic downturn. In 2016, we project that applications will increase slightly to 2.1 million and remain roughly at that level through 2023, and then level off at about 2.2 million per year thereafter.
As part of SSA’s adjudication of these applications, we evaluate levels of income and resources available to the applicants as well as other eligibility factors including marital and citizenship status and living arrangements. In addition, well over 90 percent of the SSI applications are for disability payments that require the DDS to evaluate the alleged impairment. Applicants may appeal an unfavorable disability determination through several administrative levels of appeal. If an applicant exhausts all administrative levels of appeal, he or she may appeal to the Federal courts.
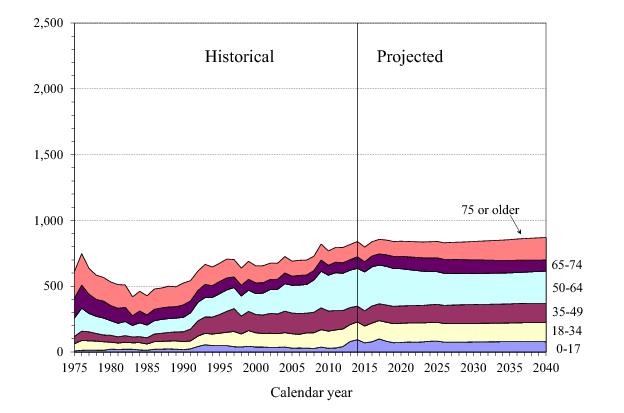
3Table IV.B2 and figure
IV.B2 present historical and projected numbers of persons who start receiving SSI payments as a result of this decision process. We count individuals as of the first month that they move into SSI payment status. For this reason, we refer to these individuals as “
new recipients” rather than “
awards.”
4 From 2004 to 2007, the numbers of new recipients remained fairly level, roughly consistent with the applications received during this period. Starting in 2008, however, the numbers of new recipients increased substantially. This increase is attributable to: (1) the sharp increase in applications due to the economic downturn; (2) improvements in claims processing; and (3) initiatives to accelerate the processing of cases pending adjudication.
The numbers of new recipients declined slightly in 2011 and more sharply in 2012 through 2014, similar to the change in applications. Consistent with the pattern of projected applications, we project the total number of new recipients in 2015 to remain at roughly the same level as experienced in 2014. Over the longer term, we project the number of new recipients to level off and remain roughly level throughout the projection period, despite the growing legal resident population. This leveling off reflects the effect of the fixed-dollar value of certain SSI program parameters on the potential growth in the SSI-eligible population.
Some persons receiving SSI payments in a year will stop receiving payments during the year because of death or the loss of SSI eligibility. SSA uses two primary tools to assess continuing eligibility: (1) a nonmedical redetermination; and (2) a medical continuing disability review (CDR).
5 In a redetermination, we reexamine the recipient's nonmedical factors of eligibility, including income and resources. In a medical CDR, we determine whether the recipient continues to meet the Social Security Act's definition of disability. For example, disabled children, upon attainment of age 18, lose eligibility if they do not qualify for benefits under the disabled adult eligibility criteria. We refer to the net reduction in the number of SSI recipients in
current-payment status during a period as the number of SSI terminations for that period.
For purposes of presentation in the following tables, we use the general label “terminations” to refer to the total of: (1) deaths while in current-payment status during the period; plus (2) the number of persons during the period moving out of payment status into suspended status less those returning to payment status from suspended status. In these tables, we have separated the numbers of total terminations into those two categories: (1) terminations due to death (table IV.B3); and (2) net suspensions of payments for all other reasons (table
IV.B4). Table
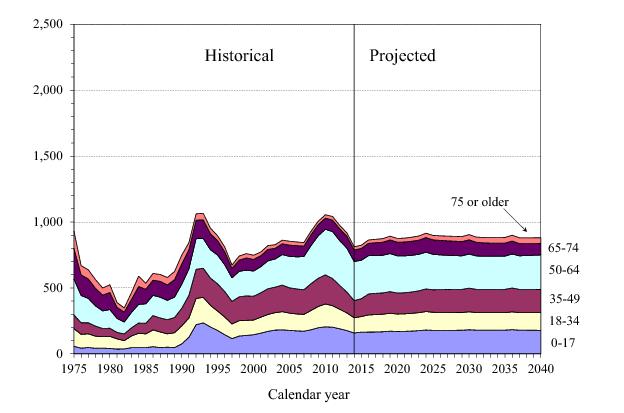
IV.B5 and figure
IV.B3 present historical and projected numbers of total terminations by calendar year. The overall total number of terminations in 2014 increased by about 3 percent from 2013. This increase in the number of federally administered terminations is primarily attributable to the net effect of two factors. The first effect is a decrease in the number of new SSI recipients concurrently eligible for OASDI disability benefits who received SSI benefits only temporarily during the 5-month Social Security Disability Insurance waiting period. The second factor is an increase in terminations due to the decision by the State of New York to take over administration of its State supplementation program effective October 1, 2014, resulting in the termination from federally administered SSI recipients payment rolls of all SSI recipients who were only receiving New York State supplementation payments.
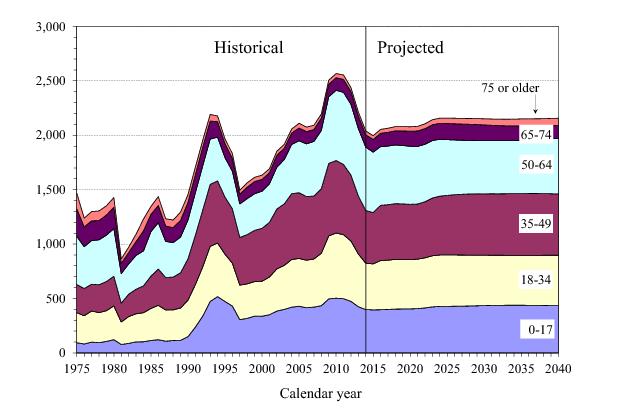
Combining the number of persons coming on the SSI payment rolls during a year with the number of those already receiving benefits at the end of the previous year, and subtracting the number leaving the rolls during the year, yields the number of persons receiving federally administered SSI payments at the end of the year. Table IV.B6 and figure
IV.B4 present the number of individuals receiving Federal SSI payments, who comprise the great majority of federally administered recipients. The number of Federal SSI recipients at the end of 2014 increased by about 0.2 percent over the corresponding number at the end of 2013, a smaller increase than experienced in years 2011 through 2013.
As figure IV.B4 illustrates, the implementation of Public Law 104-121 and Public Law 104-193 resulted in a decline in the Federal recipient population from 1996 to 1997. From the end of 1997 through the end of 2000, the Federal SSI recipient population grew at an annual rate of less than 1 percent. From the end of 2000 to the end of 2008, the Federal SSI recipient population grew an average of 1.7 percent per year. From the end of 2008 to the end of 2012, the Federal recipient population grew an average of 2.7 percent per year due largely to the economic recession and the slow recovery from that economic downturn. In 2013, the Federal SSI recipient growth slowed to 1.3 percent, with much smaller growth in 2014. As the economy continues to recover, we project the numbers of Federal SSI recipients to grow more slowly at an average rate of less than 1 percent per year for the remainder of the 25-year projection period.
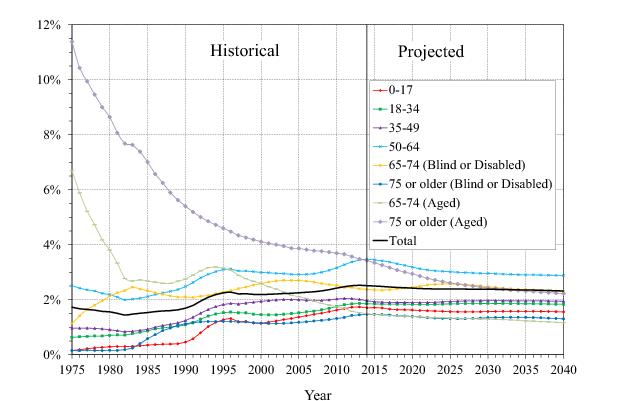
In order to place this projected growth in the context of overall population growth, table IV.B7 and figure
IV.B5 present Federal SSI prevalence rates, defined as SSI recipients with Federal benefits in current-payment status as percentages of selected Social Security area population totals. We calculated the age group percentages in table
IV.B7 using the corresponding population age group totals. We computed the ratios for the separate recipient categories—
total blind or disabled and
total aged—as percentages of differing base populations, the total Social Security area population and the 65 and older Social Security population, respectively. As a result of this method of calculation, the percentage for the total SSI recipient population is not the arithmetic sum of the percentages for the respective recipient categories.
The various subcategories of Federal SSI recipients follow significantly different growth patterns in relation to their respective population totals. The overall aged prevalence rate has declined steadily throughout the historical period. We project that it will continue to decline gradually throughout the projection period. In contrast, except for decreases in the late 1990s due to the eligibility redeterminations and CDRs mandated by Public Law 104-193, the prevalence rate for blind or disabled children increased steadily through 2013, with the increase being quite steep in the early 1990s. The prevalence rate for child recipients decreased slightly in 2014. The total blind or disabled prevalence rate (as a percentage of the total population at all ages) remained fairly level until the early 1980s, when it started increasing and then continued to increase through 1996. The blind or disabled prevalence rate declined slightly in the late 1990s due to the effects of welfare reform legislation but resumed its upward trend in 2000. That upward trend continued through 2013, but experienced a slight decrease in 2014. We estimate that the overall prevalence rate for blind or disabled recipients will gradually decline throughout the projection period due to: (1) the SSI-eligible population growing more slowly than the overall population, (2) a smaller proportion of the population becoming new recipients than during the recent economic slowdown; (3) the changing age distribution in the population; and (4) our assumption that SSA will receive the resources authorized to process CDR and nonmedical redetermination workloads in the Budget Control Act of 2011.
6
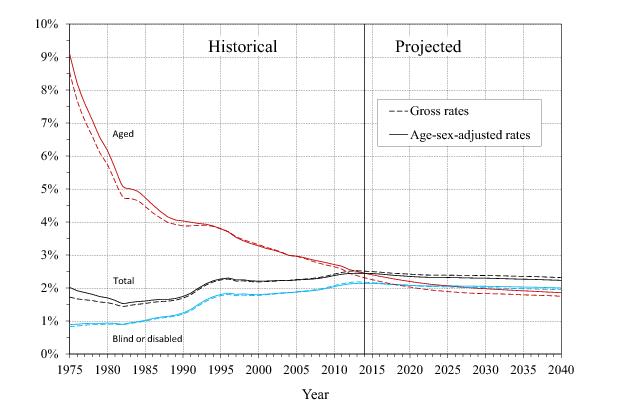
Figure IV.B6 presents prevalence rates on an age-sex-adjusted basis, adjusted to the age-sex distribution of the Social Security area population for the year 2000. Adjusting these rates in this manner is useful when comparing rates over a long period of time because the age-sex-adjusted rates control for the effects that a changing age-sex distribution in the population can have on prevalence rates over time. That adjustment, however, obviously does not account for the change over time of other factors that may affect the percentage of the Social Security area population that is SSI eligible.
The chart below shows that the age-sex adjustment does not fundamentally change the overall pattern of the prevalence rates. The total SSI prevalence rate on an age-sex adjusted basis is higher before 2000 and lower after 2000 than the gross prevalence rate due to the changing aged distribution of the total population. The adjustment generally results in a more noticeable effect for the aged, especially in the early years of the SSI program, because the prevalence rate for ages 75 and older was much higher than for ages 65 to 74.
Table IV.B8 presents historical and projected numbers of individuals who receive only a federally administered State supplement. The drop in these numbers from 2013 to 2014 reflects the decision of the State of New York to take over administration of its State supplementation program mentioned earlier in this section.
Table IV.B9 displays the combined numbers of persons receiving either a Federal SSI payment or a federally administered State supplement.
Certain noteworthy patterns appear in the numbers of SSI recipients in the recent past and projections of such numbers for the near future. The total number of SSI recipients increased rapidly in the early 1990s due to the growth in the numbers of disabled adults and children. The growth in the numbers of children receiving SSI resulted in large part from the Supreme Court decision in the case of Sullivan v. Zebley, 110 S. Ct. 885 (1990), which greatly expanded the criteria used for determining disability for children. The growth in the numbers of disabled adults is a more complicated phenomenon. Extensive research conducted under contract to SSA and the Department of Health and Human Services suggests that this growth was the result of a combination of factors including: (1) demographic trends; (2) a downturn in the economy in the late 1980s and early 1990s; (3) long-term structural changes in the economy; and (4) changes in other support programs (in particular, the reduction or elimination of general assistance programs in certain States).
7 The 1996 welfare reform legislation, the economic downturn in the early 2000s, and the recent economic recession that began late in 2007 have contributed to the more recent changes in program participation.