A Stochastic Model
of the Long-Range Financial Status
of the OASDI Program—September 2004


|
|
|
|
|
|
Equations were selected for a set of assumption variables that include the total fertility rate, changes in mortality, levels of immigration, emigration, and net other immigration, unemployment rate, inflation rate, real interest rate, growth rate in the real average wage, and disability incidence and recovery rates. The parameters of the equations were estimated using standard time-series modeling techniques, and then modified so that the projected variation was centered on the TR04II. Appendix B discusses the theory behind this procedure. This chapter briefly describes and presents each equation, while appendix D provides more detailed information and statistics. Historical time-series data can be obtained from OCACT.1
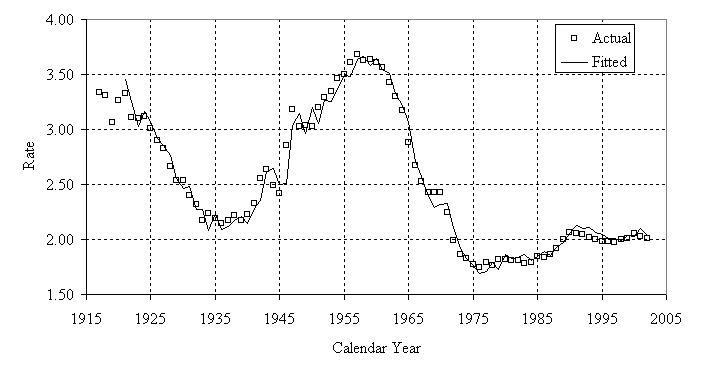
The total fertility rate is the sum of age-specific birth rates2 for women aged 14 through 49. Thus, the total fertility rate for a given year may be interpreted as the average number of children that would be born to a woman throughout her lifetime if she were to survive the entire childbearing period and experience the observed age-specific birth rate each year of her life.
Historical values for the total fertility rate in the U.S. for 1917 through 2002 are available from the National Center for Health Statistics3 and the U.S. Census Bureau.4 The total fertility rate ranged from a minimum of 1.74 in 1976 to a maximum of 3.68 in 1957, and has remained relatively stable, near 2.00, since 1990. The rate was 2.01 in 2002.
Using time-series analysis, an ARMA(4,1) equation was selected and parameters were estimated using the entire range of data. Figure II.1 presents the actual and fitted values. The R-squared value was 0.98. The modified equation is:
Ft = FtTR + 1.99ft-1 −1.51ft-2 + 0.91ft-3 −0.42ft-4 + εt −0.67εt-1. (1)
In this equation, Ft represents the total fertility rate in year t; FtTR represents the projected total fertility rate from the TR04II in year t; ft represents the deviation of the total fertility rate from the TR04II total fertility rate in year t (i.e. ft = Ft −FtTR ) and εt represents the random error in year t.
1 Contact OCACT (actuary@ssa.gov).
2 Age-specific birth rates are defined as the number of live births to women of a given age divided by the estimated female population of the given age at midyear.
3 www.cdc.gov/nchs
4 www.census.gov