Total income and cost are summarized over valuation periods that extend through 75 years and over the infinite horizon.
1 This section presents several summarized measures, including the actuarial balance and the open-group unfunded obligation. The actuarial balance indicates the size of any surplus or shortfall as a percentage of taxable payroll over the period. The open-group unfunded obligation indicates the size of any shortfall in present-value dollars.
The concepts of income rate and cost rate, expressed as percentages of taxable payroll, are important in the consideration of the long-range actuarial status of the trust funds. The annual income rate is the ratio of all non-interest income to the OASDI taxable payroll for the year. Non-interest income includes payroll taxes, taxes on scheduled benefits, and any General Fund reimbursements. The OASDI
taxable payroll consists of the total earnings subject to OASDI taxes with some relatively small adjustments.
2 The annual cost rate is the ratio of the cost of the program to the taxable payroll for the year. The cost includes scheduled benefits,
administrative expenses, net interchange with the
Railroad Retirement program, and payments for
vocational rehabilitation services for disabled beneficiaries. For any year, the annual income rate minus the annual cost rate is the annual “balance” for the year.
Table IV.B1 presents a comparison of the estimated annual income rates and cost rates by trust fund and alternative. Table IV.B2 shows the separate components of the annual income rates.
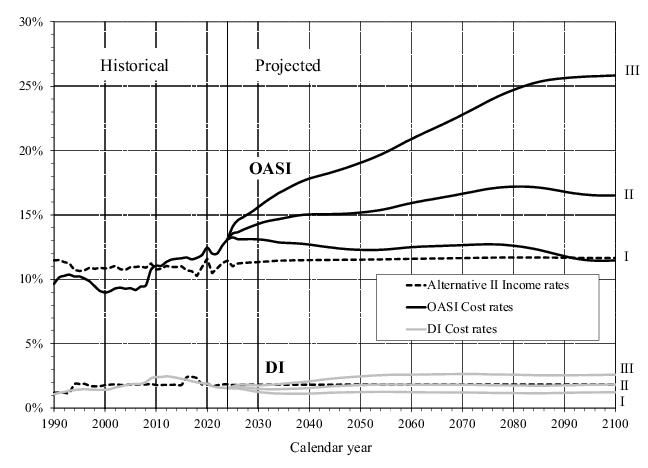
Under the intermediate assumptions, the OASI income rate decreases from 11.46 percent of payroll for 2024 to 11.01 percent of payroll for 2025. The income rate for 2024 was relatively high because of a positive adjustment to payroll tax contributions made in June 2024. The projected income rate for 2025 is relatively low because of a negative adjustment expected in June 2025.
3 After 2025, the OASI income rate generally gradually rises, reaching 11.66 percent of taxable payroll for 2099. Income from taxation of benefits causes this gradual increase in the OASI income rate for two main reasons: (1) total scheduled benefits are rising faster than payroll; and (2) the ratio of total income tax on benefits to total benefits increases over time for reasons discussed in detail on page
156.
The OASI cost rate rises rapidly from 2024 to about 2040. During this period, the aging of the baby-boom generation will increase the number of beneficiaries much faster than the number of workers increases, as subsequent lower-birth-rate generations continue to replace the baby-boom generation at working ages. During the 2040s, the cost rate continues to increase, but at a relatively slower pace, because the aging baby-boom generation is gradually replaced at retired worker benefit eligibility ages by the lower-birth-rate generations that followed. The OASI cost rate then has another period of relatively faster growth, largely because of a period of low birth rates starting in about 2010. The OASI cost rate reaches a maximum of 17.20 percent for 2081 and then generally declines to 16.51 percent for 2099.
Figure IV.B1 shows the patterns of the historical and projected OASI and DI annual cost rates. The patterns in projected OASI and DI cost rates are described earlier in this chapter. Historical annual OASI cost rates shifted upward starting in 2008 and have remained at relatively high levels since then, primarily due to the changing age distribution of the adult population with the retirement of the baby-boom generation and entry of lower birth-rate generations into working ages.
Figure IV.B1 shows only the income rates for alternative II because the variation in income rates by alternative is very small. Income rates generally increase slowly for each of the alternatives over the long-range period. Taxation of benefits, which is a small portion of income, is the main source of the increases in the income rate and the variation among the alternatives.
Table IV.B1 shows the annual balances for OASI, DI, and OASDI. The pattern of the annual balances is important to the analysis of the actuarial status of the Social Security program as a whole. As seen in figure
IV.B1, the magnitude of each of the positive annual balances is the distance between the appropriate cost-rate curve and the income-rate curve above it. The magnitude of each of the annual deficits is the distance between the appropriate cost-rate curve and the income-rate curve below it. Annual balances follow closely the pattern of annual cost rates after 1990 because the payroll tax rate for the OASDI program has not changed and will not under current law, with only small variations in the allocation between DI and OASI except for changes due to the 1994 and the 2016-18 payroll tax rate reallocations.
Long-range OASDI cost and income are most often expressed as percentages of taxable payroll. However, cost and income are also presented as shares of gross domestic product (GDP), the value of goods and services produced during the year in the United States. Under alternative II, the OASDI cost increases from about 5.3 percent of GDP for 2025 to about 6.4 percent for 2079. After 2079, OASDI cost as a percentage of GDP declines, reaching about 6.1 percent by 2099. Appendix
G presents detailed estimates of income and cost relative to GDP.
Table IV.B2 contains historical and projected annual income rates and their components by trust fund and alternative. The annual income rates consist of the scheduled payroll tax rates, the rates of income from taxation of scheduled benefits, and the rates of income from General Fund reimbursements. Projected income from taxation of benefits increases over time for reasons discussed on
page 156.
|
|
|
|
|
|
|
|
|
|
General Fund reim- burse-ments b |
|
|
|
|
|
|
|
|
|
|
|
|
|
|
|
|
|
|
|
|
|
|
|
|
|
|
|
|
|
|
|
|
|
|
|
|
|
|
|
|
|
|
|
|
|
|
|
|
|
|
|
|
|
|
|
|
|
|
|
|
|
|
|
|
|
|
|
|
|
|
|
|
|
|
|
|
|
|
|
|
|
|
|
|
|
|
|
|
|
|
|
|
|
|
|
|
|
|
|
|
|
|
|
|
|
|
|
|
|
|
|
|
|
|
|
|
|
|
|
|
|
|
|
|
|
|
|
|
|
|
|
|
|
|
|
|
|
|
|
|
|
|
|
|
|
|
|
|
|
|
|
|
|
|
|
|
|
|
|
|
|
|
|
|
|
|
|
|
|
|
|
|
|
|
|
|
|
|
|
|
|
d
|
|
|
|
|
|
|
|
|
|
|
|
|
|
|
|
|
|
|
|
|
|
|
|
|
|
|
|
|
|
|
|
|
|
|
|
|
|
|
|
|
|
|
|
|
|
|
|
|
|
|
|
|
|
|
|
|
|
|
|
|
|
|
|
|
|
|
|
|
|
|
|
|
|
|
|
|
|
|
|
|
|
|
|
|
|
|
|
|
|
|
|
|
|
|
|
|
|
|
|
|
|
|
|
|
|
|
|
|
|
|
|
|
|
|
|
|
|
|
|
|
|
|
|
|
|
|
|
|
|
|
|
|
|
|
|
|
|
|
|
|
|
|
|
|
|
|
|
|
|
|
|
|
|
|
|
|
|
|
|
|
|
|
|
|
|
|
|
|
|
|
|
|
|
|
|
|
|
|
|
|
|
|
|
|
|
|
|
|
|
|
|
|
|
|
|
|
|
|
|
|
|
|
|
|
|
|
|
|
|
|
|
|
|
|
|
|
|
|
|
|
|
|
|
|
|
|
|
|
|
|
|
|
|
|
|
|
|
|
|
|
|
|
|
|
|
|
|
|
|
|
|
|
|
|
|
|
|
|
|
|
|
|
|
|
|
|
|
|
|
|
|
|
|
|
|
|
|
|
|
|
|
|
|
|
|
|
|
|
|
|
|
|
|
|
|
|
|
|
|
|
|
|
|
|
|
|
|
|
|
|
|
|
|
|
|
|
|
|
|
|
|
|
|
|
|
|
|
|
|
|
|
|
|
|
|
|
|
|
|
|
|
|
|
|
|
|
|
|
|
|
|
|
|
|
|
|
|
|
|
|
|
|
|
|
|
|
|
|
|
|
|
|
|
|
|
|
|
|
|
|
|
|
|
|
|
|
|
|
|
|
|
|
|
|
|
|
|
|
|
|
|
|
|
|
|
|
|
|
|
|
|
|
|
|
|
|
|
|
|
|
|
|
|
|
|
|
|
|
|
|
|
|
|
|
|
|
|
|
|
|
|
|
|
|
|
|
|
|
|
|
|
|
|
|
|
|
|
|
|
|
|
|
|
|
|
|
|
|
|
|
|
|
|
|
|
|
|
|
|
|
|
|
|
|
|
|
|
|
|
|
|
|
|
|
|
|
|
|
|
|
|
|
|
|
|
|
|
|
|
|
|
|
|
|
|
|
|
|
|
|
|
|
|
|
|
|
|
|
|
|
|
|
|
|
|
|
|
|
|
|
|
|
|
|
|
|
|
|
|
|
|
|
|
|
|
|
|
|
|
|
|
|
|
|
|
|
|
|
|
|
|
|
|
|
|
|
|
|
|
|
|
|
|
|
|
|
|
|
|
|
|
|
|
|
|
|
|
|
|
|
|
|
|
|
|
|
|
|
|
|
|
|
|
|
|
|
|
|
|
|
|
|
|
|
|
|
|
|
|
|
|
|
|
|
|
|
|
|
|
|
|
|
|
|
|
|
|
|
|
|
|
|
|
|
|
|
|
|
|
|
|
|
|
|
|
|
|
|
|
|
|
|
|
|
|
|
|
|
|
|
|
|
|
|
|
|
|
|
|
|
|
|
|
|
|
|
|
|
|
|
|
|
|
|
|
|
|
|
|
|
|
|
|
|
|
|
|
|
|
|
|
|
|
|
|
|
|
|
|
|
|
|
|
|
|
|
|
|
|
|
|
|
|
|
|
|
|
|
|
|
|
|
|
|
|
|
|
|
|
|
|
|
|
|
|
|
|
|
|
|
|
|
|
|
|
|
|
|
|
|
|
|
|
|
|
|
|
|
|
|
|
|
|
|
|
|
|
|
|
|
|
|
|
|
|
|
|
|
|
|
|
|
|
|
|
|
|
|
|
|
|
|
|
|
|
|
|
|
|
|
|
|
|
|
|
|
|
|
|
|
|
|
|
|
|
|
|
|
|
|
|
|
|
|
|
|
|
|
|
|
|
|
|
|
|
|
|
|
|
|
|
|
|
|
|
|
|
|
|
|
|
|
|
|
|
|
|
|
|
|
|
|
|
|
|
|
|
|
|
|
|
|
|
|
|
|
|
|
|
|
|
|
|
|
|
|
|
|
|
|
|
|
|
|
|
|
|
|
|
|
|
|
|
|
|
|
|
|
|
|
|
|
|
|
|
|
|
|
|
|
|
|
|
|
|
|
|
|
|
|
|
|
|
|
|
|
|
|
|
|
|
|
|
|
|
|
|
|
|
|
|
|
|
|
|
|
|
|
|
|
|
|
|
|
|
|
|
|
|
|
|
|
|
|
|
|
|
|
|
|
|
|
|
|
|
|
|
|
|
|
|
|
|
|
|
|
|
|
|
|
|
|
|
|
|
|
|
|
|
|
|
|
|
|
|
|
|
|
|
|
|
|
|
|
|
|
|
|
|
|
|
|
|
|
|
|
|
|
|
|
|
|
|
|
|
|
|
|
|
|
|
|
|
|
|
|
|
|
|
|
|
|
|
|
|
|
|
|
|
|
|
|
|
|
|
|
|
|
|
|
|
|
|
|
|
|
|
|
|
|
|
|
|
|
|
|
|
|
|
|
|
|
|
|
|
|
|
|
|
|
|
|
|
|
|
|
|
|
|
|
|
|
|
|
|
|
|
|
|
|
|
|
|
|
|
|
|
|
|
|
|
|
|
|
|
|
|
|
|
|
|
|
|
|
|
|
|
|
|
|
|
|
|
|
|
|
|
|
|
|
|
|
|
|
|
|
|
|
|
|
|
|
|
|
|
|
|
|
|
|
|
|
|
|
|
|
|
|
|
|
|
|
|
|
|
|
|
|
|
|
|
|
|
|
|
|
|
|
|
|
|
|
|
|
|
|
|
|
|
|
|
|
|
|
|
|
|
|
|
|
|
|
|
|
|
|
|
|
|
|
|
|
|
|
|
|
|
|
|
|
|
|
|
|
|
|
|
|
|
|
|
|
|
|
|
|
|
|
|
|
|
|
|
|
|
|
|
|
|
|
|
|
|
|
|
|
|
|
|
|
Covered workers a(in thousands) |
Beneficiaries b (in thousands) |
|
|
|
|
|
|
|
|
|
|
|
|
|
|
|
|
|
|
|
|
|
|
|
|
|
|
|
|
|
|
|
|
|
|
|
|
|
|
|
|
|
|
|
|
|
|
|
|
|
|
|
|
|
|
|
|
|
|
|
|
|
|
|
|
|
|
|
|
|
|
|
|
|
|
|
|
|
|
|
|
|
|
|
|
|
|
|
|
|
|
|
|
|
|
|
|
|
|
|
|
|
|
|
|
|
|
|
|
|
|
|
|
|
|
|
|
|
|
|
|
|
|
|
|
|
|
|
|
|
|
|
|
|
|
|
|
|
|
|
|
|
|
|
|
|
|
|
|
|
|
|
|
|
|
|
|
|
|
|
|
|
|
|
|
|
|
|
|
|
|
|
|
|
|
|
|
|
|
|
|
|
|
|
|
|
|
|
|
|
|
|
|
|
|
|
|
|
|
|
|
|
|
|
|
|
|
|
|
|
|
|
|
|
|
|
|
|
|
|
|
|
|
|
|
|
|
|
|
|
|
|
|
|
|
|
|
|
|
|
|
|
|
|
|
|
|
|
|
|
|
|
|
|
|
|
|
|
|
|
|
|
|
|
|
|
|
|
|
|
|
|
|
|
|
|
|
|
|
|
|
|
|
|
|
|
|
|
|
|
|
|
|
|
|
|
|
|
|
|
|
|
|
|
|
|
|
|
|
|
|
|
|
|
|
|
|
|
|
|
|
|
|
|
|
|
|
|
|
|
|
|
|
|
|
|
|
|
|
|
|
|
|
|
|
|
|
|
|
|
|
|
|
|
|
|
|
|
|
|
|
|
|
|
|
|
|
|
|
|
|
|
|
|
|
|
|
|
|
|
|
|
|
|
|
|
|
|
|
|
|
|
|
|
|
|
|
|
|
|
|
|
|
|
|
|
|
|
|
|
|
|
|
|
|
|
|
|
|
|
|
|
|
|
|
|
|
|
|
|
|
|
|
|
|
|
|
|
|
|
|
|
|
|
|
|
|
|
|
|
|
|
|
|
|
|
|
|
|
|
|
|
|
|
|
|
|
|
|
|
|
|
|
|
|
|
|
|
|
|
|
|
|
|
|
|
|
|
|
|
|
|
|
|
|
|
|
|
|
|
|
|
|
|
|
|
|
|
|
|
|
|
|
|
|
|
|
|
|
|
|
|
|
|
|
|
|
|
|
|
|
|
|
|
|
|
|
|
|
|
|
|
|
|
|
|
|
|
|
|
|
|
|
|
|
|
|
|
|
|
|
|
|
|
|
|
|
|
|
|
|
|
|
|
|
|
|
|
|
|
|
|
|
|
|
|
|
|
|
|
|
|
|
|
|
|
|
|
|
|
|
|
|
|
|
|
|
|
|
|
|
|
|
|
|
|
|
|
|
|
|
|
|
|
|
|
|
|
|
|
|
|
|
|
|
|
|
|
|
|
|
|
|
|
|
|
|
|
|
|
|
|
|
|
|
|
|
|
|
|
|
|
|
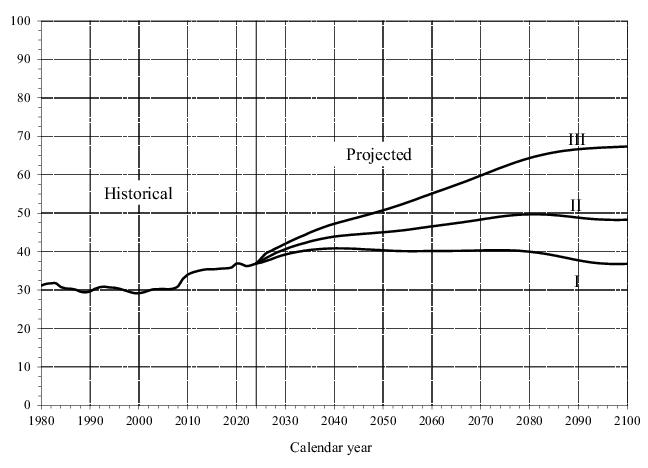
The effect of the demographic shift on the OASDI cost rates is clear when one considers the projected number of OASDI beneficiaries per 100 covered workers under the three alternatives. Compared to the 2024 level of 37 beneficiaries per 100 covered workers, this ratio is projected to rise to 44 by 2040 under the intermediate assumptions, because the growth in beneficiaries greatly exceeds the growth in workers. This projected ratio continues to rise through 2080 and then generally declines, reaching 48 under the intermediate assumptions by 2100. Under the high-cost assumptions, this ratio rises to 67 by 2100. Under the low-cost assumptions, this ratio rises to 41 by 2040 and then generally declines, reaching 37 by 2100. Figure
IV.B2 shows beneficiaries per 100 covered workers.
For each alternative, the curve in figure IV.B2 is strikingly similar to the corresponding cost-rate curve in figure
IV.B1. This similarity emphasizes the extent to which the cost rate is determined by the age distribution of the
population. The cost rate is essentially the product of the number of beneficiaries and their average benefit, divided by the product of the number of covered workers and their average taxable earnings. For this reason, the pattern of the annual cost rates is similar to that of the annual ratios of beneficiaries to workers.
Table IV.B3 also shows the number of covered workers per OASDI beneficiary, which was about 2.7 for 2024. Under the intermediate assumptions, this ratio declines generally throughout the long-range period, reaching 2.3 for 2040 and 2.1 by 2100. Under the low-cost assumptions, this ratio declines to 2.4 for 2040, then generally rises to 2.7 by 2100. Under the high-cost assumptions, this ratio decreases to 1.5 by 2100.
Table IV.B4 shows the projections of trust fund ratios by alternative, without regard to advance tax transfers that would be effected, for the separate and combined OASI and DI Trust Funds. The table also shows the years of trust fund reserve depletion and the percentage of scheduled benefits that would be payable thereafter, by alternative.
Table IV.B4.—Trust Fund Ratios, Calendar Years 2025-2100
a
|
|
|
|
|
|
|
|
|
|
|
|
|
|
|
|
|
|
|
|
|
|
|
|
|
|
|
|
|
|
|
|
|
|
|
|
|
|
|
|
|
|
|
|
|
|
|
|
|
|
|
|
|
|
|
|
|
|
|
|
|
|
|
|
|
|
|
|
|
|
|
|
|
|
|
|
|
|
|
|
|
|
|
|
|
|
|
|
|
|
|
|
|
|
|
|
|
|
|
|
|
|
|
|
|
|
|
|
|
|
|
|
|
|
|
|
|
|
|
|
|
|
|
|
|
|
|
|
|
|
|
|
|
|
|
|
|
|
|
|
|
|
|
|
|
|
|
|
|
|
|
|
|
|
|
|
|
|
|
|
|
|
|
|
|
|
|
|
|
|
|
|
|
|
|
|
|
|
|
|
|
|
|
|
|
|
|
|
|
|
|
|
|
|
|
|
|
|
|
|
|
|
|
|
|
|
|
|
|
|
|
|
|
|
|
|
|
|
|
|
|
|
|
|
|
|
|
|
|
|
|
|
|
|
|
|
|
|
|
|
|
|
|
|
|
|
|
|
|
|
|
|
|
|
|
|
|
|
|
|
|
|
|
|
|
|
|
|
|
|
|
|
|
|
|
|
|
|
|
|
|
|
|
|
|
|
|
|
|
|
|
|
|
|
|
|
|
|
|
|
|
|
|
|
|
|
|
|
|
|
|
|
|
|
|
|
|
|
|
|
|
|
|
|
|
|
|
|
|
|
|
|
|
|
|
|
|
|
|
|
|
|
|
|
|
|
|
|
|
|
|
|
|
|
|
|
|
|
|
|
|
|
|
|
|
|
|
|
|
|
|
|
|
|
|
|
|
|
|
|
|
Since 2013, when the Trustees last modified the test of long-range close actuarial balance, the standard for each trust fund requires meeting two conditions: (1) the test of short-range financial adequacy is satisfied; and (2) the trust fund ratios stay above zero throughout the 75-year projection period, allowing scheduled benefits to be paid in a timely manner throughout the period. Both the long-range test and the short-range test are applied based on the intermediate set of assumptions. As discussed in section IV.
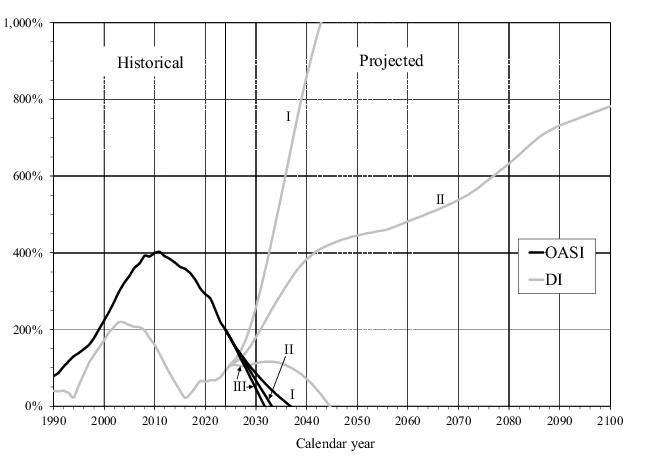
A, the DI Trust Fund passes the test of short-range financial adequacy because the trust fund ratio stays above 100 percent throughout the 10-year short-range projection period. The OASI and combined OASI and DI Trust Funds fail the test of short-range financial adequacy because the trust fund ratios drop below 100 percent by the end of the 10‑year period. Under the intermediate assumptions, the OASI Trust Fund reserves become depleted in 2033, DI Trust Fund reserves stay positive throughout the 75‑year period, and the combined OASI and DI Trust Fund reserves become depleted in 2034. Therefore, the OASI and combined OASI and DI Trust Funds fail the test of long-range close actuarial balance, and the DI program passes the test of long-range close actuarial balance.
Figure IV.B3 illustrates the trust fund ratios for the separate OASI and DI Trust Funds for each of the alternative sets of assumptions. DI Trust Fund status is more uncertain than OASI Trust Fund status because there is a high degree of uncertainty associated with future disability prevalence. A graph of the trust fund ratios for the combined trust funds appears in figure
II.D6.
Table IV.B5 presents summarized income rates, summarized cost rates, and actuarial balances for 25-year, 50-year, and 75-year valuation periods. Summarized income rates are the sum of the present value of non-interest income for a period (which includes scheduled payroll taxes, the projected income from the taxation of scheduled benefits, and reimbursements from the General Fund of the Treasury) and the starting trust fund reserves, expressed as a percentage of the present value of taxable payroll over the period. Under current law, the total OASDI payroll tax rate will remain at 12.4 percent in the future. In contrast, income from taxation of benefits, expressed as a percentage of taxable payroll, is expected to increase in most years of the long-range period for the reasons discussed on
page 156. Summarized cost rates are the sum of the present value of cost for a period (which includes scheduled benefits, administrative expenses, net interchange with the
Railroad Retirement program, and payments for vocational rehabilitation services for disabled beneficiaries) and the present value of the cost of reaching a target trust fund of 100 percent of annual cost at the end of the period, expressed as a percentage of the present value of taxable payroll over the period.
The actuarial balance for a valuation period is equal to the difference between the summarized income rate and the
summarized cost rate for the period. An actuarial balance of zero for any period indicates that cost for the period could be met for the period as a whole (but not necessarily at all points within the period), with a remaining trust fund reserve at the end of the period equal to 100 percent of the following year’s cost. A negative actuarial balance for a period indicates that the present value of income to the program plus the existing trust fund is less than the present value of the cost of the program plus the cost of reaching a target trust fund reserve of one year’s cost by the end of the period. Generally, a trust fund is deemed to be adequately financed for a period as a whole if the actuarial balance is zero or positive, meaning that the reserves at the end of the period are at least equal to annual cost. Note that solvency is possible at the end of the period with a small negative actuarial balance where reserves are still positive.
4
Table IV.B5 contains summarized rates for the intermediate, low-cost, and high-cost assumptions. The low-cost and high-cost assumptions define a wide range of possibilities. Financial outcomes as good as the low-cost scenario or as bad as the high-cost scenario are unlikely to occur.
For the entire 75-year valuation period, the combined OASDI program has actuarial balances of -0.33 percent of taxable payroll under the low-cost assumptions, ‑3.82 percent under the intermediate assumptions, and ‑8.60 percent under the high-cost assumptions. These balances indicate that the combined OASDI program is not adequately financed for the 75-year valuation period under any of these three sets of assumptions.
Assuming the intermediate assumptions accurately capture future demographic, economic, and program-specific trends, solvency for the program over the next 75 years could be restored using a variety of approaches. For example, revenue could be increased in a manner equivalent to an immediate and permanent increase in the combined Social Security payroll tax rate from 12.40 percent to 16.05 percent (a relative increase of 29.4 percent),
5 cost could be reduced in a manner equivalent to an immediate and permanent reduction in scheduled benefits of 22.4 percent, or some combination of approaches could be used.
However, eliminating the actuarial deficit for the next 75-year valuation period requires raising payroll taxes or lowering benefits by more than is required just to achieve solvency, because the actuarial deficit includes the cost of attaining a target trust fund equal to 100 percent of annual program cost by the end of the period. The actuarial deficit could be eliminated for the 75-year period by increasing revenue in a manner equivalent to an immediate and permanent increase in the combined payroll tax from 12.40 percent to 16.22 percent (a relative increase of 30.8 percent),
6 reducing cost in a manner equivalent to an immediate reduction in scheduled benefits of 23.2 percent, or some combination of approaches could be used.
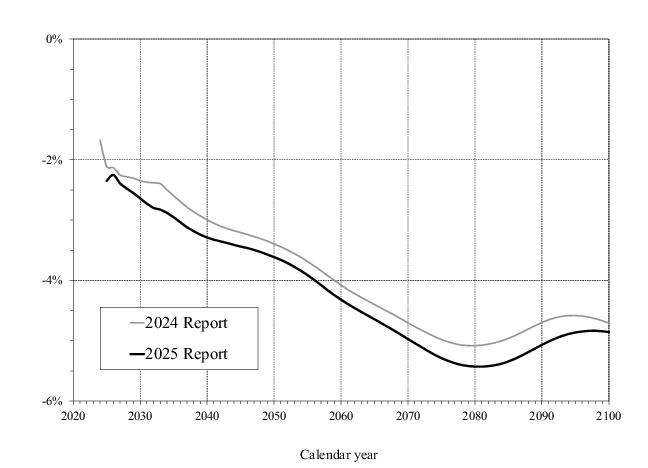
Under the intermediate assumptions, the OASDI program has large annual deficits toward the end of the long-range period that reach 4.84 percent of payroll for 2099 (see table IV.B1). These large deficits indicate that annual cost continues to exceed non-interest income after 2099, so continued adequate financing would require larger changes than those needed to maintain solvency for the 75-year period. Over the period extending through the infinite horizon, the actuarial deficit is 5.2 percent of payroll under the intermediate assumptions.
The open-group unfunded obligation increased from $22.6 trillion shown in last year's report to $25.1 trillion in this report. If there had been no changes in starting values, assumptions, laws, or methods for this report, then the open-group unfunded obligation would have increased to $23.5 trillion solely due to the change in the valuation period. This expected increase in the unfunded obligation occurs because: (1) the unfunded obligation is now discounted to January 1, 2025, rather than to January 1, 2024, which tends to increase the unfunded obligation by the annual nominal interest rate; and (2) the unfunded obligation now includes an additional year (2099). Changes in the law, assumptions, methods, and starting values resulted in an additional $1.6 trillion increase in the unfunded obligation.
The 75-year unfunded obligation is equivalent to 3.64 percent of OASDI taxable payroll and 1.3 percent of GDP for 2025-99.
7 These percentages were 3.32 and 1.2, respectively, for last year’s report. The 75-year unfunded obligation as a percentage of taxable payroll is less than the actuarial deficit, because the unfunded obligation excludes the cost of having an ending target trust fund value.
Table IV.B6 presents the components and the calculation of the long-range (75-year) actuarial balance under the intermediate assumptions. The present value of future cost less future non-interest income over the long-range period, minus the amount of trust fund reserves at the beginning of the projection period, is $25.1 trillion for the OASDI program. This amount is the 75-year “open-group unfunded obligation” (see row
H). The actuarial deficit (which is the negative of the actuarial balance) combines this unfunded obligation with the present value of the ending target trust fund and expresses the total as a percentage of the present value of the taxable payroll for the period. The present value of future non-interest income minus cost, plus starting trust fund reserves, minus the present value of the ending target trust fund, is ‑$26.4 trillion for the OASDI program.
Another measure of trust fund finances, discussed in appendix F, is the infinite horizon unfunded obligation, which takes account of all annual balances, even those after 75 years. The extension of the time period past 75 years assumes that the current-law OASDI program and the demographic, economic, and program-specific trends used for the 75‑year projection continue indefinitely. This infinite horizon unfunded obligation is estimated to be 5.2 percent of taxable payroll or 1.6 percent of GDP. These percentages were 4.5 and 1.4, respectively, for last year’s report. Of course, the degree of uncertainty associated with estimates increases substantially for years further in the future.
Table IV.B7 shows the net effects of changes on the long-range actuarial balance for OASI, DI, and OASDI under the intermediate assumptions, by broad category, between last year’s report and this report.
If the law, data, assumptions, and methods had all remained unchanged from last year’s Trustees Report, the long-range OASDI actuarial balance would have decreased (worsened) by 0.06 percent of taxable payroll solely due to the change in the valuation period. However, as described in more detail below, projections in this report also reflect new data and changes in law, assumptions, and methods. These changes, including the change in the valuation period, combine to decrease the long-range OASDI actuarial balance by 0.33 percentage point, from ‑3.50 percent of taxable payroll in last year’s report to -3.82 percent in this report.
8One ultimate economic assumption was changed for this year’s report, decreasing the actuarial balance by 0.12 percent of taxable payroll. The ratio of total labor compensation to GDP (that is, the labor share of output) is assumed to increase gradually to 61.2 percent in 2034, and to remain approximately constant thereafter. In last year’s report, this ratio was assumed to be about 62.8 percent for 2033 and later. This assumption change, considered by itself, implies somewhat slower average earnings growth over the first ten projection years and a level shift in average earnings in the longer term.
Updates to recent economic data and near-term assumptions also result in significant changes in the actuarial balance. First, historical OASDI covered employment for 2022 was slightly higher, and its age distribution was different, than had been estimated for last year’s report. This data update and the resulting effects on employment and beneficiary levels in years after 2022 increase the actuarial balance by 0.02 percent of taxable payroll.
The fourth significant change is an update to the method used for projecting average weeks worked during a calendar year, a key component of projections of OASDI covered employment. The updated approach uses historical data through 2021 and a more directly relevant data source. This method improvement increases the actuarial balance by 0.03 percent of taxable payroll.
Figure IV.B4 compares the annual balances for this report and the prior year’s report for the combined OASDI program over the long-range (75‑year) projection period. The figure illustrates the annual effects of the changes described earlier in this section.