This chapter presents the estimates and measures of trust fund financial adequacy for the short-range period (2026 through 2035) first, followed by estimates and measures of
actuarial status for the long-range period (2026 through 2100). Summary measures are also provided for trust fund status over the infinite horizon. As described in chapter
II of this report, these estimates depend upon a broad set of
demographic, economic, and programmatic factors. This chapter presents estimates under three sets of assumptions to show a wide range of possible outcomes, because assumptions related to these factors are subject to uncertainty. The intermediate set of assumptions, designated as
alternative II, reflects the Trustees’ best estimate of future experience; the low-cost
alternative I is significantly more optimistic and the high-cost
alternative III is significantly more pessimistic for the trust funds’ future financial outlook. The tables of this report show the intermediate estimates first, followed by the low-cost and high-cost estimates. Chapter
V describes these three sets of assumptions, along with the actuarial methods used to produce the estimates. Appendix
D and appendix
E present two additional methods to illustrate the uncertainty of the projections: appendix
D presents sensitivity analyses of the effects of variation in individual factors and appendix
E presents probability distributions generated by a stochastic model.
The Trustees consider the trust funds to be solvent at any point in time if the funds can pay scheduled benefits in full on a timely basis. A standard measure for assessing solvency is the “
trust fund ratio,” which is the
reserves in a fund at the beginning of a year (not including
advance tax transfers) expressed as a percentage of the cost during the year. A positive trust fund ratio indicates that the trust fund was solvent at the end of the prior year. The trust fund ratio represents the proportion of a year’s cost that can be covered by the
reserves available at the beginning of the year. The Trustees assume that a trust fund ratio of 100 percent of annual program cost provides a reasonable “contingency reserve.” Maintaining a reasonable contingency reserve is important because the trust funds do not have borrowing authority. After reserves are depleted, the trust funds would be unable to pay scheduled benefits in full on a timely basis if annual income were less than annual cost. Unexpected events, such as severe economic recessions, can quickly diminish reserves. In such cases, a reasonable contingency reserve can maintain the ability to pay scheduled benefits while giving lawmakers time to address possible changes to the program.
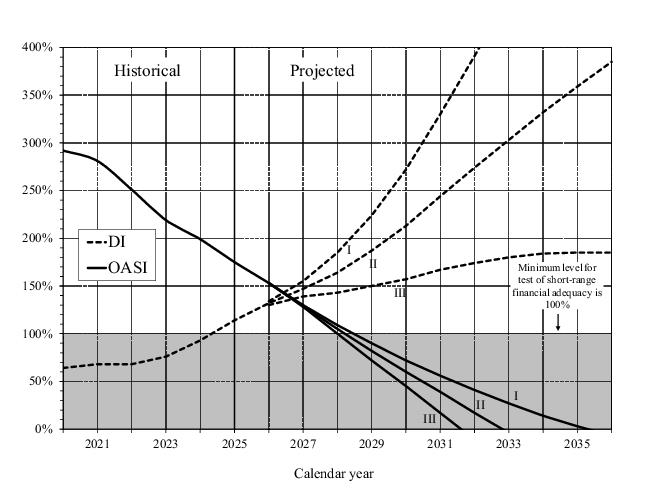
The test of short-range financial adequacy applies to the OASI and DI Trust Funds individually and combined.
1 If the estimated trust fund ratio is at least 100 percent at the beginning of the projection period, the test requires that it remain at or above 100 percent throughout the 10-year period. If the ratio is initially less than 100 percent, then it must reach at least 100 percent within 5 years (without reserve depletion at any time during this period) and then remain at or above 100 percent throughout the remainder of the 10-year period. This test is applied using the estimates based on the intermediate assumptions. If either trust fund fails this test, then program solvency in the next 10 years is in question, and lawmakers should take prompt action to improve short-range financial adequacy.
This subsection presents projections, based on the assumptions described in chapter V, of the operations and financial status of the OASI Trust Fund for the period 2026 through 2035. These estimates assume that there are no further changes in the statutory provisions and regulations under which the OASDI program currently operates beyond the changes since last year’s report indicated in section
III.B.
2
Estimates of the OASI Trust Fund operations presented in table IV.A1 indicate that the reserves of the OASI Trust Fund are projected to decrease in years 2026 through 2035 under all three sets of assumptions. Under the intermediate, low-cost, and high-cost assumptions, reserves become depleted in the fourth quarter of 2032, the third quarter of 2035, and the third quarter of 2031, respectively. Trust fund ratios are projected to decline throughout the 10-year projection period under all three sets of assumptions. See figure
IV.A1 for an illustration of these results.
The estimated income shown in table IV.A1 increases annually under each set of assumptions throughout the short-range projection period, with the exception of a small decrease in 2027 for the high-cost alternative. The estimated increases in income result primarily from the projected increases in OASDI
taxable payroll. Employment increases in years 2026 through 2035 for all three alternatives, with the exception of small decreases in covered employment in 2026 and 2027 for the high-cost alternative. The number of covered workers increases from 185 million during calendar year 2025 under alternative II to about 190 million, 196 million, and 186 million during 2035 under alternatives II, I, and III, respectively.
3 The total annual amount of taxable payroll increases in years 2026 through 2035 for each alternative. Total taxable payroll increases from $10,562 billion in 2025 under alternative II to $16,486 billion, $19,563 billion, and $13,904 billion in 2035 under alternatives II, I, and III, respectively.
4 These increases in taxable payroll are due primarily to: (1) projected increases in employment levels as the working-age
population increases; (2) increases in average earnings in
covered employment (reflecting both real growth and price inflation); and (3) increases in the
contribution and benefit base under the automatic-adjustment provisions.
Rising OASI cost through 2035 reflects automatic benefit increases each year after initial benefit eligibility and increases each year for those becoming newly eligible based on rising average earnings levels, as well as the upward trend in the number of beneficiaries. The steady growth in the number of OASI beneficiaries in the past and the expected future growth result both from the increase in the aged population and from the increase in the proportion of the population that is insured for benefits.
Table IV.A2 shows the projected operations and financial status of the DI Trust Fund during calendar years 2026 through 2035 under the three sets of assumptions, together with values for actual experience during 2021 through 2025. For 2025, non-interest income was higher than DI cost. Non-interest income increases generally throughout the short-range projection period under each alternative, due to most of the same factors described previously for the OASI Trust Fund beginning on page
47. DI cost grows over the short-range period under each alternative. Under all three alternatives, income remains higher than cost through 2035, and
as a result, DI reserves are higher at the end of 2035 than at the end of 2025.
For the future, DI cost is projected to increase in part due to increases in average benefit levels resulting from: (1) automatic benefit increases and (2) projected increases in the amounts of average monthly earnings on which benefits are based. Future changes in DI cost also reflect changes in the number of DI beneficiaries in current-payment status. In 2025, the number of DI beneficiaries in current-payment status continued to decline, as it has over the prior 11 years. Under the intermediate assumptions, the number of DI beneficiaries is projected to begin to increase in 2027, reaching a level of about 9 million at the end of 2035. The rate of increase after 2026 is much slower than was experienced on average from 1990 to 2010, when the population with the highest disabled-worker prevalence rates was growing rapidly due to the aging of the baby-boom generation. See section
V.C.5 for further details.
Table IV.A3 shows the projected operations and status of the combined OASI and DI Trust Funds for calendar years 2026 through 2035 under the three alternatives, together with actual experience in 2021 through 2025. Income and cost for the OASI Trust Fund represent over 80 percent of the corresponding amounts for the combined OASI and DI Trust Funds. Under the low-cost assumptions, the combined OASI and DI Trust Funds would have sufficient financial resources to pay all scheduled benefits through the end of the short-range period, although it is important to note that under current law, one trust fund cannot share financial resources with another trust fund. Under the intermediate and high-cost assumptions, combined OASI and DI Trust Fund reserves become depleted in the third quarter of 2034 and the second quarter of 2032, respectively.
Table IV.A4 presents an analysis of the factors underlying the changes in the intermediate estimates over the short-range projection period for the OASI, DI, and the combined funds from last year’s report to this report.
Table IV.A4 also shows corresponding estimates of the factors underlying the changes in the financial projections for the DI Trust Fund and for the combined OASI and DI Trust Funds. The 87-percentage-point increase in the DI trust fund ratio from the beginning of 2034 in last year’s report to the beginning of 2035 in this year’s report is the net effect of increases and decreases from the factors described above for the OASI Trust Fund, combined with other changes that are significant for DI but not OASI. The decrease of 1 percentage point due to legislation and regulations for DI is primarily caused by the net effect of the OBBBA and a recent regulation which is expected to decrease future improper payments from the DI Trust Fund through improved reporting of wage and employment information. The large increase of 44 percentage points due to programmatic data and assumptions reflects changes in several factors relevant to the DI beneficiary projections, including actual award and termination experience in 2025 and somewhat lower expectations for levels of future applications and awards over the short-range period.