2007 OASDI Trustees Report


2007 OASDI Trustees Report |
|
|
|
|
|
|
This chapter presents actuarial estimates of the future financial condition of the Social Security program. These estimates include projected income and cost of the OASI and DI Trust Funds, in dollars over the next 10 years and as a percentage of taxable payroll or in present-value dollars over the full 75-year period, along with a discussion of a variety of measures of the adequacy of current program financing. In this report we carefully distinguish between (1) the cost (or obligations) of the program, which includes, for the future, all benefits scheduled under current law, and (2) expenditures (disbursements or outgo), which include actual payments for the past and only the portion of the cost of the program that is projected to be payable with the financing provisions in current law.
As described in the Overview section of this report, these estimates depend upon a broad set of demographic, economic, and programmatic factors. Since assumptions related to these factors are subject to uncertainty, the estimates presented in this section are prepared under three sets of assumptions, to show a range of possible outcomes. The intermediate set of assumptions, designated as alternative II, reflects the Trustees' best estimate of future experience; the low cost alternative I is more optimistic and the high cost alternative III more pessimistic for the trust funds' future financial outlook. The intermediate estimates are shown first in the tables in this report, followed by the low cost and high cost estimates. These sets of assumptions, along with actuarial methods used to produce the estimates, are described in chapter V. In this chapter, the estimates and measures of trust fund financial adequacy for the short range (2007-16) are presented first, followed by estimates and measures of actuarial status for the long range (2007-81) and for the infinite future. As an additional illustration of uncertainty, estimated probability distributions of certain measures are presented in appendix E.
Financial adequacy, or solvency, of the trust funds is generally measured on a year-by-year basis using the "trust fund ratio," which is defined to be the assets at the beginning of the year expressed as a percentage of the projected cost for the year. Thus, the trust fund ratio represents the proportion of a year's cost which can be paid with the funds available at the beginning of the year. During periods when trust fund income exceeds disbursements, the excess is held in the trust funds which serve to advance fund a portion of the Social Security program's future financial obligations. During periods when trust fund disbursements exceed income, as might happen during an economic recession, trust fund assets are used to meet the shortfall. In the event of recurring shortfalls for an extended period, the trust funds can allow time for the development, enactment, and implementation of legislation to restore financial stability to the program.
The test of financial adequacy over the short-range projection period is applicable to the OASI and DI Trust Funds individually and on a combined basis. The requirements of this test are as follows: If the estimated trust fund ratio is at least 100 percent at the beginning of the projection period, then it must be projected to remain at or above 100 percent throughout the 10-year projection period. Alternatively, if the ratio is initially less than 100 percent, then it must be projected to reach a level of at least 100 percent within 5 years and to remain at or above 100 percent throughout the remainder of the 10-year period. In addition, the fund's estimated assets at the beginning of each month of the 10-year period must be sufficient to cover that month's disbursements. This test is applied on the basis of the intermediate estimates. Failure to meet this test by either trust fund is an indication that solvency of the program over the next 10 years is in question and that legislative action is needed to improve the short-range financial adequacy of the program.
This subsection presents estimates of the operations and financial status of the OASI Trust Fund for the period 2007-16, based on the assumptions described in chapter V. No changes are assumed to occur in the present statutory provisions and regulations under which the OASDI program operates.1
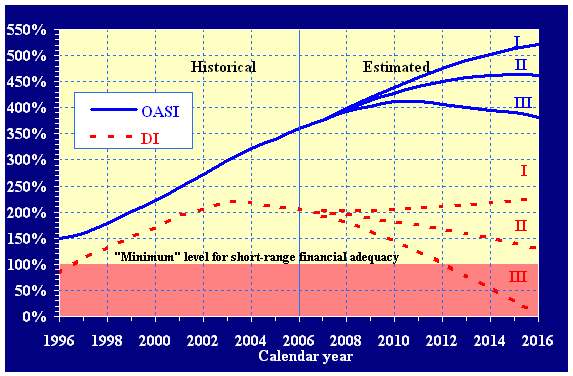
These estimates are shown in table IV.A1 and indicate that the assets of the OASI Trust Fund would continue to increase rapidly throughout the next 10 years under all three sets of assumptions. Also, based on the intermediate assumptions, the assets of the OASI Trust Fund would continue to exceed 100 percent of annual expenditures by a steadily increasing amount through the end of 2016. Consequently, the OASI Trust Fund satisfies the test of short-range financial adequacy by a wide margin. The estimates in table IV.A1 also indicate that the short-range test would be satisfied even under the high cost assumptions (see figure IV.A1 for graphical illustration of these results).
The increases in estimated income shown in table IV.A1 under each set of assumptions reflect increases in estimated OASDI taxable earnings and growth in interest earnings on the invested assets of the trust fund. For each alternative, employment and earnings are assumed to increase in every year through 2016. The number of persons with taxable earnings would increase on the basis of alternatives I, II, and III from 162 million during calendar year 2006 to about 177 million, 173 million, and 170 million, respectively, in 2016. The total annual amount of taxable earnings is projected to increase from $5,057 billion in 2006 to $8,112 billion, $8,145 billion, and $8,463 billion, in 2016, on the basis of alternatives I, II, and III, respectively.2 These increases in taxable earnings are due primarily to (1) projected increases in employment levels as the working age (20-64) population increases, (2) increases in average earnings in covered employment (reflecting both real growth and price inflation), and (3) increases in the contribution and benefit base in 2007-16 under the automatic-adjustment provisions.
Growth in interest earnings represents a significant component of the overall increase in trust fund income during this period. Although interest rates payable on trust fund investments are not assumed to change substantially from current levels, the continuing rapid increase in OASI assets will result in a corresponding increase in interest income. By 2016, interest income to the OASI Trust Fund is projected to be about 20 percent of total trust fund income on the basis of the intermediate assumptions, as compared to 14 percent in 2006.
|
Calendar
year |
Income
|
Cost
|
Assets
|
|||||||||||
|---|---|---|---|---|---|---|---|---|---|---|---|---|---|---|
|
Total 2
|
Net
contri- butions |
Taxa-
tion of benefits |
Net
inter- est |
Total
|
Benefit
pay- ments |
Admin-
istra- tive costs |
RRB
inter- change |
Net
increase during year |
Amount
at end of year |
|||||
|
Historical data:
|
||||||||||||||
|
2002
|
$539.7
|
$455.2
|
$12.9
|
$71.2
|
$393.7
|
$388.1
|
$2.1
|
$3.5
|
$146.0
|
$1,217.5
|
272
|
|||
|
2003
|
543.8
|
456.1
|
12.5
|
75.2
|
406.0
|
399.8
|
2.6
|
3.6
|
137.8
|
1,355.3
|
300
|
|||
|
2004
|
566.3
|
472.8
|
14.6
|
79.0
|
421.0
|
415.0
|
2.4
|
3.6
|
145.3
|
1,500.6
|
322
|
|||
|
2005
|
604.3
|
506.9
|
13.8
|
84.0
|
441.9
|
435.4
|
3.0
|
3.6
|
162.4
|
1,663.0
|
340
|
|||
|
2006
|
642.2
|
534.8
|
15.6
|
91.8
|
461.0
|
454.5
|
3.0
|
3.5
|
181.3
|
1,844.3
|
361
|
|||
|
Intermediate:
|
||||||||||||||
| |
2007
|
675.7
|
559.9
|
17.3
|
98.5
|
492.2
|
485.8
|
2.9
|
3.5
|
183.4
|
2,027.7
|
375
|
||
|
2008
|
715.0
|
589.1
|
18.8
|
107.1
|
511.1
|
504.5
|
3.1
|
3.4
|
204.0
|
2,231.7
|
397
|
|||
|
2009
|
762.8
|
623.2
|
20.8
|
118.9
|
539.5
|
532.9
|
3.1
|
3.5
|
223.3
|
2,455.1
|
414
|
|||
|
2010
|
810.3
|
655.1
|
22.8
|
132.3
|
573.5
|
566.9
|
3.1
|
3.5
|
236.8
|
2,691.8
|
428
|
|||
|
2011
|
860.8
|
688.2
|
25.8
|
146.8
|
610.6
|
604.0
|
3.1
|
3.6
|
250.1
|
2,941.9
|
441
|
|||
|
2012
|
911.4
|
721.2
|
28.5
|
161.7
|
652.0
|
645.1
|
3.2
|
3.8
|
259.4
|
3,201.4
|
451
|
|||
|
2013
|
962.1
|
753.1
|
31.8
|
177.2
|
699.1
|
692.0
|
3.2
|
3.9
|
262.9
|
3,464.3
|
458
|
|||
|
2014
|
1,013.7
|
786.4
|
34.4
|
192.9
|
750.5
|
743.2
|
3.3
|
4.0
|
263.2
|
3,727.5
|
462
|
|||
|
2015
|
1,067.4
|
821.5
|
37.6
|
208.3
|
805.4
|
797.9
|
3.3
|
4.2
|
262.0
|
3,989.5
|
463
|
|||
|
2016
|
1,122.8
|
858.1
|
41.0
|
223.7
|
864.4
|
856.8
|
3.4
|
4.3
|
258.3
|
4,247.8
|
462
|
|||
|
Low Cost:
|
||||||||||||||
|
2007
|
678.2
|
562.2
|
17.2
|
98.7
|
492.0
|
485.5
|
2.9
|
3.5
|
186.2
|
2,030.5
|
375
|
|||
|
2008
|
721.7
|
595.5
|
18.7
|
107.5
|
509.5
|
503.0
|
3.1
|
3.4
|
212.2
|
2,242.7
|
398
|
|||
|
2009
|
766.1
|
627.7
|
20.6
|
117.8
|
535.0
|
528.5
|
3.1
|
3.4
|
231.1
|
2,473.8
|
419
|
|||
|
2010
|
810.7
|
658.9
|
22.4
|
129.3
|
563.4
|
556.8
|
3.1
|
3.5
|
247.3
|
2,721.1
|
439
|
|||
|
2011
|
858.2
|
690.7
|
25.0
|
142.5
|
593.6
|
587.0
|
3.1
|
3.5
|
264.6
|
2,985.7
|
458
|
|||
|
2012
|
906.9
|
722.6
|
27.4
|
156.8
|
627.1
|
620.4
|
3.1
|
3.6
|
279.7
|
3,265.5
|
476
|
|||
|
2013
|
956.7
|
754.1
|
30.3
|
172.3
|
665.6
|
658.8
|
3.1
|
3.7
|
291.0
|
3,556.5
|
491
|
|||
|
2014
|
1,008.4
|
787.2
|
32.4
|
188.9
|
707.4
|
700.5
|
3.2
|
3.8
|
301.0
|
3,857.5
|
503
|
|||
|
2015
|
1,060.8
|
820.4
|
35.1
|
205.3
|
751.9
|
744.8
|
3.2
|
3.9
|
308.9
|
4,166.3
|
513
|
|||
|
2016
|
1,114.8
|
854.7
|
37.9
|
222.1
|
799.4
|
792.3
|
3.2
|
3.9
|
315.4
|
4,481.7
|
521
|
|||
|
High Cost:
|
||||||||||||||
|
2007
|
667.6
|
553.0
|
17.3
|
97.3
|
492.5
|
486.0
|
2.9
|
3.5
|
175.2
|
2,019.5
|
375
|
|||
|
2008
|
696.3
|
571.9
|
18.9
|
105.4
|
515.5
|
508.9
|
3.1
|
3.4
|
180.8
|
2,200.2
|
392
|
|||
|
2009
|
746.9
|
608.6
|
21.0
|
117.3
|
546.6
|
540.0
|
3.1
|
3.5
|
200.3
|
2,400.6
|
403
|
|||
|
2010
|
788.9
|
635.5
|
23.2
|
130.2
|
583.1
|
576.4
|
3.1
|
3.6
|
205.8
|
2,606.3
|
412
|
|||
|
2011
|
849.3
|
674.4
|
26.7
|
148.2
|
632.1
|
625.2
|
3.2
|
3.7
|
217.2
|
2,823.5
|
412
|
|||
|
2012
|
931.1
|
724.9
|
30.4
|
175.8
|
694.5
|
687.3
|
3.3
|
4.0
|
236.6
|
3,060.1
|
407
|
|||
|
2013
|
1,000.0
|
768.7
|
34.7
|
196.5
|
763.8
|
756.1
|
3.4
|
4.2
|
236.2
|
3,296.3
|
401
|
|||
|
2014
|
1,058.9
|
809.7
|
38.2
|
211.0
|
833.5
|
825.5
|
3.5
|
4.6
|
225.3
|
3,521.7
|
395
|
|||
|
2015
|
1,115.5
|
850.4
|
42.1
|
223.0
|
902.4
|
893.9
|
3.6
|
4.9
|
213.1
|
3,734.7
|
390
|
|||
|
2016
|
1,172.5
|
891.3
|
46.3
|
234.9
|
976.6
|
967.9
|
3.6
|
5.1
|
195.9
|
3,930.6
|
382
|
|||
| 1A detailed description of the components of income and cost, along with complete historical values, is presented in appendix A. 2"Total Income" column includes transfers made between the OASI Trust Fund and the General Fund of the Treasury that are not included in the separate components of income shown. These transfers consist of payments for (1) the cost of noncontributory wage credits for military service before 1957, and (2) the cost of benefits to certain uninsured persons who attained age 72 before 1968. Transfers for the cost of pre-1957 military service noncontributory wage credits were: (1) $414 million from the General Fund of the Treasury to the OASI Trust Fund in February 2002, and (2) $350 million from the trust fund to the general fund in December 2005. After 2006 such transfers are estimated to be less than $500,000 in each year. 3The "Trust fund ratio" column represents assets at the beginning of a year (which are identical to assets at the end of the prior year shown in the "Amount at end of year" column) as a percentage of cost for the year. |
Note: Totals do not necessarily equal the sums of rounded components.
Rising expenditures during 2007-16 reflect automatic benefit increases as well as the upward trend in the number of beneficiaries and in the average monthly earnings underlying benefits payable by the program. The growth in the number of beneficiaries in the past and the expected growth in the future result both from the increase in the aged population and from the increase in the proportion of the population which is eligible for benefits.
The estimates under all three sets of assumptions shown in table IV.A1 indicate that income to the OASI Trust Fund would substantially exceed expenditures in every year of the short-range projection period, and assets are therefore estimated to increase substantially.
The portion of the OASI Trust Fund that is not needed to meet day-to-day expenditures is used to purchase financial securities, generally special public-debt obligations of the U.S. Government. The cash used to make these purchases flows to the General Fund of the Treasury and is used to meet various Federal outlays or to reduce the amount of publicly-held Federal debt. Interest on these securities is credited to the trust fund and, when the securities mature they are reinvested in new securities if not immediately needed to pay program costs. When securities are redeemed prior to maturity in order to pay program costs, general fund revenues flow to the trust fund. Thus, the investment operations of the trust fund result in various credits and cash flows between the trust fund and the General Fund of the Treasury.
The estimated operations and financial status of the DI Trust Fund during calendar years 2007-16 under the three sets of assumptions are shown in table IV.A2, together with values for actual experience in 2002-06. Income is generally projected to increase steadily under each alternative, reflecting most of the same factors described previously in connection with the OASI Trust Fund. The estimates indicate that the assets of the DI Trust Fund would also continue to increase throughout the next 10 years under the low cost assumptions, but would peak in 2012 and then begin to decline under the intermediate assumptions. Under the high cost assumptions, DI assets would increase through 2007 and decline steadily thereafter until exhaustion in 2016.
Cost is estimated to increase in part due to increases in average benefit levels resulting from (1) automatic benefit increases and (2) projected increases in the amounts of average monthly earnings on which benefits are based. In addition, under all three sets of assumptions, the number of DI beneficiaries in current-payment status is projected to continue increasing throughout the short-range projection period. Over the period 2006-16, the projected annual average growth rate in the number of DI worker beneficiaries is roughly 1.7, 2.5, and 3.9 percent under alternatives I, II, and III, respectively. Growth is largely attributable to the gradual progression of the baby-boom generation through ages 50 to normal retirement age, at which higher rates of disability incidence are experienced.
Annual increases in incidence rates over the period 2001-03 represented a notable departure from the experience of the preceding decade, which generally showed modest annual declines in the age-sex-adjusted disability incidence rate.3 During 2004 and 2005 however, this growth in the incidence rate subsided, and the incidence rate even declined in 2006. Nevertheless, incidence rates are still at a level somewhat higher than experienced during the late 1990s. The increases in 2001-03 were likely due in large part to the slowdown in economic growth experienced during that period. However, a special administrative activity undertaken by SSA beginning in 2001 has also contributed slightly to the upsurge in disabled worker awards. This special workload was the result of discovering a substantial number of current or former recipients of Supplemental Security Income (SSI) benefits whose disability-insured status under the DI program was not previously recognized. As this special disability workload continues to be processed over the next several years, the resulting disability awards will contribute to temporarily higher incidence rates than would have been expected as part of longer term underlying trends.
Estimates of the total size of this special workload, and the schedule for processing these cases, remain roughly the same as assumed for the 2006 report. After the last of these special workload cases is processed in about 2010, the incidence of disability is projected in this report to drop back somewhat from then current levels, and to remain roughly level over the remainder of the short-range period under the three alternative sets of assumptions.
|
Calendar
year |
Income
|
Cost
|
Assets
|
|||||||||||
|---|---|---|---|---|---|---|---|---|---|---|---|---|---|---|
|
Total 2
|
Net
contri- butions |
Taxa-
tion of benefits |
Net
inter- est |
Total
|
Benefit
pay- ments |
Admin-
istra- tive costs |
RRB
inter- change |
Net
increase during year |
Amount
at end of year |
|||||
|
Historical data:
|
||||||||||||||
|
2002
|
$87.4
|
$77.3
|
$0.9
|
$9.2
|
$67.9
|
$65.7
|
$2.0
|
$0.2
|
$19.5
|
$160.5
|
208
|
|||
|
2003
|
88.1
|
77.4
|
.9
|
9.7
|
73.1
|
70.9
|
2.0
|
.2
|
15.0
|
175.4
|
219
|
|||
|
2004
|
91.4
|
80.3
|
1.1
|
10.0
|
80.6
|
78.2
|
2.2
|
.2
|
10.8
|
186.2
|
218
|
|||
|
2005
|
97.4
|
86.1
|
1.1
|
10.3
|
88.0
|
85.4
|
2.3
|
.3
|
9.4
|
195.6
|
212
|
|||
|
2006
|
102.6
|
90.8
|
1.2
|
10.6
|
94.5
|
91.7
|
2.3
|
.4
|
8.2
|
203.8
|
207
|
|||
|
Intermediate:
|
||||||||||||||
| |
2007
|
107.2
|
95.1
|
1.4
|
10.7
|
102.1
|
99.3
|
2.5
|
.4
|
5.1
|
208.9
|
200
|
||
|
2008
|
112.4
|
100.0
|
1.6
|
10.8
|
106.3
|
103.4
|
2.5
|
.4
|
6.2
|
215.1
|
197
|
|||
|
2009
|
118.8
|
105.8
|
1.8
|
11.1
|
113.0
|
110.0
|
2.6
|
.4
|
5.8
|
220.8
|
190
|
|||
|
2010
|
124.7
|
111.2
|
2.0
|
11.4
|
120.7
|
117.4
|
2.8
|
.5
|
4.0
|
224.8
|
183
|
|||
|
2011
|
130.9
|
116.9
|
2.3
|
11.7
|
126.8
|
123.3
|
3.0
|
.5
|
4.1
|
228.9
|
177
|
|||
|
2012
|
137.0
|
122.5
|
2.6
|
11.8
|
135.7
|
132.0
|
3.2
|
.5
|
1.3
|
230.2
|
169
|
|||
|
2013
|
142.8
|
127.9
|
3.0
|
11.9
|
143.7
|
139.8
|
3.4
|
.5
|
-.9
|
229.3
|
160
|
|||
|
2014
|
148.6
|
133.5
|
3.2
|
11.8
|
151.8
|
147.7
|
3.5
|
.5
|
-3.2
|
226.1
|
151
|
|||
|
2015
|
154.6
|
139.5
|
3.5
|
11.6
|
160.5
|
156.2
|
3.7
|
.5
|
-5.9
|
220.2
|
141
|
|||
|
2016
|
160.8
|
145.7
|
3.8
|
11.3
|
169.4
|
165.0
|
3.9
|
.5
|
-8.7
|
211.5
|
130
|
|||
|
Low Cost:
|
||||||||||||||
|
2007
|
107.6
|
95.5
|
1.4
|
10.7
|
100.6
|
97.8
|
2.5
|
.4
|
7.0
|
210.8
|
203
|
|||
|
2008
|
113.7
|
101.1
|
1.5
|
11.0
|
103.4
|
100.5
|
2.5
|
.4
|
10.3
|
221.1
|
204
|
|||
|
2009
|
119.8
|
106.6
|
1.7
|
11.5
|
108.3
|
105.2
|
2.6
|
.4
|
11.5
|
232.6
|
204
|
|||
|
2010
|
125.8
|
111.9
|
1.9
|
12.0
|
113.6
|
110.3
|
2.8
|
.5
|
12.3
|
244.9
|
205
|
|||
|
2011
|
132.1
|
117.3
|
2.1
|
12.7
|
117.2
|
113.8
|
2.9
|
.5
|
14.9
|
259.7
|
209
|
|||
|
2012
|
138.5
|
122.7
|
2.4
|
13.4
|
123.2
|
119.6
|
3.1
|
.5
|
15.3
|
275.0
|
211
|
|||
|
2013
|
145.0
|
128.1
|
2.7
|
14.3
|
128.4
|
124.7
|
3.3
|
.5
|
16.6
|
291.6
|
214
|
|||
|
2014
|
151.7
|
133.7
|
2.8
|
15.2
|
133.6
|
129.7
|
3.4
|
.5
|
18.1
|
309.7
|
218
|
|||
|
2015
|
158.5
|
139.3
|
3.0
|
16.2
|
139.3
|
135.2
|
3.6
|
.5
|
19.3
|
328.9
|
222
|
|||
|
2016
|
165.6
|
145.1
|
3.2
|
17.3
|
145.1
|
140.9
|
3.8
|
.4
|
20.5
|
349.5
|
227
|
|||
|
High Cost:
|
||||||||||||||
|
2007
|
105.9
|
93.9
|
1.5
|
10.5
|
105.4
|
102.5
|
2.5
|
.4
|
.5
|
204.3
|
193
|
|||
|
2008
|
109.0
|
97.1
|
1.7
|
10.3
|
112.3
|
109.5
|
2.5
|
.4
|
-3.3
|
201.1
|
182
|
|||
|
2009
|
115.3
|
103.3
|
1.9
|
10.0
|
121.9
|
118.9
|
2.6
|
.4
|
-6.6
|
194.4
|
165
|
|||
|
2010
|
119.6
|
107.9
|
2.3
|
9.5
|
132.9
|
129.6
|
2.8
|
.5
|
-13.2
|
181.2
|
146
|
|||
|
2011
|
125.9
|
114.5
|
2.6
|
8.7
|
143.6
|
140.0
|
3.1
|
.6
|
-17.8
|
163.4
|
126
|
|||
|
2012
|
133.9
|
123.1
|
3.1
|
7.7
|
159.6
|
155.8
|
3.3
|
.5
|
-25.7
|
137.7
|
102
|
|||
|
2013
|
140.4
|
130.5
|
3.7
|
6.2
|
174.3
|
170.2
|
3.6
|
.6
|
-33.9
|
103.8
|
79
|
|||
|
2014
|
146.0
|
137.5
|
4.0
|
4.5
|
188.2
|
183.8
|
3.8
|
.6
|
-42.2
|
61.6
|
55
|
|||
|
2015
|
151.1
|
144.4
|
4.4
|
2.3
|
202.0
|
197.4
|
4.0
|
.6
|
-50.9
|
10.7
|
30
|
|||
|
2016
|
151.4
|
4.9
|
216.7
|
211.9
|
4.2
|
.6
|
5
|
|||||||
| 1A detailed description of the components of income and cost, along with complete historical values, is presented in appendix A. 2"Total Income" column includes transfers made between the DI Trust Fund and the General Fund of the Treasury that are not included in the separate components of income shown. These transfers consist of payments for the cost of noncontributory wage credits for military service before 1957. In particular, a transfer is expected to be made in December 2007 in the amount of $7.7 million from the General Fund of the Treasury to the DI Trust Fund. Thereafter such transfers are estimated to be less than $500,000 in each year. 3The "Trust fund ratio" column represents assets at the beginning of a year (which are identical to assets at the end of the prior year shown in the "Amount at end of year" column) as a percentage of cost for the year. 4Under the high cost assumptions, the DI Trust Fund is projected to be exhausted in early 2016. Therefore, certain trust fund operation values for that year are not meaningful under present law and are not shown in this table. |
Note: Totals do not necessarily equal the sums of rounded components.
The proportion of DI beneficiaries whose benefits terminate in a given year has also fluctuated in the past. Over the last 20 years, the rates of benefit termination due to death or conversion to retirement benefits (at attainment of normal retirement age) have declined very gradually. This trend is attributable, in part, to the lower average age of new beneficiaries. Declines in mortality for the general population have also led to improved mortality experience among the DI disabled worker beneficiaries. In addition, conversions to old-age benefits are at a temporarily reduced level for years 2003 through 2008 due to the gradual increase in the normal retirement age. The termination rate due to recovery has been much more volatile. Currently, the proportion of disabled beneficiaries whose benefits cease because of their recovery from disability is very low in comparison to levels experienced throughout the 1970s and early 1980s. Projected rates of recovery terminations in this year's report are somewhat lower initially due to resource constraints which temporarily limit the number of continuing disability reviews conducted by SSA. Following this temporary resource constraint, recovery termination rates are projected to return to levels consistent with last year's report. The overall termination rate (reflecting all causes) is projected in 2007-08 to remain near levels experienced since 2003, before returning to higher levels in 2009 when the gradual increase in the normal retirement age temporarily ceases.
At the beginning of calendar year 2006, the assets of the DI Trust Fund represented 207 percent of annual expenditures. During 2006, DI expenditures continued to exceed non-interest income. While total DI income exceeded DI expenditures by $8.2 billion, the trust fund ratio for the beginning of 2007 still decreased, to about 200 percent. Under the intermediate set of assumptions, total income is estimated to exceed expenditures through 2012. The projected expenditures in excess of income beginning in 2013 result in a decline in the projected trust fund ratio to 130 percent by the beginning of 2016.
Under the low cost assumptions, the trust fund ratio would increase to 227 percent at the beginning of 2016. Under the high cost assumptions, the assets of the DI Trust Fund would decline steadily, dipping below the level of 1 year's expenditures near the beginning of 2012, and becoming completely depleted early in 2016.
Because DI assets were greater than 1 year's expenditures at the beginning of 2007 and would remain above that level through 2016, the DI Trust Fund satisfies the Trustees' short-range test of financial adequacy under both the intermediate and low cost assumptions. However, under the high cost assumptions the DI Trust Fund fails to meet the short-range test of financial adequacy, because assets fall below 1 year's expenditures by the end of the short-range period, as described above (see also figure IV.A1).
The estimated operations and status of the OASI and DI Trust Funds, combined, during calendar years 2007-16 on the basis of the three alternatives, are shown in table IV.A3, together with figures on actual experience in 2002-06. Because income and cost for the OASI Trust Fund represent over 80 percent of the corresponding amounts for the combined OASI and DI Trust Funds, the operations of the OASI Trust Fund tend to dominate the combined operations of the two funds. Consequently, based on the strength of the OASI Trust Fund over the next 10 years, the combined OASI and DI Trust Funds meet the requirements of the short-range test of financial adequacy under all three alternative sets of assumptions.
While combining the operations of the OASI and DI Trust Funds permits an assessment of the short-range test for the two programs on a combined basis, in practice assets from one trust fund cannot be shared with another trust fund without legislative changes to the Social Security Act. For example, under the high cost scenario, table IV.A2 shows that the DI Trust Fund becomes exhausted in 2016. The value of the combined OASI and DI Trust Funds in that year shown in table IV.A3 shows that OASI assets could be made available to pay DI benefits through 2016, but only with legislation to permit this action.
|
Calendar
year |
Income
|
Cost
|
Assets
|
|||||||||||
|---|---|---|---|---|---|---|---|---|---|---|---|---|---|---|
|
Total 2
|
Net
contri- butions |
Taxa-
tion of benefits |
Net
inter- est |
Total
|
Benefit
pay- ments |
Admin-
istra- tive costs |
RRB
inter- change |
Net
increase during year |
Amount
at end of year |
|||||
|
Historical data:
|
||||||||||||||
|
2002
|
$627.1
|
$532.5
|
$13.8
|
$80.4
|
$461.7
|
$453.8
|
$4.2
|
$3.6
|
$165.4
|
$1,378.0
|
263
|
|||
|
2003
|
631.9
|
533.5
|
13.4
|
84.9
|
479.1
|
470.8
|
4.6
|
3.7
|
152.8
|
1,530.8
|
288
|
|||
|
2004
|
657.7
|
553.0
|
15.7
|
89.0
|
501.6
|
493.3
|
4.5
|
3.8
|
156.1
|
1,686.8
|
305
|
|||
|
2005
|
701.8
|
592.9
|
14.9
|
94.3
|
529.9
|
520.7
|
5.3
|
3.9
|
171.8
|
1,858.7
|
318
|
|||
|
2006
|
744.9
|
625.6
|
16.9
|
102.4
|
555.4
|
546.2
|
5.3
|
3.8
|
189.5
|
2,048.1
|
335
|
|||
|
Intermediate:
|
||||||||||||||
| |
2007
|
782.8
|
655.0
|
18.7
|
109.2
|
594.3
|
585.0
|
5.4
|
3.9
|
188.5
|
2,236.6
|
345
|
||
|
2008
|
827.5
|
689.2
|
20.4
|
117.9
|
617.3
|
607.9
|
5.6
|
3.8
|
210.2
|
2,446.8
|
362
|
|||
|
2009
|
881.6
|
729.0
|
22.6
|
130.0
|
652.5
|
642.9
|
5.7
|
3.9
|
229.1
|
2,675.9
|
375
|
|||
|
2010
|
935.0
|
766.3
|
24.9
|
143.7
|
694.2
|
684.3
|
5.9
|
4.0
|
240.7
|
2,916.6
|
385
|
|||
|
2011
|
991.6
|
805.1
|
28.1
|
158.5
|
737.4
|
727.2
|
6.1
|
4.1
|
254.2
|
3,170.8
|
396
|
|||
|
2012
|
1,048.4
|
843.6
|
31.2
|
173.6
|
787.6
|
777.0
|
6.3
|
4.3
|
260.7
|
3,431.5
|
403
|
|||
|
2013
|
1,104.9
|
881.0
|
34.8
|
189.1
|
842.8
|
831.8
|
6.6
|
4.4
|
262.1
|
3,693.6
|
407
|
|||
|
2014
|
1,162.3
|
920.0
|
37.6
|
204.7
|
902.3
|
890.9
|
6.8
|
4.6
|
260.0
|
3,953.6
|
409
|
|||
|
2015
|
1,221.9
|
961.0
|
41.1
|
219.9
|
965.9
|
954.1
|
7.0
|
4.7
|
256.1
|
4,209.7
|
409
|
|||
|
2016
|
1,283.5
|
1,003.8
|
44.8
|
235.0
|
1,033.8
|
1,021.8
|
7.3
|
4.8
|
249.7
|
4,459.3
|
407
|
|||
|
Low Cost:
|
||||||||||||||
|
2007
|
$785.8
|
$657.7
|
$18.6
|
$109.5
|
$592.6
|
$583.3
|
$5.4
|
$3.9
|
$193.2
|
$2,241.3
|
346
|
|||
|
2008
|
835.4
|
696.6
|
20.3
|
118.5
|
613.0
|
603.6
|
5.6
|
3.8
|
222.5
|
2,463.8
|
366
|
|||
|
2009
|
885.9
|
734.3
|
22.3
|
129.3
|
643.3
|
633.7
|
5.7
|
3.9
|
242.6
|
2,706.4
|
383
|
|||
|
2010
|
936.5
|
770.8
|
24.3
|
141.3
|
676.9
|
667.1
|
5.9
|
4.0
|
259.6
|
2,966.0
|
400
|
|||
|
2011
|
990.2
|
807.9
|
27.2
|
155.1
|
710.8
|
700.8
|
6.0
|
4.0
|
279.4
|
3,245.4
|
417
|
|||
|
2012
|
1,045.4
|
845.3
|
29.8
|
170.2
|
750.4
|
740.1
|
6.2
|
4.1
|
295.0
|
3,540.5
|
433
|
|||
|
2013
|
1,101.7
|
882.2
|
33.0
|
186.5
|
794.1
|
783.5
|
6.4
|
4.2
|
307.6
|
3,848.1
|
446
|
|||
|
2014
|
1,160.2
|
920.8
|
35.3
|
204.1
|
841.1
|
830.2
|
6.6
|
4.2
|
319.1
|
4,167.2
|
458
|
|||
|
2015
|
1,219.3
|
959.7
|
38.1
|
221.5
|
891.2
|
880.0
|
6.8
|
4.3
|
328.1
|
4,495.3
|
468
|
|||
|
2016
|
1,280.4
|
999.9
|
41.1
|
239.4
|
944.5
|
933.1
|
7.0
|
4.3
|
335.9
|
4,831.2
|
476
|
|||
|
High Cost:
|
||||||||||||||
|
2007
|
773.5
|
646.9
|
18.7
|
107.8
|
597.8
|
588.5
|
5.4
|
3.9
|
175.7
|
2,223.8
|
343
|
|||
|
2008
|
805.3
|
669.0
|
20.6
|
115.7
|
627.8
|
618.4
|
5.6
|
3.8
|
177.5
|
2,401.3
|
354
|
|||
|
2009
|
862.2
|
711.9
|
23.0
|
127.3
|
668.5
|
658.9
|
5.7
|
3.9
|
193.7
|
2,595.0
|
359
|
|||
|
2010
|
908.5
|
743.4
|
25.5
|
139.7
|
716.0
|
706.0
|
5.9
|
4.1
|
192.6
|
2,787.5
|
362
|
|||
|
2011
|
975.1
|
788.9
|
29.3
|
156.9
|
775.7
|
765.2
|
6.3
|
4.2
|
199.4
|
2,986.9
|
359
|
|||
|
2012
|
1,065.0
|
848.0
|
33.5
|
183.5
|
854.2
|
843.0
|
6.7
|
4.5
|
210.9
|
3,197.8
|
350
|
|||
|
2013
|
1,140.4
|
899.3
|
38.4
|
202.7
|
938.1
|
926.3
|
7.0
|
4.8
|
202.3
|
3,400.1
|
341
|
|||
|
2014
|
1,204.9
|
947.2
|
42.2
|
215.5
|
1,021.7
|
1,009.3
|
7.3
|
5.2
|
183.2
|
3,583.3
|
333
|
|||
|
2015
|
1,266.6
|
994.8
|
46.5
|
225.3
|
1,104.4
|
1,091.4
|
7.6
|
5.5
|
162.2
|
3,745.4
|
324
|
|||
|
2016
|
1,327.7
|
1,042.7
|
51.2
|
233.9
|
1,193.3
|
1,179.8
|
7.9
|
5.7
|
134.4
|
3,879.9
|
314
|
|||
| 1A detailed description of the components of income and cost, along with complete historical values, is presented in appendix A. 2"Total Income" column includes transfers made between the OASI and DI Trust Funds and the General Fund of the Treasury that are not included in the separate components of income shown. These transfers consist of payments for (1) the cost of noncontributory wage credits for military service before 1957, and (2) the cost of benefits to certain uninsured persons who attained age 72 before 1968. 3The "Trust fund ratio" column represents assets at the beginning of a year (which are identical to assets at the end of the prior year shown in the "Amount at end of year" column) as a percentage of cost for the year. |
Note: Totals do not necessarily equal the sums of rounded components.
The factors underlying the changes in the intermediate estimates for the OASI, DI and the combined funds from last year's annual report to this report are analyzed in table IV.A4. In the 2006 Annual Report, the trust fund ratio for OASI was estimated to reach 462 percent at the beginning of 2015-the tenth projection year from that report. If there had been no changes to the projections, the estimated ratio at the beginning of 2016 would be 1 percentage point lower than at the beginning of 2015, or 461 percent. There were changes, however, to reflect the latest actual data, as well as adjustments to the assumptions for future years. The resulting ratio shown in this report for the tenth projection year (2016) is 462 percent. The net effect of changes in demographic assumptions over the short-range period resulted in a reduction in the tenth-year trust fund ratio of 3 percentage points. The cumulative net effects of changes in economic data and assumptions resulted in essentially no change in the trust fund ratio by the beginning of 2016. There were several relatively minor changes in the short-range projection methodology since the 2006 report. The changes included improvements in our methods for estimating the numbers of persons satisfying the program's insured status requirements, and the seasonal pattern of benefit receipt. The combined effects of these methodological improvements was to decrease the ending trust fund ratio by about 4 percentage points. Finally, an increase in the 2016 trust fund ratio of 8 percentage points resulted from the correction of the clerical error related to voluntary income tax withholding described in section III.A. A relatively small portion of that increase is attributable to a reimbursement authorized by Public Law 109-465 (its effect is shown in table IV.A4 attributed to "Legislation"). The majority of the effect due to this correction, including the effect on projected benefit levels, is shown under "Programmatic data and assumptions."
Corresponding estimates of the factors underlying the changes in the financial projections for the DI Trust Fund, and for the OASI and DI Trust Funds combined, are also shown in table IV.A4. The largest effect on the DI trust fund ratio at the beginning of 2016 was due to the change in the valuation period, making up essentially all of the total 9 percentage point reduction. Revised economic assumptions, updates for a variety of programmatic assumptions, and the voluntary income tax withholding correction contributed minor and offsetting changes.
| 1Change in trust fund ratio of less than 0.5 percentage point. |
Note: Totals do not necessarily equal the sums of rounded components.
1The estimates shown in this subsection reflect 12 months of benefit payments in each year of the short-range projection period. In practice, the actual payment dates have at times been shifted over calendar year boundaries as a result of the statutory requirement that benefit checks be delivered early when the normal check delivery date is a Saturday, Sunday, or legal public holiday. The annual benefit figures are shown as if those benefit checks were delivered on the usual date.
2Note that the pattern, by alternative, of these nominal amounts of total taxable earnings is not what might be expected, but the reverse, because of the varying inflation assumptions embedded in the respective estimates.
3Historical and projected patterns of disability incidence rates are described in greater detail in section V.C.6.
|
|
|
|
|
|
| Privacy Policy | Website Policies & Other Important Information | Site Map | Actuarial Publications | April 23, 2007 | |