This section presents projections of the numbers of persons receiving Federal SSI payments by category and age group.
1 The SSI recipient categories of: (1)
aged; or (2)
blind or
disabled identify the criteria under which the recipient established eligibility for SSI benefit
s. The following paragraphs discuss the recipient categories in more detail.
|
•
|
Aged recipients establish their eligibility for SSI benefits by meeting the age-65 -or-older requirement 2 and other SSI eligibility requirements. In December 2012, 1.2 million aged individuals received Federally-administered SSI payments.
|
|
•
|
Blind or disabled recipients establish their eligibility for SSI benefits by meeting the definition of blindness or disability and the applicable income and resource limits as well as any other SSI eligibility requirements. In December 2012, there were 7.1 million blind or disabled recipients of Federally-administered SSI payments. These recipients can fall into two subcategories based on age: blind or disabled adults (age 18 or older) and blind or disabled children (under age 18).
|
|
—
|
Blind or disabled adults meet the definition of blindness or disability for individuals age 18 or older and SSI income and resource limits. Students age 18 to 21 must meet the adult definition of disability; they differ from other adults only in that they qualify for a special student earned income exclusion. When blind or disabled adult recipients reach age 65, we generally continue to classify them as blind or disabled adults (rather than aged). In December 2012, 5.8 million blind or disabled individuals age 18 or older received Federally-administered SSI payments, including 925 thousand disabled or blind recipients age 65 or older.
|
|
—
|
Blind or disabled children meet the definition of blindness or disability for individuals under age 18. These children are subject to parent-to-child deeming until they reach the age of 18. At age 18 these individuals continue to be eligible for SSI if they meet the definition of blindness or disability for individuals age 18 or older as well as other eligibility criteria. We reclassify those who continue to be eligible after age 18 as blind or disabled adults. In December 2012, 1.3 million blind or disabled individuals under age 18 received Federally-administered SSI payments.
|
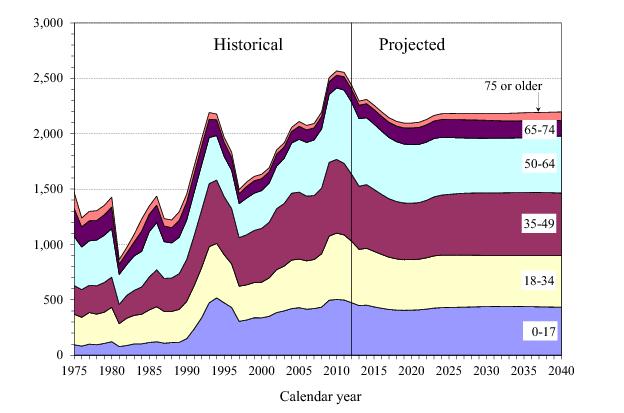
Table IV.B1 presents historical and projected numbers of persons applying for SSI benefits by calendar year. Figure IV.B1 presents the same information as a graph. Following a 4-year period in the mid-2000s when applications remained fairly level at 2.1 million per year, applications started increasing in 2008, largely due to the severe economic recession that began at the end of 2007 and continued into 2009. The level of applications, which continued to increase through 2010, decreased only slightly in 2011 as the economy recovered slowly but decreased at a faster rate in 2012 as the economic recovery continued. We are projecting that applications will decline to 2.1 million in 2018 and remain at that lower level through 2022, reflecting the impact of individuals coming on the SSI rolls earlier due to the economic downturn, and then grow slightly, leveling off at about 2.2 million per year in 2024. This leveling off of the projected applications is a significant change from the projected applications in the 2012 SSI Annual Report where we estimated that applications would grow roughly in line with the overall population after a period of economic recovery.
This change in the projected ultimate growth pattern of the applications is due to two improvements in our projection methodology designed to make the projections more consistent with the assumptions underlying the OASDI Trustees Report. First, we reduced application growth due to the expectation that the portion of the population that meets SSI income and resource requirements will decline over time as the CPI, and therefore the SSI Federal benefit rate, is projected to grow at a slower rate than average wages and income generally. Second, we further adjusted the growth in applications to reflect the slower growth projected for the portion of the Social Security area population composed of U.S. citizens or legal immigrants as compared to the overall population because SSI recipients must come from this portion of the population.
Table IV.B1.—
SSI Federally-Administered Applications,
a Calendar Years 1974‑2037
|
|
|
|
|
|
|
|
|
|
|
|
|
|
|
|
|
|
|
|
|
|
|
|
|
|
|
|
|
|
|
|
|
|
|
|
|
|
|
|
|
|
|
|
|
|
|
|
|
|
|
|
|
|
|
|
|
|
|
|
|
|
|
|
|
|
|
|
|
|
|
|
|
|
|
|
|
|
|
|
|
|
|
|
|
|
|
|
|
|
|
|
|
|
|
|
|
|
|
|
|
|
|
|
|
|
|
|
|
|
|
|
|
|
|
|
|
|
|
|
|
|
|
|
|
|
|
|
|
|
|
|
|
|
|
|
|
|
|
|
|
|
|
|
|
|
|
|
|
|
|
|
|
|
|
|
|
|
|
|
|
|
|
|
|
|
|
|
|
|
|
|
|
|
|
|
|
|
|
|
|
|
|
|
|
|
|
|
|
|
|
|
|
|
|
|
|
|
|
|
|
|
|
|
|
|
|
|
|
|
|
|
|
|
|
|
|
|
|
|
|
|
|
|
|
|
|
|
|
|
|
|
|
|
|
|
|
|
|
|
|
|
|
|
|
|
|
|
|
|
|
|
|
|
|
|
|
|
|
|
|
|
|
|
|
|
|
|
|
|
|
|
|
|
|
|
|
|
|
|
|
|
|
|
|
|
|
|
|
|
|
|
|
|
|
|
|
|
|
|
|
|
|
|
|
|
|
|
|
|
|
|
|
|
|
|
|
|
|
|
|
|
|
|
|
|
|
|
|
|
|
|
|
|
|
|
|
|
|
|
|
|
|
|
|
|
|
|
|
|
|
|
|
|
|
|
|
|
|
|
|
|
|
|
|
|
|
|
|
|
|
|
|
|
|
|
|
|
|
|
|
|
|
|
|
|
|
|
|
|
|
|
|
|
|
|
|
|
|
|
|
|
|
|
|
|
|
|
|
|
|
|
|
|
|
|
|
|
|
|
|
|
|
|
|
|
|
|
|
|
|
|
|
|
|
|
|
|
|
|
|
|
|
|
|
|
|
|
|
|
|
|
|
|
|
|
|
|
|
|
|
|
|
|
|
|
|
|
|
|
|
|
|
|
|
|
|
|
|
|
|
|
|
|
|
|
|
|
|
|
|
|
|
|
|
|
|
|
|
|
|
|
|
|
|
|
|
|
|
|
|
|
|
|
|
|
|
|
|
|
|
|
|
|
|
|
|
|
|
|
|
|
|
|
|
|
|
|
|
|
|
|
|
|
|
|
|
|
|
|
|
|
|
|
|
|
|
|
|
|
|
|
|
|
|
|
|
|
|
|
|
|
|
|
|
|
|
|
|
|
|
|
|
|
|
|
|
|
|
|
|
|
|
|
|
|
|
|
|
|
|
|
|
|
|
|
|
|
|
|
|
|
|
|
|
|
|
|
|
|
|
|
|
|
|
|
|
|
|
|
|
|
|
|
|
|
|
|
|
|
|
|
|
|
|
|
|
|
|
|
|
|
|
|
|
|
|
|
|
|
|
|
|
|
|
|
|
|
|
|
|
|
|
|
|
|
|
|
|
|
|
|
|
|
|
|
|
|
|
|
|
|
|
|
|
|
|
|
|
|
|
|
|
|
|
|
|
|
|
|
|
|
|
|
|
|
|
|
|
|
|
|
|
|
|
|
|
|
|
|
|
|
|
|
|
|
|
|
|
|
|
|
|
|
|
|
|
|
|
|
|
|
|
|
|
|
|
|
|
|
|
|
|
|
|
|
|
|
|
|
|
|
|
|
|
|
|
|
|
|
|
|
|
|
|
|
|
|
|
|
|
|
|
|
|
|
|
|
|
|
|
|
|
|
|
|
|
|
|
|
|
|
|
|
|
|
|
|
|
|
|
|
|
|
|
|
|
|
|
|
|
|
|
|
|
|
|
|
|
|
|
|
|
|
|
|
|
|
|
|
|
|
|
|
|
|
|
|
|
|
|
|
|
|
|
|
|
|
|
|
|
|
|
|
|
|
|
|
|
|
|
|
|
|
|
|
|
|
|
|
|
|
|
|
|
|
|
|
|
|
|
|
|
|
|
|
|
|
|
|
|
|
|
|
|
|
|
Note: Totals do not necessarily equal the sums of rounded components. We estimate the historical split among age groups on a calendar year of age basis.
As part of SSA’s adjudication of these applications, we evaluate levels of income and resources available to the applicants as well as other eligibility factors including marital and citizenship status and living arrangements. In addition, well over 90 percent of the SSI applications are for disability benefits that require the DDS to evaluate the alleged impairment. Applicants may appeal an unfavorable disability determination through several administrative levels of appeal. If an applicant exhausts all administrative levels of appeal, he or she may appeal to the Federal courts.
3
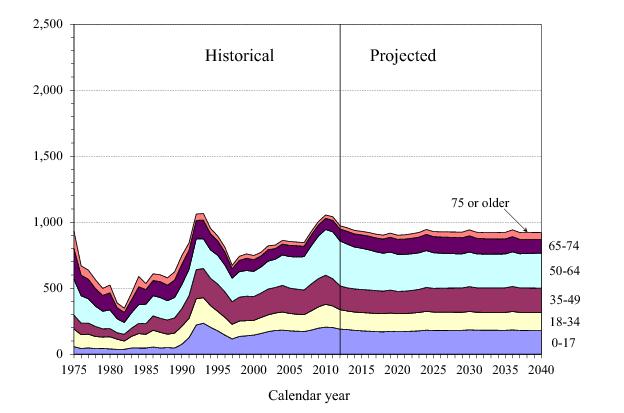
Table IV.B2 and figure
IV.B2 present historical and projected numbers of persons who start receiving SSI payments as a result of this decision process. We count individuals as of the first month that they move into SSI payment status. For this reason, we refer to these individuals as “
new recipients” rather than “
awards.”
4 From 2004 to 2007, the numbers of new recipients remained fairly level, roughly consistent with the applications received during this period. Starting in 2008, however, the numbers of new recipients increased substantially. This increase is attributable to: (1) the sharp increase in applications due to the economic downturn; (2) improvements in claims processing; and (3) initiatives to accelerate the processing of cases pending adjudication.
Note: Totals do not necessarily equal the sums of rounded components. We estimate the historical split among age groups on a calendar year of age basis.
The numbers of new recipients declined slightly in 2011 and more sharply in 2012, similar to the change in applications. Consistent with the pattern of projected applications, we project the total number of new recipients to continue to decline from the peak in 2010 and then to reach a relative low point by 2020. Over the longer term, we project the number of new recipients to level off and remain essentially level throughout the projection period. These projected new recipients reflect the adjustments to the projected applications to make them more consistent with the assumptions underlying the OASDI Trustees Report.
Some persons receiving SSI benefits in a year will stop receiving payments during the year because of death or the loss of SSI eligibility. A recipient can lose eligibility in two ways: (1) a nonmedical redetermination; or (2) a continuing disability review (CDR).
5 In a redetermination, we reexamine the recipient's nonmedical factors of eligibility, including income and resources. In a CDR, we determine whether the recipient continues to meet the Social Security Act's definition of disability. For example, disabled children, upon attainment of age 18, lose eligibility if they do not qualify for benefits under the disabled adult eligibility criteria. We refer to the net reduction in the number of SSI recipients in
current-payment status during a period as the number of SSI terminations for that period.
In the following tables, we have separated the numbers of persons moving out of payment status into terminations due to death (table
IV.B3), as well as terminations for all other reasons (table
IV.B4). Table
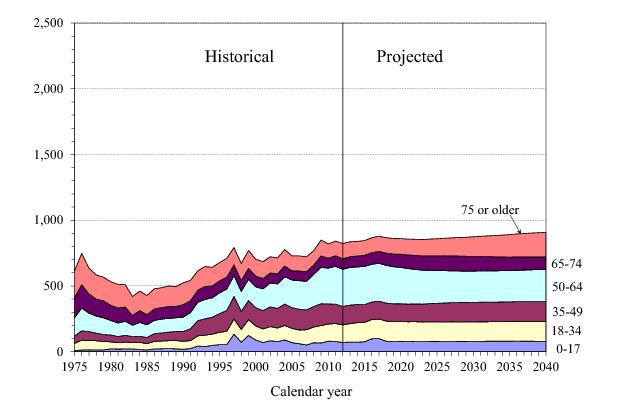
IV.B5 and figure
IV.B3 present historical and projected numbers of total terminations by calendar year. The overall total number of terminations in 2012 decreased by about 2 percent from 2011. This decrease in the number of Federally-administered terminations is due in part to a decrease in the number of terminations for State recipients not receiving Federal benefits. In addition, some of the decrease is attributable to a decrease in the number of new SSI recipients concurrently eligible for OASDI disability benefits who received SSI benefits only temporarily during the 5-month SSDI waiting period due to the 2012 decrease in new recipients.
Table IV.B3.—
SSI Federally-Administered Terminations Due to Death
a, Calendar Years 1974‑2037
|
|
|
|
|
|
|
|
|
|
|
|
|
|
|
|
|
|
|
|
|
|
|
|
|
|
|
|
|
|
|
|
|
|
|
|
|
|
|
|
|
|
|
|
|
|
|
|
|
|
|
|
|
|
|
|
|
|
|
|
|
|
|
|
|
|
|
|
|
|
|
|
|
|
|
|
|
|
|
|
|
|
|
|
|
|
|
|
|
|
|
|
|
|
|
|
|
|
|
|
|
|
|
|
|
|
|
|
|
|
|
|
|
|
|
|
|
|
|
|
|
|
|
|
|
|
|
|
|
|
|
|
|
|
|
|
|
|
|
|
|
|
|
|
|
|
|
|
|
|
|
|
|
|
|
|
|
|
|
|
|
|
|
|
|
|
|
|
|
|
|
|
|
|
|
|
|
|
|
|
|
|
|
|
|
|
|
|
|
|
|
|
|
|
|
|
|
|
|
|
|
|
|
|
|
|
|
|
|
|
|
|
|
|
|
|
|
|
|
|
|
|
|
|
|
|
|
|
|
|
|
|
|
|
|
|
|
|
|
|
|
|
|
|
|
|
|
|
|
|
|
|
|
|
|
|
|
|
|
|
|
|
|
|
|
|
|
|
|
|
|
|
|
|
|
|
|
|
|
|
|
|
|
|
|
|
|
|
|
|
|
|
|
|
|
|
|
|
|
|
|
|
|
|
|
|
|
|
|
|
|
|
|
|
|
|
|
|
|
|
|
|
|
|
|
|
|
|
|
|
|
|
|
|
|
|
|
|
|
|
|
|
|
|
|
|
|
|
|
|
|
|
|
|
|
|
|
|
|
|
|
|
|
|
|
|
|
|
|
|
|
|
|
|
|
|
|
|
|
|
|
|
|
|
|
|
|
|
|
|
|
|
|
|
|
|
|
|
|
|
|
|
|
|
|
|
|
|
|
|
|
|
|
|
|
|
|
|
|
|
|
|
|
|
|
|
|
|
|
|
|
|
|
|
|
|
|
|
|
|
|
|
|
|
|
|
|
|
|
|
|
|
|
|
|
|
|
|
|
|
|
|
|
|
|
|
|
|
|
|
|
|
|
|
|
|
|
|
|
|
|
|
|
|
|
|
|
|
|
|
|
|
|
|
|
|
|
|
|
|
|
|
|
|
|
|
|
|
|
|
|
|
|
|
|
|
|
|
|
|
|
|
|
|
|
|
|
|
|
|
|
|
|
|
|
|
|
|
|
|
|
|
|
|
|
|
|
|
|
|
|
|
|
|
|
|
|
|
|
|
|
|
|
|
|
|
|
|
|
|
|
|
|
|
|
|
|
|
|
|
|
|
|
|
|
|
|
|
|
|
|
|
|
|
|
|
|
|
|
|
|
|
|
|
|
|
|
|
|
|
|
|
|
|
|
|
|
|
|
|
|
|
|
|
|
|
|
|
|
|
|
|
|
|
|
|
|
|
|
|
|
|
|
|
|
|
|
|
|
|
|
|
|
|
|
|
|
|
|
|
|
|
|
|
|
|
|
|
|
|
|
|
|
|
|
|
|
|
|
|
|
|
|
|
|
|
|
|
|
|
|
|
|
|
|
|
|
|
|
|
|
|
|
|
|
|
|
|
|
|
|
|
|
|
|
|
|
|
|
|
|
|
|
|
|
|
|
|
|
|
|
|
|
|
|
|
|
|
|
|
|
|
|
|
|
|
|
|
|
|
|
|
|
|
|
|
|
|
|
|
|
|
|
|
|
|
|
|
|
|
|
|
|
|
|
|
|
|
|
|
|
|
|
|
|
|
|
|
|
|
|
|
|
|
|
|
|
|
|
|
|
|
|
|
|
|
|
|
|
|
|
|
|
|
|
|
|
|
|
|
|
|
|
|
|
|
|
|
|
|
|
|
|
|
|
|
|
|
|
|
|
|
|
|
|
|
|
|
|
|
|
|
|
|
|
|
|
|
|
|
|
|
|
|
|
|
|
|
|
|
|
|
|
|
|
|
|
|
|
|
|
|
|
|
|
|
|
|
|
|
|
|
|
|
|
|
|
|
|
|
|
|
|
|
|
|
|
|
|
|
|
|
|
|
|
|
|
Note: Totals do not necessarily equal the sums of rounded components. We estimate the historical split among age groups on a calendar year of age basis.
Note: Totals do not necessarily equal the sums of rounded components. We estimate the historical split among age groups on a calendar year of age basis.
Note: Totals do not necessarily equal the sums of rounded components. We estimate the historical split among age groups on a calendar year of age basis.
Note: Totals do not necessarily equal the sums of rounded components. We estimate the historical split among age groups on a calendar year of age basis.
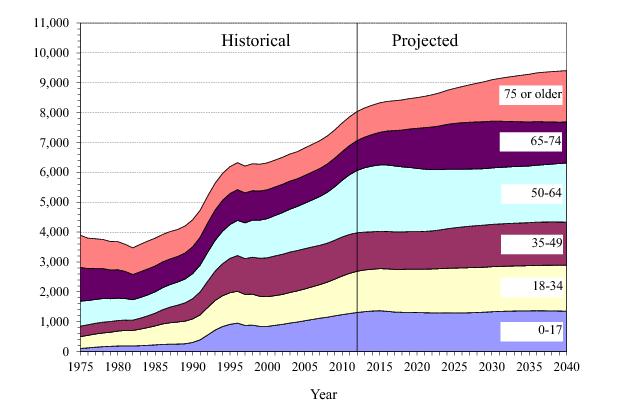
Combining the number of persons coming on the SSI payment rolls during a year with the number of those already receiving benefits at the beginning of the year, and subtracting the number leaving the rolls during the year, yields the number of persons receiving Federally-administered SSI payments at the end of the year. Table IV.B6 and figure IV.B4 present the number of individuals receiving Federal SSI payments, who comprise the great majority of Federally-administered recipients. The number of Federal SSI recipients at the end of 2012 increased by about 2.2 percent over the corresponding number at the end of 2011, a somewhat smaller increase than experienced between 2010 and 2011.
As figure IV.B4 illustrates, the implementation of Public Law 104-121 and Public Law 104-193 resulted in a decline in the Federal recipient population from 1996 to 1997. From the end of 1997 through the end of 2000, the Federal SSI recipient population grew at an annual rate of less than 1 percent. From the end of 2000 to the end of 2008, the Federal SSI recipient population grew an average of 1.7 percent per year. Since the end of 2008, the Federal recipient population has grown an average of 2.7 percent per year due largely to the economic recession and continuing economic downturn. As the economy slowly recovers, we project somewhat slower growth in the recipient population with year-to-year increases averaging approximately 1.2 percent from the end of 2012 through the end of 2015.
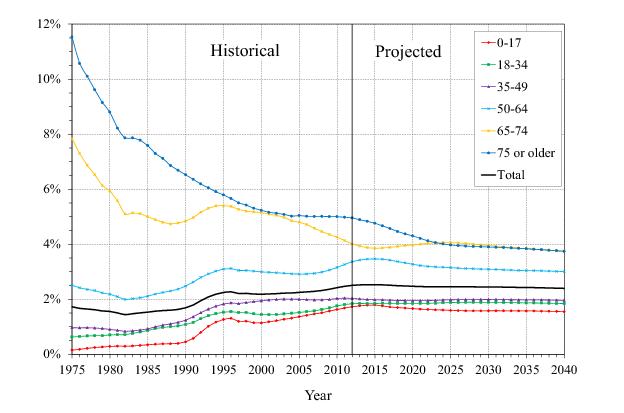
Beginning in 2015, the numbers of Federal SSI recipients are projected to grow at a rate of less than 1 percent per year for the remainder of the 25-year projection period. In order to place this projected growth in the context of overall population growth, table IV.B7 and figure IV.B5 present Federal SSI prevalence rates, defined as SSI recipients with Federal benefits in current-payment status as percentages of selected Social Security area population totals.
In table IV.B7, we calculated the age group percentages using the corresponding population age group totals. We computed the ratios for the separate recipient categories—
total blind or disabled and
total aged—as percentages of differing base populations, the total Social Security Area population and the 65 and older Social Security population, respectively. As a result of this method of calculation, the percentage for the total SSI recipient population is not the arithmetic sum of the percentages for the respective recipient categories. The prevalence rate for all Federal SSI recipients declined from 1975 through the early 1980s. In 1983, this percentage started increasing and continued to increase through 1996. The prevalence rate then declined in 1997, due to the implementation of Public Law 104-121 and Public Law 104-193, but leveled out over the next few years. It has increased slightly over the past few years, and we expect it to continue to increase slightly through 2015 and then decrease gradually through the rest of the projection period.
The various subcategories of Federal SSI recipients follow significantly different growth patterns in relation to their respective population totals. The overall aged prevalence rate has declined steadily throughout the historical period. We project that it will continue to decline through 2027, and then remain fairly level thereafter through the rest of the projection period, as the portion of the aged population over 74 increases. In contrast, except for decreases in the late 1990s due to the eligibility redeterminations and continuing disability reviews mandated by Public Law 104-193, the prevalence rate for blind or disabled children increased steadily throughout the historical period, with the increase being quite steep in the early 1990s. The total blind or disabled prevalence rate (as a percentage of the total population at all ages) remained fairly level until the early 1980s, when it started increasing and then continued to increase through 1996. The blind or disabled prevalence rate declined slightly in the late 1990s due to the effects of welfare reform legislation, but resumed its upward trend in 2000. That upward trend has continued through 2012, and we estimate it will continue through 2015, reaching 2.2 percent of the total population. In the later years of the projection period, the estimated overall prevalence rate for blind or disabled recipients will gradually decline due to: (1) the SSI-eligible population growing more slowly than the overall population, (2) a smaller proportion of the population becoming new recipients than during the recent economic slowdown; (3) the changing age distribution in the population; and (4) our assumption that SSA will receive the resources necessary to process normal CDR and nonmedical redetermination workloads.
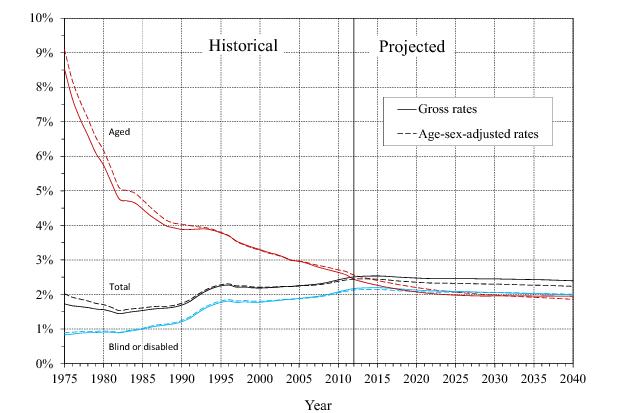
Figure IV.B6 presents prevalence rates on an age-sex-adjusted basis, adjusted to the age-sex distribution of the Social Security area population for the year 2004. Adjusting these rates in this manner is useful when comparing rates over a long period of time because the age-sex-adjusted rates control for the effects that a changing age-sex distribution in the population can have on prevalence rates over time. We do not, however, account for the change over time of other factors that may affect the percentage of the Social Security area population that is SSI-eligible.
A review of the chart below shows that the age-sex adjustment does not change the overall pattern of the prevalence rates. The overall SSI prevalence rate on an age-sex adjusted basis is higher in the early years and lower in the projection period than the gross prevalence rate. The adjustment generally results in a more noticeable effect for the aged, especially in the early years of the SSI program, due in part to the aged prevalence rate being quite high in those early years.
Table IV.B8 presents historical and projected numbers of individuals who receive only a Federally-administered State supplement.
Note: Totals do not necessarily equal the sums of rounded components. We estimate the historical split among age groups on a calendar year of age basis.
Table IV.B9 displays the combined numbers of persons receiving either a Federal SSI payment or a Federally-administered State supplement.
Certain noteworthy patterns appear in the numbers of SSI recipients in the recent past and projections of such numbers for the near future. The total number of SSI recipients increased rapidly in the early 1990s due to the growth in the numbers of disabled adults and children. The growth in the numbers of children receiving SSI resulted in large part from the Supreme Court decision in the case of
Sullivan v. Zebley, 110 S. Ct. 885 (1990), which greatly expanded the criteria used for determining disability for children. The growth in the numbers of disabled adults is a more complicated phenomenon. Extensive research conducted under contract to SSA and the Department of Health and Human Services suggests that this growth was the result of a combination of factors including: (1) demographic trends; (2) a downturn in the economy in the late 1980s and early 1990s; (3) long-term structural changes in the economy; and (4) changes in other support programs (in particular, the reduction or elimination of general assistance programs in certain States). The 1996 welfare reform legislation, the economic downturn in the early 2000s, and the recent economic recession that began late in 2007 have contributed to the more recent changes in program participation.
Note: Totals do not necessarily equal the sums of rounded components. We estimate the historical split among age groups on a calendar year of age basis.