To estimate future amounts of Federal expenditures under SSI, we first modify the projected Federal benefit rates (table
IV.A2) to reflect actual payment levels, taking into account historical and projected levels of adjustments for other actual or deemed income. We combine these actual payment levels with the projected numbers of persons receiving Federal SSI payments to generate estimates of the amounts of Federal SSI payments. Table
IV.C1 shows historical amounts of such payments by calendar year. We compute these payment amounts on a cash-flow basis, which is consistent with the concepts used to define SSI obligations for the Federal Budget. As a result, for months after January 1978, when SSI payments are due on the first of the month and the first of the month falls on a weekend or Federal holiday, we tabulate these payments in the previous month.
1
Since we use this cash-flow concept, payments in table IV.C1 differ from similar amounts in other Social Security Administration publications, such as the
Annual Statistical Supplement to the Social Security Bulletin, in two main ways. First, tabulations of payments in the
Annual Statistical Supplement group payments by the month the payment is due, while table
IV.C1 groups payments by the month in which we actually make the payments. In particular, since January 1 of each year is a Federal holiday, SSI payments due on January 1 of years 1979 and later are actually paid in December of the previous year. For example, the calendar year 2012 payment amounts shown in table
IV.C1 reflect payments made in January-December 2012, and include the payments due on January 1, 2013 (which were actually paid in December 2012), but not the payments due on January 1, 2012 (which were actually paid in December 2011). Second, beginning in 1991, SSA remitted overpayment recoveries directly to the Department of the Treasury and did not use them to reduce SSI obligations as accounted for in the Federal Budget. Tabulations in the
Annual Statistical Supplement continue to report payment amounts that are reduced by such overpayment recoveries.
Table IV.C2 presents corresponding amounts of SSI outlays on a fiscal year basis for fiscal years
2 1978-2013. We omit fiscal years prior to 1978 because SSI payment amounts are not readily available on a fiscal year basis for these years. As with the calendar year figures, we show these fiscal year amounts on a cash-flow basis. Consequently, fiscal year totals may contain 11, 12, or 13 months of payments.
3
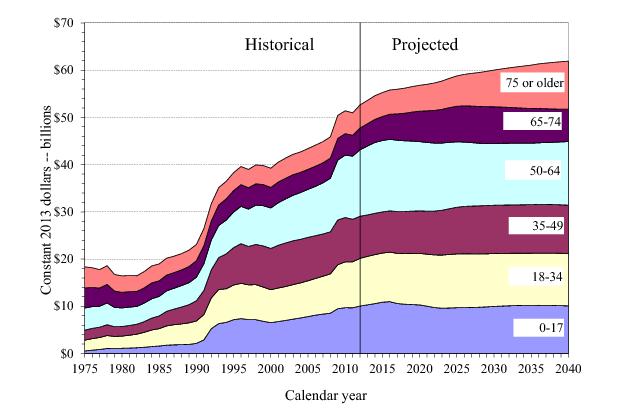
The declining value of the dollar due to inflation can make it difficult to make meaningful comparisons of dollar amounts over longer periods of time. For this reason, it is desirable to have some means of removing inflation from the 25-year projections of SSI expenditures. The CPI, which we discuss in section IV.A, is an appropriate means of standardizing projected SSI costs over time. Table IV.C3 presents CPI-indexed dollar values of Federal SSI payments (those adjusted by the
CPI) for both the historical period, calendar years 1974-2012, and the full 25-year projection period, 2013-37. We present this same information as a graph in figure IV.C1. We base the projections of the CPI used for this standardization on the intermediate economic assumptions of the 2013 OASDI Trustees Report.
The future growth in the “CPI-indexed dollar” estimates is primarily attributable to the underlying growth in the U.S. population (table
IV.A1). A notable aspect of this time series of constant dollar estimates is the rather sharp level increase from 2008 to 2009 in these amounts. This level shift is the result of the combination of the spike in the CPI for the third quarter of calendar year 2008, which caused the large 5.8 percent benefit rate increase for 2009 and the subsequent drop in the CPI for 2009.
Although we do not prepare detailed projections of the SSI State supplementation payments that SSA administers, we present historical information on the amounts of such supplements in Table
IV.C4 for two broad recipient categories. These amounts are consistent with tabulations in the
Annual Statistical Supplement to the Social Security Bulletin.
Previously, this report included historical information on State-administered State supplementary payments, but complete data for all States are not available. The SSA publication,
State Assistance Programs for SSI Recipients4 provides information on selected characteristics of State assistance programs for SSI recipients.