2015 OASDI Trustees Report

skip to main content
Table of Contents Previous Next Tables Figures Index

D. PROJECTIONS OF FUTURE FINANCIAL STATUS
Short-Range Actuarial Estimates
For the short-range period (2015 through 2024), the Trustees measure financial adequacy by comparing projected asset reserves at the beginning of each year to projected program cost for that year under the intermediate set of assumptions. Maintaining a trust fund ratio of 100 percent or more — that is, reserves at the beginning of each year at least equal to projected cost for the year — is a good indication that the trust fund can cover most short-term contingencies. The projected trust fund ratios under the intermediate assumptions for OASI alone, and for OASI and DI combined, exceed 100 percent throughout the short-range period. Therefore, OASI and OASDI satisfy the Trustees’ short-term test of financial adequacy. However, the DI Trust Fund fails the Trustees’ short-term test of financial adequacy. The Trustees estimate that the DI trust fund ratio was at 40 percent at the beginning of 2015. The projected DI trust fund ratio then declines until the trust fund reserves become depleted in the fourth quarter of 2016. Figure II.D1 shows that the trust fund ratios for the theoretical combined OASI and DI Trust Funds decline consistently after 2010. Figure II.D3 illustrates the implications of reserve depletion for the DI Trust Fund alone.
As it has since 2010, projected OASDI cost exceeds non-interest income throughout the short-range period. Cost is less than total income until 2020, when cost begins to exceed total income. While trust fund reserves continue to grow through 2019, they grow more slowly than cost, causing the trust fund ratio to decline, as shown in figure II.D1.
Long-Range Actuarial Estimates
The Trustees use three types of measures to assess the actuarial status of the program over the next 75 years: (1) annual cash-flow measures, including income rates, cost rates, and balances; (2) trust fund ratios; and (3) summary measures such as actuarial balances and open group unfunded obligations. The Trustees express these measures as percentages of taxable payroll, as percentages of gross domestic product (GDP), or in dollars. The Trustees also present summary measures over the infinite horizon in Appendix F. The infinite horizon values, which are subject to much greater uncertainty, provide an additional indication of Social Security’s very-long-run financial condition.
The Trustees also apply a test of long-range close actuarial balance each year. To satisfy the test, a trust fund must meet two conditions: (1) the trust fund satisfies the short-range test of financial adequacy, and (2) the trust fund ratio stays above zero throughout the 75-year projection period, such that benefits would be payable in a timely manner throughout the period. The OASI, DI, and theoretical combined OASI and DI Trust Funds all fail the test of long-range close actuarial balance under the intermediate assumptions.
Annual Income Rates, Cost Rates, and Balances
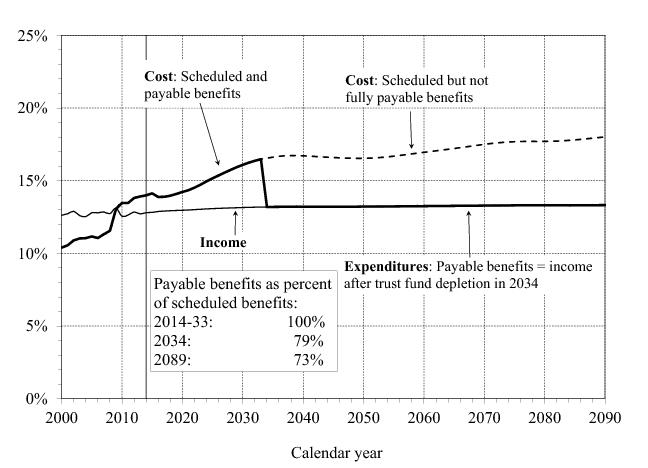
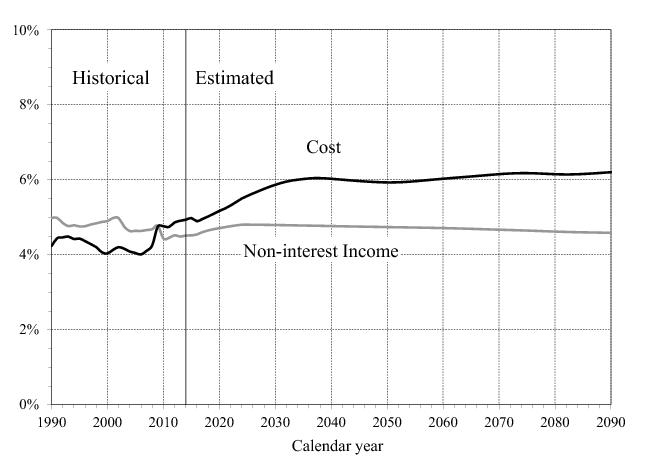
Figure II.D2 illustrates the year-by-year relationship among OASDI income (excluding interest), cost (including scheduled benefits), and expenditures (including payable benefits) for the full 75-year period (2015 through 2089). The figure shows all values as percentages of taxable payroll. Under the intermediate assumptions, demographic factors would by themselves cause the projected cost rate to rise rapidly for the next two decades before leveling off in about 2035. However, the recent recession led to lower taxable earnings than expected and more beneficiaries than expected, which in turn sharply increased the cost rate. This recession effect obscures the underlying rising trend in the cost rate for the next few years. The projected income rate is stable at about 13 percent throughout the 75-year period.
Annual OASDI cost exceeded non-interest income in 2010 for the first time since 1983. The Trustees project that cost will continue to exceed non-interest income throughout the 75-year valuation period. Nevertheless, total trust fund income, including interest income, is more than is necessary to cover costs through 2019, so trust fund asset reserves continue to grow. Beginning in 2020, cost exceeds total income, and theoretical combined OASI and DI Trust Fund reserves diminish until they become depleted in 2034. After trust fund reserve depletion, continuing income is sufficient to support expenditures at a level of 79 percent of program cost for the rest of 2034, declining to 73 percent for 2089. Figure II.D2 depicts OASDI operations as a theoretical combined whole. However, under current law, the differences between scheduled and payable benefits would begin at different times for the program’s two trust funds: in 2016 for DI and in 2035 for OASI.
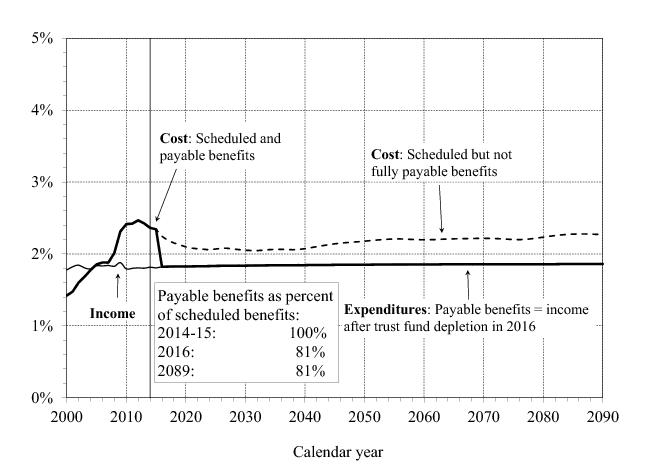
To illustrate the more immediate challenges specific to the DI program, figure II.D3 presents the year-by-year relationship among income, cost, and expenditures for the 75-year projection period. The DI Trust Fund reserves are expected to deplete in the fourth quarter of 2016 if no legislative action is taken before then. After DI Trust Fund reserve depletion, continuing income is sufficient to support expenditures at a level of 81 percent of program cost for the rest of 2016, rising to a somewhat higher level for 2020 through 2040, then declining to 81 percent by 2089.
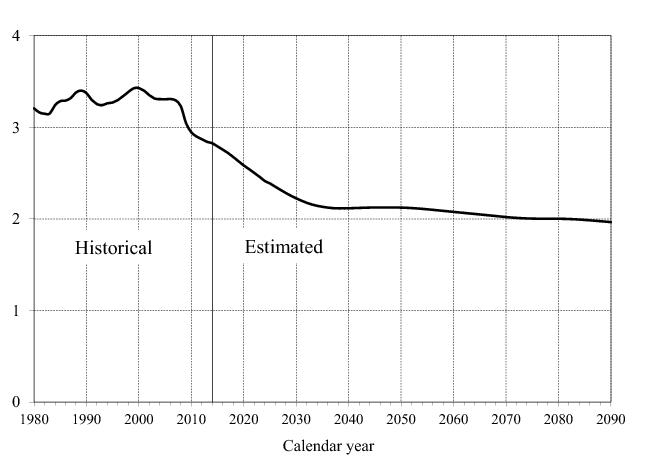
 Figure II.D4 shows the estimated number of workers per beneficiary. Figures II.D2 and II.D4 illustrate the inverse relationship between cost rates and the number of workers per beneficiary. In particular, the projected future increase in the cost rate reflects a projected decline in the number of covered workers per beneficiary. There were about 2.8 workers for every OASDI beneficiary in 2014. This ratio had been extremely stable, remaining between 3.2 and 3.4 from 1974 through 2008, and has declined since then due to the economic recession and the beginning of the demographic shift that will drive this ratio down over the next 20 years. The Trustees project that the ratio of workers to beneficiaries will continue to decline, even as the economy recovers, due to this demographic shift — as workers of lower-birth-rate generations replace workers of the baby-boom generation. The ratio of workers to beneficiaries reaches 2.1 by 2035 when the baby-boom generation will have largely retired, with a further gradual decline thereafter due to increasing longevity.
 
Figure II.D4.—Number of Covered Workers Per OASDI Beneficiary
Another important way to look at Social Security’s future is to view its annual cost and non-interest income as a share of U.S. economic output (GDP). As shown in figure II.D5, the Trustees project that Social Security’s cost as a percent of GDP will grow from 4.4 percent in 2008 to about 6.0 percent by 2035, then decline to 5.9 percent by 2050, and generally increase to 6.2 percent by 2089. As the economy recovers, Social Security’s non-interest income, which reflects scheduled tax rates, increases from its current level of about 4.5 percent of GDP to about 4.8 percent of GDP for 2025. Thereafter, non-interest income as a percent of GDP declines gradually, to about 4.6 percent by 2089, because the Trustees expect the share of employee compensation provided as noncovered fringe benefits to increase gradually.
Trust Fund Ratios
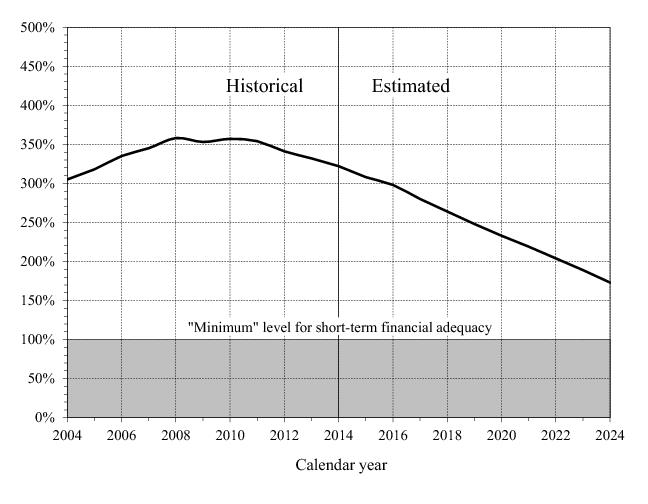
The trust fund ratio is defined as the asset reserves at the beginning of a year expressed as a percentage of the cost during the year. The trust fund ratio thus represents the proportion of a year’s cost which could be paid solely with the reserves at the beginning of the year. Table II.D1 displays the projected maximum trust fund ratios during the long-range period for the OASI, DI, and combined OASI and DI funds. The table also shows the year of maximum projected trust fund ratio during the long-range projection period (2015‑89) and the year of trust fund reserve depletion. Each trust fund ratio has been generally declining in recent years. OASI reached a peak level of 402 in 2011, DI reached a peak level of 219 in 2003, and OASDI reached a peak level of 358 in 2008.
Summary Measures
The actuarial balance is a summary measure of the program’s financial status through the end of the 75-year valuation period. The actuarial balance measure includes the trust fund asset reserves at the beginning of the period, all cost and income during the valuation period, and the cost of reaching a target trust fund reserve of one year’s cost by the end of the period. Therefore, the actuarial balance is essentially the difference between the present values of income and cost from 1937 through the end of the valuation period. The Trustees express actuarial balance as a percentage of the taxable payroll for the 75-year valuation period, and refer to a negative actuarial balance as an actuarial deficit. The actuarial deficit represents the average amount of change in income or cost that is needed throughout the valuation period in order to achieve actuarial balance.
In this report, the actuarial deficit for the combined OASI and DI Trust Funds under the intermediate assumptions is 2.68 percent of taxable payroll. The actuarial deficit was 2.88 percent in the 2014 report. If the assumptions, methods, starting values, and the law had all remained unchanged from last year, the actuarial deficit would have increased to 2.94 percent of payroll solely due to advancing the valuation period by 1 year. Changes in methods, starting values, and economic assumptions combined to account for most of the remaining change in the actuarial deficit.
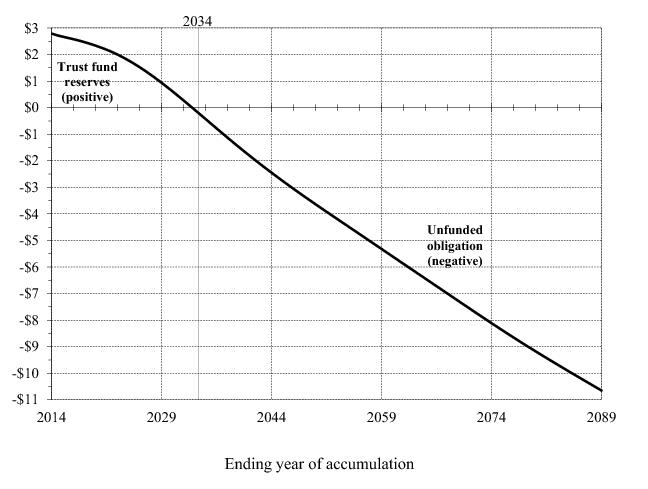
Another way to illustrate the projected financial shortfall of the OASDI program is to examine the cumulative present value of scheduled income less cost. Figure II.D6 shows the present value of cumulative OASDI income less cost from the inception of the program through each of the years from 2014 to 2089. A positive value represents the present value of trust fund reserves at the end of the selected year. A negative value is the unfunded obligation through the selected year. The asset reserves of the combined trust funds were $2.8 trillion at the end of 2014. The trust fund reserves decline on a present value basis after 2014, but remain positive through 2033. However, after 2033 this cumulative amount becomes negative, which means that the combined OASI and DI Trust Funds have a net unfunded obligation through each year after 2033. Through the end of 2089, the combined funds have a present-value unfunded obligation of $10.7 trillion. If the assumptions, methods, starting values, and the law had all remained unchanged from last year, the unfunded obligation would have risen to about $11.1 trillion due to the change in the valuation date. The remaining change in the unfunded obligation is primarily due to changes in methods, starting values, and economic assumptions.
This unfunded obligation represents 2.53 percent of taxable payroll and 0.9 percent of GDP for the 75-year valuation period. The unfunded obligation as a share of taxable payroll (2.53 percent) and the actuarial deficit (2.68 percent) are similar measures, but differ because the actuarial deficit includes the cost of having an ending trust fund reserve equal to 1 year’s cost.
Figures II.D2, II.D5, and II.D6 show that the program’s financial condition is worsening at the end of the projection period. Trends in annual balances and cumulative values toward the end of the 75-year period provide an indication of the program’s ability to maintain solvency beyond 75 years. Consideration of summary measures alone for a 75‑year period can lead to incorrect perceptions and to policy prescriptions that do not achieve sustainable solvency.1
Appendix F presents summary measures over the infinite horizon. The infinite horizon values provide an additional indication of Social Security’s financial condition for the period beginning with the inception of the program and extending indefinitely into the future, but results are subject to much greater uncertainty. Extending the horizon beyond 75 years increases the measured unfunded obligation. Through the infinite horizon, the unfunded obligation, or shortfall, is equivalent to 3.9 percent of future taxable payroll or 1.3 percent of future GDP.
Uncertainty of the Projections
Significant uncertainty surrounds the intermediate assumptions. The Trustees use several methods to help illustrate that uncertainty.
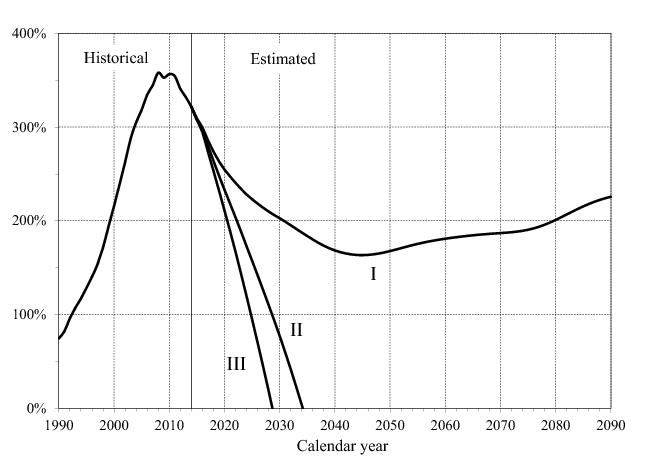
A first approach uses alternative scenarios reflecting low-cost (alternative I) and high-cost (alternative III) sets of assumptions. Figure II.D7 shows the projected trust fund ratios for the combined OASI and DI Trust Funds under the intermediate, low-cost, and high-cost assumptions. The low-cost alternative includes a higher ultimate total fertility rate, slower improvement in mortality, a higher real-wage differential, a higher ultimate real interest rate, a higher ultimate annual change in the CPI, and a lower unemployment rate. The high-cost alternative, in contrast, includes a lower ultimate total fertility rate, more rapid improvement in mortality, a lower real-wage differential, a lower ultimate real interest rate, a lower ultimate annual change in the CPI, and a higher unemployment rate. These alternatives are not intended to suggest that all parameters would be likely to differ from the intermediate values in the specified directions, but are intended to illustrate the effect of clearly defined scenarios that are, on balance, very favorable or unfavorable for the program’s financial status. Actual future costs are unlikely to be as extreme as those portrayed by the low-cost or high-cost projections. The method for constructing the low-cost and high-cost projections does not lend itself to estimating the probability that actual experience will lie within or outside the range they define.
Appendix D of this report presents long-range sensitivity analysis for the OASDI program. By varying one parameter at a time, sensitivity analysis provides a second approach for illustrating the uncertainty surrounding projections into the future.
A third approach uses stochastic simulations that reflect randomly assigned annual values for each parameter. These simulations produce a distribution of projections and corresponding probabilities that future outcomes will fall within or outside a given range. The results of the stochastic simulations, discussed in more detail in appendix E, suggest that trust fund reserve depletion (i.e., the point at which the trust fund ratio reaches zero) is very likely by mid-century. In particular, figure II.D8 suggests that based on these stochastic simulations, trust fund asset reserves will deplete between 2029 and 2046 with a 95‑percent probability.
The stochastic results suggest that trust fund ratios as high as the low-cost alternative are very unlikely. However, the relationship between the stochastic results and the low-cost and high-cost alternatives may change as the methodology for the stochastic simulations is further developed. As noted in appendix E, future improvements and refinements are expected to be more likely to expand rather than reduce the indicated range of uncertainty.
Changes From Last Year’s Report
The projected long-range OASDI actuarial deficit decreased from 2.88 percent of taxable payroll for last year’s report to 2.68 percent of taxable payroll for this year’s report. The change in the 75-year projection period alone would have increased the actuarial deficit to 2.94 percent. Changes in methods, starting values, and economic assumptions combined to account for most of the remaining change in the actuarial deficit. For a detailed description of the specific changes identified in table II.D2, see section IV.B6.
Valuation period 1

1
The change in the 75-year valuation period from last year’s report to this report means that the 75-year actuarial balance now includes the relatively large negative annual balance for 2089. This change in the valuation period results in a larger long-range actuarial deficit. The actuarial deficit includes the trust fund reserve at the beginning of the projection period.

Note: Totals do not necessarily equal the sums of rounded components.
Figure II.D9 compares this year’s projections of annual balances (non-interest income minus cost) to those in last year’s report. The annual balances in this year’s report are significantly higher throughout the projection period. See page 78 for details.
 

1
Sustainable solvency for the financing of the program under a specified set of assumptions has been achieved when the projected trust fund ratio is positive throughout the 75-year projection period and is either stable or rising at the end of the period.


Table of Contents Previous Next Tables Figures Index
SSA Home | Privacy Policy | Website Policies & Other Important Information | Site Map | Actuarial Publications July 22, 2015