2025 OASDI Trustees Report

skip to main content
Table of Contents Previous Next Tables Figures Index

D. PROJECTIONS OF FUTURE FINANCIAL STATUS
Short-Range Actuarial Estimates
For the short-range period (2025 through 2034), the Trustees measure financial adequacy using trust fund ratios, which compare projected reserves at the beginning of a year to projected program cost for the year. Maintaining a trust fund ratio of 100 percent or more — meaning reserves at the beginning of a year at least equal to the projected cost for the year — is a good indication that the trust fund can cover most short-term contingencies.
The Trustees' test of short-range financial adequacy is met if, under the intermediate assumptions:
Under the intermediate assumptions, the projected trust fund ratio for the OASI Trust Fund declines to 89 percent by the beginning of 2029 and remains below 100 percent for the remainder of the short-range period, until reserves become depleted in the first quarter of 2033. Therefore, OASI fails the test of short-range financial adequacy.
The DI Trust Fund satisfies the test of short-range financial adequacy because the trust fund ratio stays above 100 percent throughout the 10-year short-range period. The DI trust fund ratio is estimated to be 108 percent at the beginning of 2025 and is projected to increase through the end of the short-range period.
On a combined basis, OASDI fails the test of short-range financial adequacy because the OASDI trust fund ratio declines to 95 percent by the beginning of 2029 and remains below 100 percent for the remainder of the short-range period, until reserves become depleted in the third quarter of 2034. Figure II.D1 shows that the OASDI trust fund ratio is expected to decline throughout the short-range period, as it has since 2010.
For this report, the level of the combined trust fund reserves is projected to decline in 2025, as it has since 2021, and to continue to decline throughout the remainder of the short-range period.
Long-Range Actuarial Estimates
The Trustees use three types of measures to assess the program’s actuarial status over the long-range period (2025 through 2099):
These measures are expressed as percentages of taxable payroll, as percentages of GDP, or in dollars.
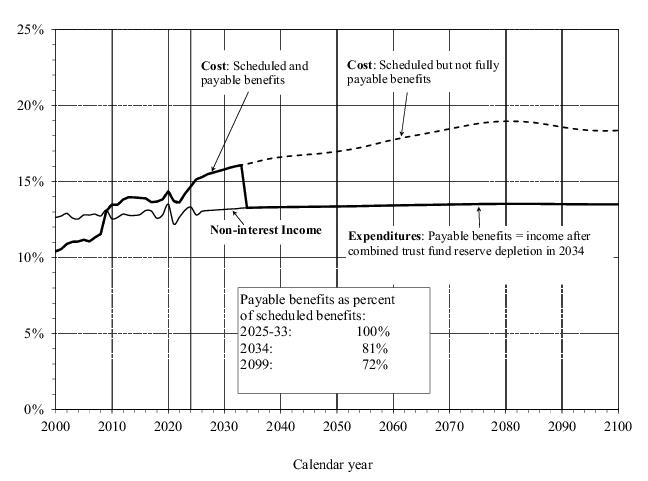
1
The Trustees also apply a test of long-range close actuarial balance each year. To satisfy the test, a trust fund must meet two conditions:
Under the intermediate assumptions, the OASI Trust Fund and the combined OASI and DI Trust Funds fail the test of long-range close actuarial balance, while the DI Trust Fund satisfies the test.
Annual Income Rates, Cost Rates, and Balances
Figure II.D2 illustrates the year-by-year relationship among OASDI income (excluding interest), cost (including scheduled benefits), and expenditures (including payable benefits) starting in 2000 and for the full 75-year projection period, which is 2025 through 2099. The figure shows all values as percentages of taxable payroll.
Under the intermediate assumptions, demographic factors cause the projected cost rate to rise rapidly until about 2040, rise more gradually through 2080, and then generally decline through 2099. After some small fluctuations through 2025, the income rate is projected to be relatively stable at somewhat above 13 percent throughout the remainder of the 75‑year period ending in 2099.
Annual OASDI cost has exceeded non-interest income every year beginning with 2010. Cost is projected to continue to exceed non-interest income throughout the 75-year valuation period. Cost is projected to exceed total income in 2025, as it has each year beginning in 2021, and combined OASI and DI Trust Fund reserves decline until they become depleted in 2034.
After trust fund reserve depletion, continuing income is sufficient to support expenditures at a level of 81 percent of program cost for the rest of 2034, declining to 72 percent for 2099. Figure II.D2 depicts OASDI operations as a combined whole.
However, under current law, the differences between scheduled and payable benefits for OASI would begin in 2033, when the OASI Trust Fund is projected to become depleted. Scheduled benefits equal payable benefits for DI throughout the entire 75-year projection period, because the DI Trust Fund is not projected to become depleted during the period.
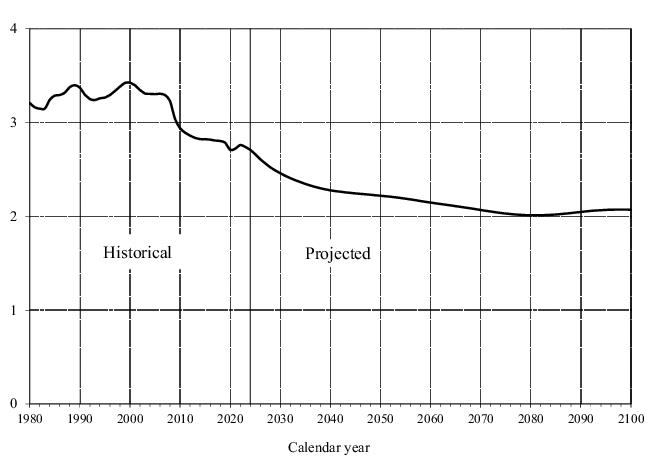
Figure II.D3 shows the estimated number of covered workers per OASDI beneficiary. Figures II.D2 and II.D3 illustrate the inverse relationship between cost rates and the number of workers per beneficiary. In particular, the projected future increase in the cost rate reflects a projected decline in the number of covered workers per beneficiary. There were about 2.7 workers for every OASDI beneficiary in 2024.
This ratio had been stable, remaining between 3.2 and 3.4 from 1974 through 2008. It has generally declined since then, initially due to the economic recession of 2007-09 and the beginning of a notable demographic shift. This shift causes the ratio of workers to beneficiaries to decline, as workers of lower-birth-rate generations replace workers of the baby-boom generation. The decline in the ratio slowed substantially between 2013 and 2019 as the economy’s recovery largely offset the demographic shift during that period. The ratio declined slightly in 2020 and then increased slightly by 2022, due to effects of the pandemic-induced recession and recovery on the number of workers.
The underlying demographic shift will continue to drive this ratio down over the next 10 to 15 years. The ratio of workers to beneficiaries reaches 2.3 by 2040, when the baby-boom generation will have largely retired, and will generally decline very gradually thereafter due to increasing longevity.
Figure II.D3.—Number of Covered Workers Per OASDI Beneficiary
Another important way to look at Social Security’s future actuarial status is to view its annual cost and non-interest income as a share of U.S. economic output (GDP). As shown in figure II.D4, Social Security’s cost as a percentage of GDP is generally projected to grow from 5.3 percent in 2025 to a peak of about 6.4 percent for 2079 and then generally decline to 6.1 percent by 2099. Social Security’s non-interest income is 4.5 percent of GDP in 2025 and rises gradually to a peak of about 4.7 percent by 2035. Thereafter, non-interest income as a percentage of GDP declines gradually, to about 4.5 percent for 2099.
Trust Fund Ratios
The trust fund ratio is defined as the reserves at the beginning of a year expressed as a percentage of the cost during the year. The trust fund ratio thus represents the proportion of a year’s cost that could be paid solely with the accumulated reserves at the beginning of the year.
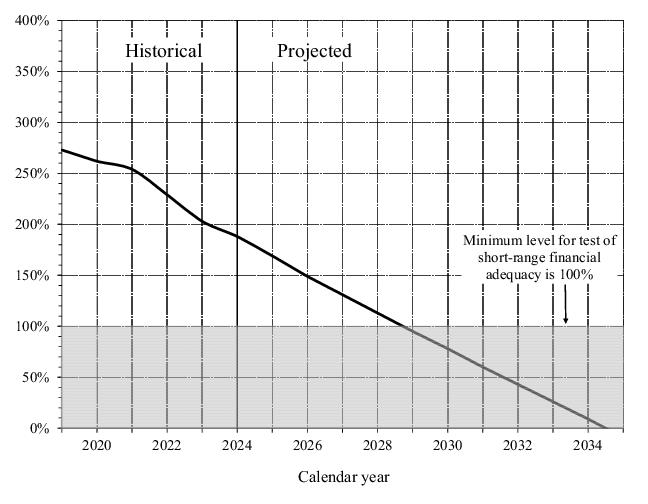
Table II.D1 displays the projected maximum trust fund ratios during the long-range period for the OASI, DI, and combined OASI and DI funds. The table also shows the year of maximum projected trust fund ratio during the long-range projection period (2025 through 2099) and the year of trust fund reserve depletion.
Trust fund ratios for OASI and OASDI are projected to decline from their current levels until reserve depletion. For DI, the trust fund ratio is projected to rise throughout the 75-year projection period from 108 percent of annual cost in 2025 to 777 percent of annual cost at the beginning of 2099. Figure II.D7 illustrates these patterns.
Projected year of trust fund reserve depletion

a
The trust fund is not projected to become depleted during the 75-year period ending in 2099.

Summary Measures
The actuarial balance is a summary measure of the program’s financial status through the end of the 75-year valuation period. The actuarial balance measure includes:
The actuarial balance is essentially the difference between the present values of income and cost from 1937 through the end of the valuation period, expressed as a percentage of the taxable payroll for the 75-year valuation period.
A negative actuarial balance is called an actuarial deficit. The actuarial deficit represents the average amount of change in income or cost that is needed throughout the valuation period in order to achieve actuarial balance.
In this report, the actuarial deficit for the combined OASI and DI Trust Funds under the intermediate assumptions is 3.82 percent of taxable payroll. The actuarial deficit was 3.50 percent of payroll in the 2024 report. If the assumptions, methods, starting values, and the law had all remained unchanged from last year, the actuarial deficit would have increased to 3.56 percent of payroll solely due to advancing the valuation period by 1 year, from 2024 through 2098 for last year’s report to 2025 through 2099 for this year’s report. The actuarial deficit is 1.3 percent of GDP in this year’s report, an increase from 1.2 percent in last year’s report.
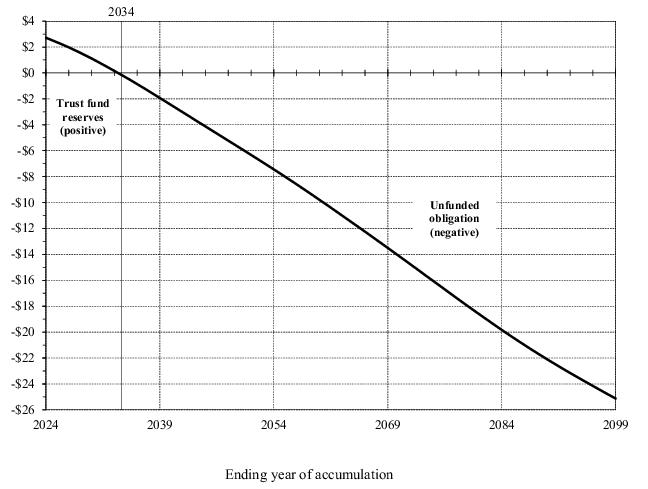
Another way to illustrate the OASDI program’s projected financial shortfall is to examine the cumulative present value of scheduled income less cost. Figure II.D5 shows the present value of cumulative OASDI income less cost from the program’s inception through each of the years from 2024 to 2099. A positive value represents the present value of trust fund reserves at the end of the selected year. A negative value is the unfunded obligation through the selected year.
The combined trust funds’ reserves were about $2.72 trillion at the end of 2024. The combined trust fund reserves decline on a present value basis after 2024, but remain positive through 2033.
However, this cumulative amount becomes negative beginning in 2034, which means that the combined OASI and DI Trust Funds have a net unfunded obligation through the end of each year after 2033. Through the end of 2099, the combined funds have a present-value unfunded obligation of $25.1 trillion. If the assumptions, methods, starting values, and the law had all remained unchanged from last year, the unfunded obligation in this year’s report would have risen to about $23.5 trillion due to the change in the valuation date and the extension of the valuation period through an additional year, 2099.
The unfunded obligation for this report represents 3.64 percent of taxable payroll and 1.3 percent of GDP for 2025 through 2099. This is an increase from the unfunded obligation of 3.32 percent of taxable payroll and 1.2 percent of GDP for 2024 through 2098 in last year’s report. The unfunded obligation as a share of taxable payroll over the period (3.64 percent) and the actuarial deficit (3.82 percent) are similar measures, but they differ because the actuarial deficit includes the cost of having an ending trust fund reserve equal to 1 year’s cost.
Figures II.D2, II.D4, and II.D5 show that the program’s actuarial status will deteriorate throughout the projection period if current law is not altered. Negative annual balances and increasing cumulative shortfalls toward the end of the 75-year period indicate the additional change that will be needed by then in order to maintain solvency beyond 75 years. Consideration of summary measures alone for a 75‑year period can lead to incorrect perceptions and to policy prescriptions that do not achieve sustainable solvency.2
Appendix F presents summary measures over the infinite horizon. The infinite horizon values provide an additional indication of Social Security’s actuarial status extending indefinitely into the future, but results are subject to much greater uncertainty. Extending the horizon beyond 75 years increases the measured unfunded obligation. Through the infinite horizon, the unfunded obligation is equivalent to 5.2 percent of future taxable payroll or 1.6 percent of future GDP.
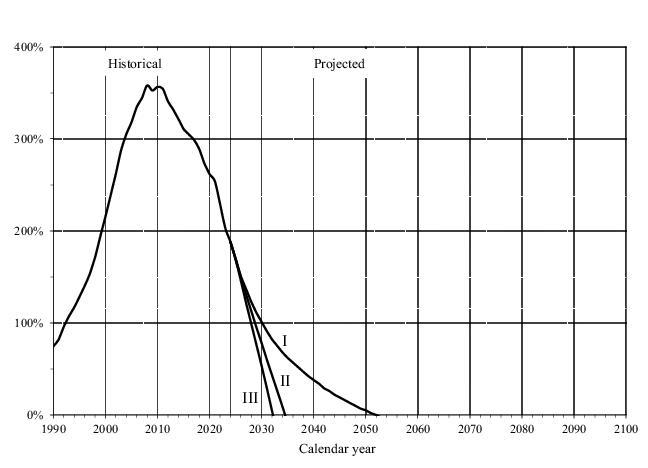
Uncertainty of the Projections
Significant uncertainty surrounds the intermediate assumptions. The Trustees use several methods to help illustrate that uncertainty.
First approach: Alternative scenarios
A first approach uses alternative scenarios reflecting three sets of assumptions.
Intermediate assumptions (Alternative II): The intermediate alternative represents the Trustees’ best estimates of future experience.
Low-cost assumptions (Alternative I): The low-cost alternative includes a higher ultimate total fertility rate, slower improvement in mortality, higher real wage growth, a higher ultimate real interest rate, a higher ultimate annual change in the CPI, a lower unemployment rate, and a lower ultimate disability incidence rate.
High-cost assumptions (Alternative III): The high-cost alternative includes a lower ultimate total fertility rate, more rapid improvement in mortality, lower real wage growth, a lower ultimate real interest rate, a lower ultimate annual change in the CPI, a higher unemployment rate, and a higher ultimate disability incidence rate.
These alternatives are not intended to suggest that all parameters would be likely to differ from the intermediate values in the specified directions. Instead, they are intended to illustrate the effect of clearly defined scenarios that are, on balance, very favorable or very unfavorable for the program’s actuarial status. Actual future cost is unlikely to be as extreme as portrayed by the low-cost or high-cost projections. The method used to construct these projections is not designed to estimate the probability that actual experience will lie within or outside the range.
Figure II.D6 shows the projected trust fund ratios for the combined OASI and DI Trust Funds under the intermediate, low-cost, and high-cost assumptions. The figure indicates that the combined trust funds are projected to become depleted in 2034 under the intermediate alternative, in 2051 under the low-cost alternative, and in 2032 under the high-cost alternative.
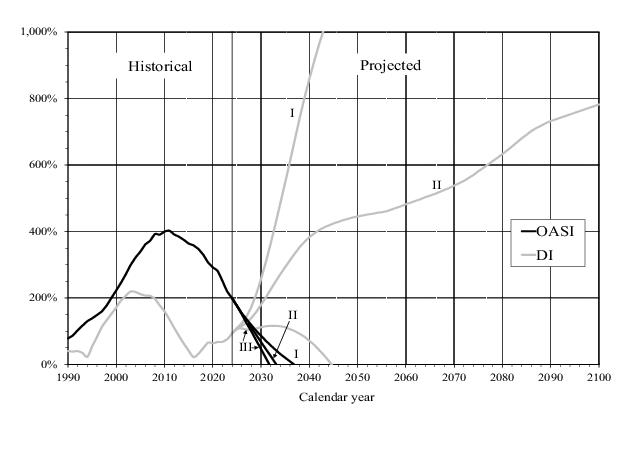
Figure II.D7 shows the projected trust fund ratios separately for OASI and DI Trust Funds under the intermediate, low-cost, and high-cost assumptions. OASI reserves are projected to become depleted in 2033 under the intermediate alternative, in 2036 under the low-cost alternative, and in 2031 under the high-cost alternative. The DI reserves are projected to become depleted in 2044 under the high-cost alternative. They are not projected to become depleted under the low-cost and intermediate alternatives. This figure illustrates that OASI reserves are expected to become depleted much sooner than DI reserves, potentially within the next 10 years.
Figure II.D7.—Long-Range OASI and DI Trust Fund Ratios
[Reserves as a percentage of annual cost]
Second approach: Long-range sensitivity analysis
Appendix D of this report presents a second approach using long-range sensitivity analysis for the OASDI program. By varying one parameter at a time, sensitivity analysis provides a way to illustrate the uncertainty surrounding projections into the future.
Third approach: Stochastic simulation
A third approach uses 5,000 independently generated stochastic simulations that reflect randomly assigned annual values and central tendencies for most of the key parameters. These simulations produce a distribution of projected outcomes and corresponding probabilities that future experience will fall within or outside a given range.
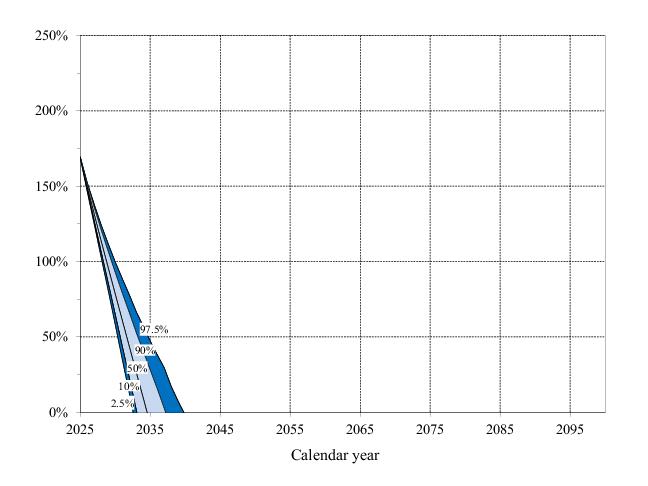
The results of the stochastic simulations, discussed in more detail in appendix E, suggest that trust fund reserve depletion before mid-century is very likely. In particular, figure II.D8 indicates that for 95 percent of these simulations, the reserve depletion year falls within the range from 2032 to 2039. In last year’s report, this range was from 2032 to 2043.
The stochastic results suggest that trust fund ratios as high as the low-cost alternative or as low as the high-cost alternative are very unlikely.
Changes From Last Year’s Report
The projected long-range OASDI actuarial deficit increased from 3.50 percent of taxable payroll for last year’s report to 3.82 percent of taxable payroll for this year’s report. The change in the valuation date and the extension of the 75-year projection period for an additional year, 2099, would have by itself increased the actuarial deficit to 3.56 percent.
Changes in law, methods, starting values, and assumptions combined to increase the actuarial deficit by an additional 0.26 percent of taxable payroll. This increase is mainly attributable to (1) the implementation of the Social Security Fairness Act, (2) the extension in the assumed year the ultimate total fertility rate is reached, and (3) the reduction in the ultimate assumption for the ratio of total labor compensation to GDP. For a detailed description of the specific changes identified in table II.D2, see section IV.B.6.
Valuation period a
-.06
-.01
-.06
-.02
-.02
-.31

a
The change in the 75-year valuation period from last year’s report to this report means that the 75-year actuarial balance now includes the relatively large negative annual balance for 2099. This change in the valuation period results in a larger long-range actuarial deficit. The actuarial deficit includes the trust fund reserve at the beginning of the projection period.

b
Between -0.005 and 0.005 percent of taxable payroll.

Note: Components may not sum to totals because of rounding.
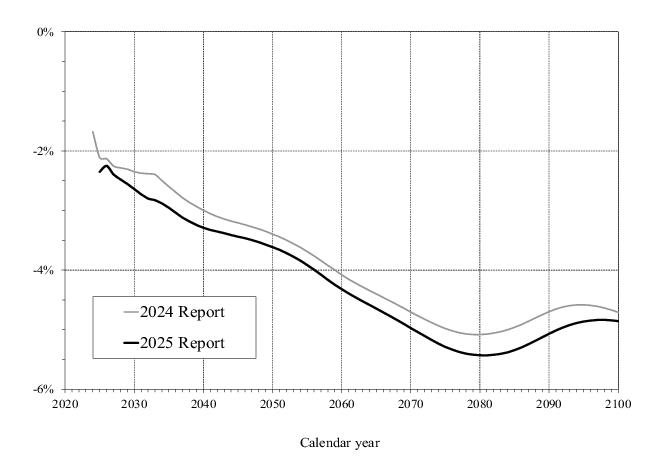
Figure II.D9 compares this year’s projections of annual balances (non-interest income minus cost) to those in last year’s report. The annual balances in this year’s report are lower (more negative) in all projection years. For the full 75-year projection period, the annual balances average 0.28 percentage point lower in this year’s report.
 

1
Appendix F also presents summary measures over the infinite horizon. The infinite horizon values provide an additional indication of Social Security’s very-long-run financial condition.

2
Sustainable solvency for the financing of the program under a specified set of assumptions has been achieved when the projected trust fund ratio is positive throughout the 75-year projection period and is either stable or rising at the end of the period.


Table of Contents Previous Next Tables Figures Index
SSA Home | Privacy Policy | Website Policies & Other Important Information | Site Map | Actuarial Publications June 18, 2025