Status of the Social Security and Medicare Programs
A SUMMARY OF THE 2026 ANNUAL REPORTS
Social Security and Medicare Boards of TrusteesThe Trustees of the Social Security and Medicare trust funds report on the current and projected financial status of the two programs each year. This document summarizes the findings of the 2026 reports. As in prior years, we found that the Social Security and Medicare programs both continue to face significant financing issues.
The non-health-specific intermediate (best estimate) assumptions for these reports were set in February 2026. The Trustees will continue to monitor developments, reevaluate the assumptions, and modify the projections in later reports.
Based on our best estimates, this year's reports show that:
• The Old-Age and Survivors Insurance (OASI) Trust Fund will be able to pay 100 percent of total scheduled benefits until the fourth quarter of 2032, one quarter earlier than projected last year. At that time, the fund’s reserves will become depleted and continuing program income will be sufficient to pay 78 percent of total scheduled benefits.
• The Disability Insurance (DI) Trust Fund is projected to be able to pay 100 percent of total scheduled benefits through at least 2100, the last year of this report’s projection period. Last year’s report projected that the DI Trust Fund would be able to pay scheduled benefits through at least 2099, the last year of that report’s projection period.
• If the OASI Trust Fund and the DI Trust Fund projections were combined, the resulting projected fund (designated OASDI) would be able to pay 100 percent of total scheduled benefits until the third quarter of 2034, unchanged from last year’s report. At that time, the projected fund’s reserves would become depleted and continuing combined fund income would be sufficient to pay 83 percent of scheduled benefits. (The two funds could not actually be combined unless there were a change in the law, but the combined projection of the two funds is frequently used to indicate the overall status of the Social Security program.)
• The Hospital Insurance (HI) Trust Fund will be able to pay 100 percent of total scheduled benefits until the second quarter of 2033, one quarter earlier than projected last year. At that point, that fund’s reserves will become depleted and continuing program income will be sufficient to pay 89 percent of total scheduled benefits.
• The Supplementary Medical Insurance (SMI) Trust Fund is adequately financed into the indefinite future because, unlike the other trust funds, its main financing sources—enrolled beneficiary premiums and the associated federal contributions from the Treasury—are automatically adjusted each year to cover costs for the upcoming year. Although the financing is assured, rapidly rising SMI expenditures have been placing steadily increasing demands on beneficiaries and general taxpayers.
The projected long-term finances of the combined OASDI fund worsened this year primarily due to three factors. First, the assumed ultimate total fertility rate was lowered from 1.90 children per woman to 1.75 children per woman. Second, estimated historical and assumed near-term and ultimate net total immigration are lower this year. These two demographic changes lowered the projected number of workers, projected taxable payroll, and projected GDP over the long range. Third, the One Big Beautiful Bill Act (OBBBA), as enacted on July 4, 2025, makes permanent the lower ordinary income tax rates and adjusted tax brackets originally passed under the 2017 Tax Cuts and Jobs Act and both increases and makes permanent the larger standard deduction of the 2017 Act. The OBBBA also adds a temporary additional standard deduction for taxpayers over age 65. As a result of these provisions, the OASI and DI Trust Funds will receive lower levels of revenue in the future from income taxation of Social Security benefits.
The projected long-term finances of the HI Trust Fund worsened this year due to higher assumed utilization of some provider services, upward revisions to assumed average Medicare Advantage per capita expenditures, and lower revenue projected to be received from income taxation of Social Security benefits due to the enactment of the OBBBA. The net effect of lower 2025 expenditures than the Trustees had anticipated last year and net changes to the demographic and economic assumptions partially offset these downward adjustments. As always, the Trustees will continue to consider the impact of the OBBBA and any other legislation on trust fund finances and adjust projections in future reports as necessary.
Lower GDP projections over the long range contribute to higher SMI expenditures as a share of GDP relative to last year’s report. The other reasons for changes in SMI trust fund projections relative to last year’s report differ between Parts B and D. For Part B, expenditures as a percentage of GDP are lower over the first ten years of the projection mainly due to the assumed impact of policy changes implemented in 2026 related to certain physician-administered drugs. However, faster projected growth for spending on other Part B drugs causes expenditures as a percentage of GDP to be slightly higher than in last year’s report by 2048. For Part D, expenditures as a share of GDP are projected to be significantly higher than in last year’s report in all years of the projection. This is mainly due to increased utilization of certain specialty drugs in 2025, combined with higher drug cost trends and lower projected pharmacy and drug manufacturer rebates over the first 10 years of the projection. After 2048, Parts B and D expenditures as a percentage of GDP grow faster than in last year’s report due to changes in demographic assumptions, most notably the lower fertility rate assumption, that result in lower GDP projections.
Lawmakers have many options for changes that would reduce or eliminate the long-term financing shortfalls. Taking action sooner rather than later will allow consideration of a broader range of solutions and provide more time to phase in changes so that the public has adequate time to prepare.
By the Trustees:
Secretary of the Treasury,
and Managing Trustee of the Trust Funds.
Robert F. Kennedy, Jr.,
Secretary of Health and Human Services,
and Trustee.
Acting Secretary of Labor,
and Trustee.
Frank J. Bisignano,
Commissioner of Social Security,
and Trustee.
INTRODUCTION
This summary of the 2026 Trustees Reports describes the outlook for both the Social Security and Medicare programs and the projected actuarial status of the trust funds that finance them. It presents results based on the Trustees’ best estimates of likely future demographic, economic, and program-specific conditions, which are referred to as the intermediate set of assumptions in the Trustees Reports.1
Trust fund depletion dates are a common way of tracking the status of the trust funds since, if annual income is not sufficient, full scheduled benefits in the law cannot be paid after trust fund reserves are depleted. Reserves are projected to become depleted in the fourth quarter of 2032 for OASI, one quarter earlier than in last year’s report, and in the second quarter of 2033 for HI, one quarter earlier than in last year’s report. Starting at those dates, less than full scheduled benefits would be payable. The DI Trust Fund is projected to be able to pay full benefits through the end of the long-range projection period (2100).
Another measure of the status of the trust funds is called the “actuarial balance.” 2 A negative actuarial balance is called an actuarial deficit and represents a shortfall in financing; a positive actuarial balance represents a surplus of financing. OASI and HI have actuarial deficits over the next 75-year period; the DI Trust Fund has a positive actuarial balance.
Table 1 lists the 2026 Trustees Reports’ key findings for each of the separate trust funds established under the law.
| Social Security | Medicare | |||
|---|---|---|---|---|
| Old-Age and Survivors Insurance (OASI) | Disability Insurance (DI) | Hospital Insurance (HI) | Supplementary Medical Insurance (SMI) | |
| Types of benefits paid from the trust fund | Retirement and survivor benefits | Disability benefits | Inpatient hospital and post-acute care (Part A) | Physician and outpatient care (Part B), and prescription drugs (Part D) |
| Full scheduled benefits are expected to be payable until | 2032 (Q4) | At least through 2100 | 2033 (Q2) | Indefinitely |
| Percentage of scheduled benefits payable at time of reserve depletion | a78 | — | b89 | — |
| 75-year actuarial balance, as a percent of taxable payroll | -4.55 | .13 | -.56 | — |
a The percent of scheduled benefits payable is projected to decline to 62 percent by 2100.
b The percent of scheduled benefits payable is projected to decline to 85 percent by 2050 and to gradually increase to 93 percent by 2100.
It is often useful to consider the findings for the two Social Security trust funds (OASI and DI) on a combined basis. The actuarial deficit for Social Security as a whole—called OASDI—is 4.42 percent of taxable payroll. If these two legally separate trust funds were combined, then the OASDI reserves would be projected to become depleted in the third quarter of 2034 and 83 percent of scheduled Social Security benefits would be payable at that time, declining to 65 percent by 2100.
BACKGROUND
What are the Trust Funds? There are four trust funds into which Social Security and Medicare program income is transferred and from which costs—benefits and administrative expenses—are paid. When program income exceeds current costs, the trust funds accumulate reserves, which are used to pay benefits in periods when program income alone is not sufficient. Each trust fund pays only the types of benefits it is permitted to pay under law.
These trust funds were established by Congress and are managed by the Secretary of the Treasury.
The four trust funds are:
• Old-Age and Survivors Insurance (OASI) Trust Fund
• Disability Insurance (DI) Trust Fund
• Hospital Insurance (HI) Trust Fund
• Supplementary Medical Insurance (SMI) Trust Fund
The OASI and DI Trust Funds are distinct legal entities and operate independently. The two funds are sometimes considered on a combined basis, referred to as OASDI, to illustrate the status of the Social Security program as a whole. The two Medicare funds, HI and SMI, are also distinct. The SMI Fund has two accounts, Part B, for outpatient services and supplies, and Part D, for retail prescription drug coverage.
The Trustees must invest all excess funds in interest-bearing securities backed by the full faith and credit of the United States. The Department of the Treasury currently invests the funds in special non-marketable U.S. Government securities, which earn interest equal to average rates on marketable securities with durations defined in law.
The balances in the trust funds represent the accumulated value, including interest, of all prior annual surpluses and deficits.
How are the Social Security and Medicare programs financed? Under current law, each program is financed differently.
OASI and DI Financing
OASI and DI are financed almost exclusively by payroll taxes, income tax on Social Security benefits, and interest on invested trust fund reserves.
OASI and DI receive most of their income from payroll taxes. Payroll tax contributions consist of taxes paid by employees, employers, and self-employed workers. Self-employed workers pay the equivalent of the combined employer and employee tax rates.
| OASI | DI | Total OASDI | |
|---|---|---|---|
| Employees and employers, each | 5.30 | 0.90 | 6.20 |
| Self-employed workers | 10.60 | 1.80 | 12.40 |
Federal law establishes the types of work and earnings subject to the payroll taxes, as well as the tax rates, which apply to earnings up to an annual maximum ($184,500 in 2026). The maximum usually increases each year as the national average wage increases.
Who Pays Income Tax on Their Social Security Benefits?
Social Security beneficiaries with incomes above $25,000 for individuals (or $32,000 for married couples filing jointly) include up to 50 percent of their benefits in taxable income, with those whose incomes are above $34,000 (or $44,000 for married couples filing jointly) including up to 85 percent of their benefits. Revenues from the first 50 percent of included benefits go to the OASI and DI Trust Funds, and revenues from included benefits in excess of 50 percent go to the HI Trust Fund. The income thresholds are not indexed for inflation.
HI Financing
Medicare HI receives financing from payroll taxes, income tax on Social Security benefits, premiums, and interest on trust fund reserves.
HI receives most of its income from payroll taxes. Federal law establishes the payroll tax rates for HI.
| HI | |
|---|---|
| Employees and employers, each | 1.45 |
| Self-employed workers | 2.90 |
Unlike OASI and DI, there is no annual maximum on earnings subject to the HI payroll tax. There is an additional employee-paid 0.9 percent HI tax on earnings over $200,000 for individual tax return filers and over $250,000 for joint tax return filers.
HI also receives income from monthly premiums paid by or on behalf of individuals who are voluntarily enrolled in Medicare Part A.
SMI Financing
Medicare SMI receives financing from Federal Government contributions, premiums paid by or on behalf of enrollees, payments from States, and interest on reserves.
The government contributions and the enrollee premiums3 are set prospectively based on projected Part B and Part D costs for the year, with premiums normally set to cover about one quarter of the costs. The government contributions cover most of the rest and are the largest source of income. Premium amounts and the government contributions both rise as the costs of Part B and Part D programs rise.
In 2026, the Part B standard monthly premium is $202.90. Individual tax return filers whose modified adjusted gross income exceeds $109,000 and joint return filers who exceed $218,000 must pay the standard premium plus an income-related adjustment amount. In 2026, that additional amount ranges from $81.20 to $487.00 per month.
In 2026, the Part D base beneficiary premium is $38.99 per month. However, actual premium amounts charged to Part D beneficiaries depend on the specific plan they have selected. The actual amount for the basic benefit is projected to average around $27 each month in 2026. If Part D enrollees have modified adjusted gross income that exceeds the same threshold amounts listed just above for Part B, they must pay an income-related adjustment amount. That additional amount ranges from $14.50 to $91.00 per month in 2026.
Part D also receives payments from States that reflect the estimated amounts they would have paid for prescription drug costs for individuals eligible for both Medicare and Medicaid if Medicaid was still the primary payer.
Who Are the Trustees? The Social Security Act established the Social Security and Medicare Boards of Trustees to oversee the financial operations of the Social Security and Medicare trust funds. The Social Security Act also requires that the Boards report annually to the Congress on the financial and actuarial status of the trust funds.
By law, there are six Trustees. Four of them serve by virtue of their positions in the Federal Government:
• the Secretary of the Treasury, who is the Managing Trustee,
• the Secretary of Labor,
• the Secretary of Health and Human Services, and
• the Commissioner of Social Security.
The President also appoints two other Trustees as public representatives, and their appointments are subject to confirmation by the Senate. The Public Trustee positions have been vacant since July 2015.
PROGRAM OPERATIONS IN 2025
How many people received benefits from the programs? At the end of 2025, 62.3 million people received OASI benefits, and 8.2 million received DI benefits. Additionally, and 69.3 million people were enrolled in Medicare.
How large are the reserves in the trust funds right now? At the end of 2025, OASI reserves were $2,338.3 billion, DI reserves were $223.0 billion, HI reserves were $255.7 billion, and SMI reserves were $168.4 billion. The OASI and SMI Trust Fund reserves declined in 2025; DI and HI Trust Fund reserves increased.
| OASI | DI | HI | SMI | |
|---|---|---|---|---|
| Reserves (end of 2024) | $2,538.3 | $183.2 | $237.5 | $170.4 |
| + Income during 2025 | 1,248.8 | 200.5 | 462.4 | 763.8 |
| - Cost during 2025 | 1,448.8 | 160.7 | 444.2 | 765.8 |
| Net change in reserves | -200.0 | 39.8 | 18.2 | -2.0 |
| Reserves (end of 2025) | 2,338.3 | 223.0 | 255.7 | 168.4 |
Note: Totals do not necessarily equal the sums of rounded components.
How did program income compare to costs in 2025? In 2025, the OASI Trust Fund’s cost of $1,448.8 billion exceeded income by $200.0 billion. In contrast, the DI Trust Fund’s income of $200.5 billion exceeded cost by $39.8 billion. Combining the experience of the two separate funds, Social Security’s cost exceeded income by $160.2 billion.
The HI Trust Fund’s income of $462.4 billion exceeded cost by $18.2 billion, but the SMI Trust Fund’s income of $763.8 billion fell short of cost by $2.0 billion.
What were the sources of program income in 2025? Program income received from each source is as follows:
| Source | OASI | DI | HI | SMI |
|---|---|---|---|---|
| Payroll taxes | $1,130.7 | $191.9 | $403.2 | — |
| Taxes on OASDI benefits | 56.4 | 1.4 | 41.1 | — |
| Interest earnings | 61.7 | 7.2 | 9.1 | $3.9 |
| Government contributions | — | — | 1.1 | 571.8 |
| Beneficiary premiums | — | — | 6.0 | 165.6 |
| Payments from States | — | — | — | 19.1 |
| Other | a | a | 1.9 | 3.5 |
| Total | 1,248.8 | 200.5 | 462.4 | 763.8 |
a Between -$50 million and $50 million.
Additional details and the percentage of total program income received by source are described below:
• Income from payroll taxes—An estimated 184.7 million people paid Social Security payroll taxes in 2025, and 188.7 million people paid Medicare payroll taxes. Income from payroll taxes accounted for approximately 91 percent of OASI income, 96 percent of DI income, and 87 percent of HI total income.
• Income from income tax on Social Security benefits—Income tax on Social Security benefits accounted for 5 percent of OASI income, less than 1 percent of DI income, and 9 percent of HI income.
• Income from interest on reserves—Interest earnings accounted for 5 percent of OASI income, 4 percent of DI income, 2 percent of HI income, and less than 1 percent of SMI income.
• Federal Government contributions—Government contributions accounted for 75 percent of total SMI income, financed 75 percent of SMI Part B and Part D program costs, and were less than 1 percent of HI income.
• Income from Medicare premiums—Premiums paid by enrolled beneficiaries accounted for approximately 22 percent of SMI total income and 1 percent of HI total income.
• Income from payment from States—State payments covered about 11 percent of Part D costs, accounting for approximately 2 percent of total SMI income.
What program costs were paid during 2025? The 2025 program costs for each of the trust funds were:
| Category | OASI | DI | HI | SMI |
|---|---|---|---|---|
| Benefit payments | $1,438.5 | $158.0 | $438.3 | $759.4 |
| Railroad Retirement financial interchangea | 6.0 | b | — | — |
| Administrative expensesc | 4.3 | 2.6 | 5.9 | 6.4 |
| Total | 1,448.8 | 160.7 | 444.2 | 765.8 |
a Funds are shifted between the Railroad Retirement program and the Social Security trust funds on an annual basis so that each trust fund is in the same financial position it would have been had railroad employment always been covered under Social Security. Corresponding transfers to the HI Fund are included in Table 5 under "Other."
b Between -$50 million and $50 million.
c Administrative expenses include expenses incurred by the Social Security Administration, the Department of Health and Human Services, and the Department of the Treasury in administering the programs and the provisions of the Internal Revenue Code relating to the collection of contributions.
Benefit payments accounted for 99 percent of OASI program costs, 98 percent of DI program costs, 99 percent of HI costs, and 99 percent of SMI costs.
Administrative expenses made up 0.3 percent of OASI program costs, 1.6 percent of DI program costs, 1.3 percent of HI program costs, and 0.8 percent of SMI program costs.
PROJECTED TRUST FUND OPERATIONS
Each year, the Trustees project the future cost and income for each of the trust funds for the next 75 years. This section provides the short-range (10-year) and long-range (75-year) financial projections for the OASI, DI, and HI Trust Funds. The SMI Trust Fund is not discussed in this context because Federal law sets premium increases and government contributions so that annual income matches annual costs.
Since 2021, the OASI Trust Fund has been drawing down reserves to finance benefits and will require increasing amounts of redemptions of trust fund securities during the next decade. The OASI Trust Fund has a projected reserve depletion date of the fourth quarter of 2032, one quarter earlier than in last year’s report.
The DI Trust Fund is projected to remain solvent throughout the long-range period, as in last year’s report. The reserves at the beginning of 2026 are 132 percent of projected 2026 costs. The ratio of reserves to costs rises throughout the projection period to 857 percent for 2100.
The Trustees project that the combined OASI and DI Trust Fund reserves will continue to decrease in 2026 because total cost ($1,697 billion) is expected to exceed total income ($1,493 billion). For OASDI, the Trustees project that total cost will exceed total income in all future years, as it has starting in 2021.
The Trustees project an increase in HI Trust Fund reserves in 2026, as total income ($487 billion) is expected to exceed total cost ($480 billion). Annual HI deficits are projected to return in 2027, requiring redemption of securities in the trust fund reserves until the trust fund's depletion in 2033. Total cost will exceed non-interest income through the rest of the long-range period.
The key dates for the OASI, DI, and HI Trust Funds are:4
| OASI | DI | OASDI | HI | |
|---|---|---|---|---|
| First year cost exceeds income excluding interesta | 2010 | b | 2010 | 2026 |
| First year cost exceeds total income including interesta | 2021 | b | 2021 | 2027 |
| Year reserves are depleted | 2032 (Q4) | c | d2034 (Q3) | 2033 (Q2) |
a Dates indicate the first year a condition is projected to occur and then persist each year through 2100.
b Projected annual balances remain positive through 2100.
c The trust fund reserves are projected to remain positive during the 75-year period ending in 2100.
d If the OASI and DI trust funds were combined, the quarter the combined reserves would become depleted.
What are the annual income and cost rates for the trust funds? Because the primary source of income for OASDI and HI is the payroll tax, it is useful, when assessing the financial outlook, to express the programs’ incomes and costs as percentages of taxable payroll.5 Chart A illustrates the size of income and cost relative to earnings subject to the payroll tax for each of these programs. In this illustration, interest income is not included in OASDI and HI income.
Chart A—OASDI and HI Income and Cost as Percentages of Their Respective Taxable Payrolls
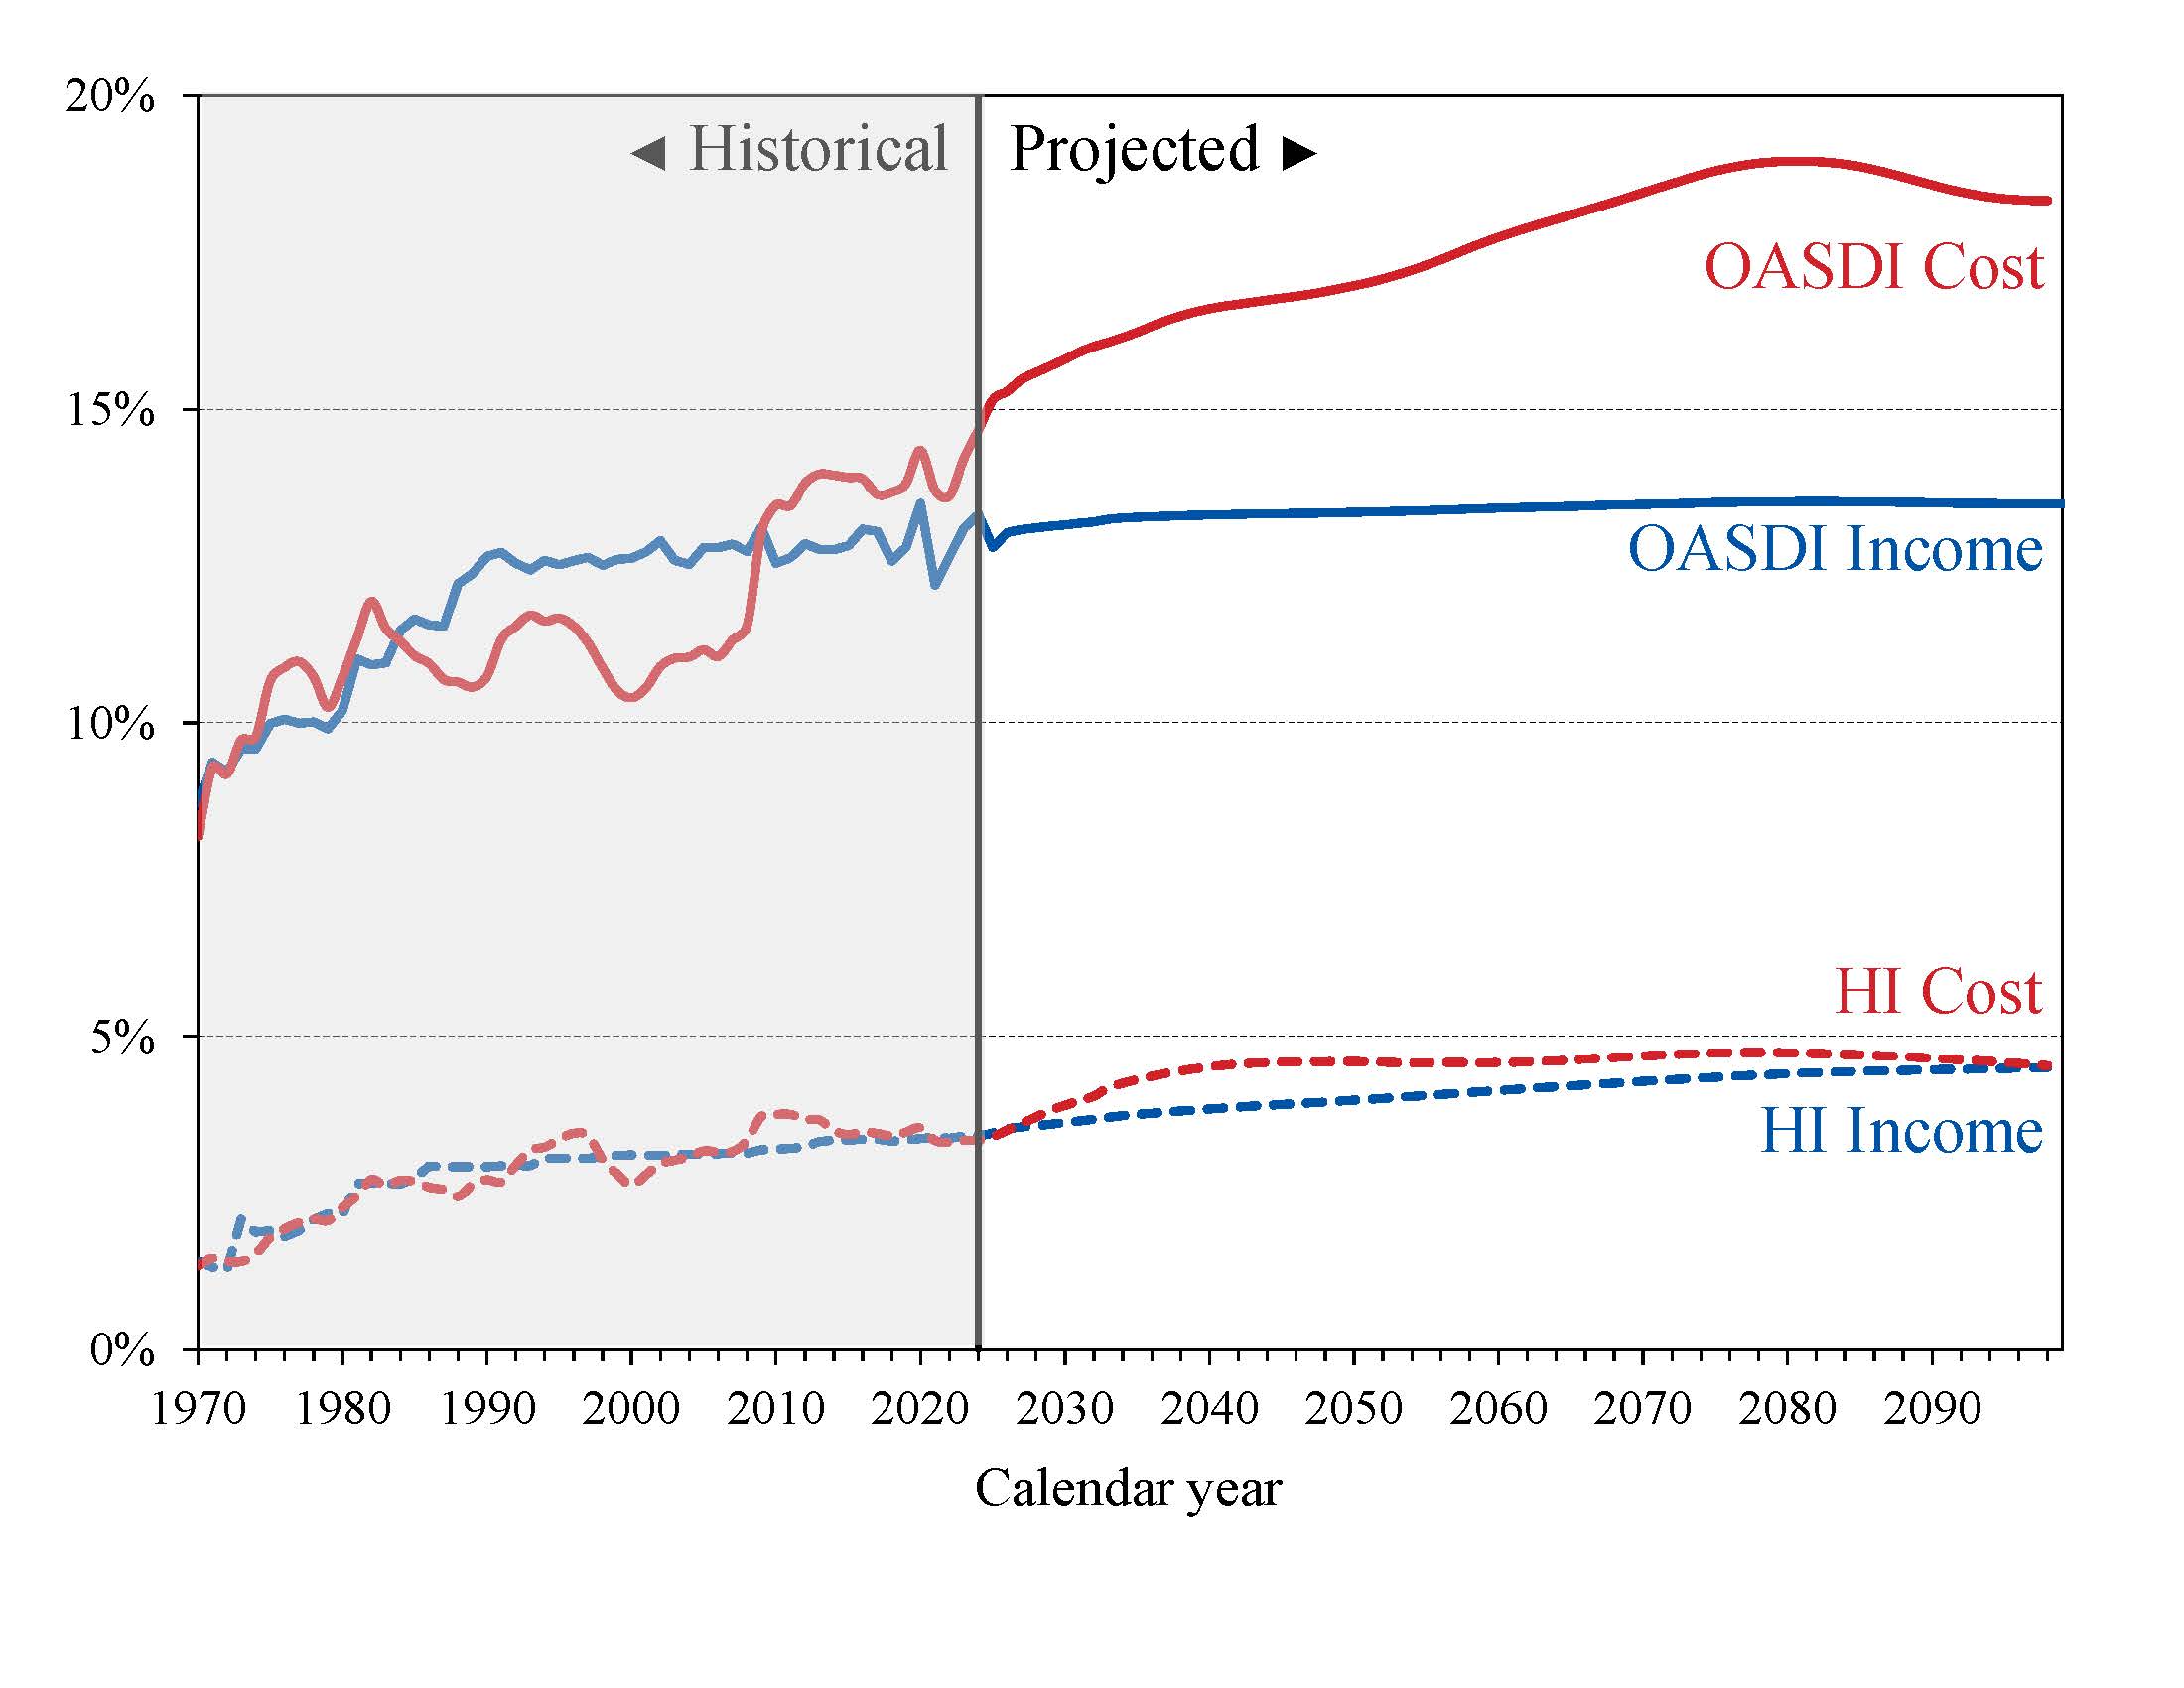
The percentages shown in Chart A are comparable within each program, but not across programs. This is because the two programs have different taxable payrolls. The OASDI payroll tax is imposed on earnings creditable for Social Security purposes up to an annual taxable maximum amount ($184,500 in 2026) that ordinarily increases each year with the growth in the nationwide average wage. There is no taxable maximum amount applied for the HI payroll tax. In addition, larger numbers of Federal, State, and local government employees are covered under the HI program. Therefore, HI taxable payroll is about 25 percent larger than OASDI payroll on average over the long-range period.
Much of the overall rise in cost rates for both OASDI and HI is attributable to the decline in fertility rates and the resulting aging of the population, which, under the projection assumptions, stabilizes after 2080.
OASDI
The projected OASDI annual cost rate rises from 15.37 percent of taxable payroll in 2026 to 20.45 percent of taxable payroll by 2085 and then decreases to 20.02 percent in 2100.
The projected OASDI annual income rate rises gradually from 12.91 percent of taxable payroll at the beginning of the projection period to 13.45 percent of taxable payroll at the end.
HI
The projected HI annual cost rate rises from 3.49 percent of taxable payroll in 2026 to 4.99 percent of taxable payroll by 2085, then decreases to 4.86 percent of taxable payroll in 2100. The rapid increase early in the projection period, to 4.47 percent of taxable payroll by 2040, is attributable in part to rising per beneficiary spending.
The projected HI income rate rises gradually from 3.49 percent in 2026 to 4.51 percent in 2100. The increase in the HI income rate is primarily due to the higher payroll tax rates for high earners that began in 2013. An increasing fraction of all earnings will be subject to the higher tax rate over time because the thresholds are not adjusted for inflation. By 2100, an estimated 80 percent of workers would pay the higher rate.
Do the trust funds have a positive annual balance or an annual deficit? The difference between the annual income rate and annual cost rate of the trust funds is known as the annual balance. This is calculated for each year in the projection period. A negative annual balance (when annual costs exceed income) is called an annual deficit. Because the income rate does not include interest, there may be an annual deficit even when the trust fund has a surplus.
OASDI
The annual deficit in 2025 for the OASDI trust funds was 2.17 percent of taxable payroll. Projected annual deficits for the OASDI program gradually increase from 2.45 percent of taxable payroll in 2026 to 6.98 percent in 2085, and then decline to 6.57 percent of taxable payroll in 2100.
HI
Annual deficits are expected for the HI Fund from 2027 through the rest of the projection period.
The HI cost rate increases more rapidly than the income rate through 2042. The projected annual deficits expressed as a share of taxable payroll increase from 0.14 percent in 2027 to a high of 0.71 percent in 2042 and then gradually decrease to 0.35 percent by the end of the projection period. The narrowing of the difference between cost rates and income rates reflects the continuing effects of slower payment rate updates, assumed decelerating growth in the volume and intensity of services, and the increasing portion of earnings that are subjected to the additional 0.9-percent payroll tax. The percentage of expenditures covered by non-interest income is projected to be 89 percent in 2033 (the year of depletion) and 85 percent in 2050 (the 25th projection year) but will rise to about 93 percent by the end of the projection period.
What are the costs and income in relation to GDP? To better understand the size of these projected costs, one can compare them to gross domestic product (GDP), the most frequently used measure of the total output of the U.S. economy. This comparison tells us how much of the nation’s total economic output is needed to finance these programs.
Chart B—Social Security and Medicare Costs as a Percentage of GDP
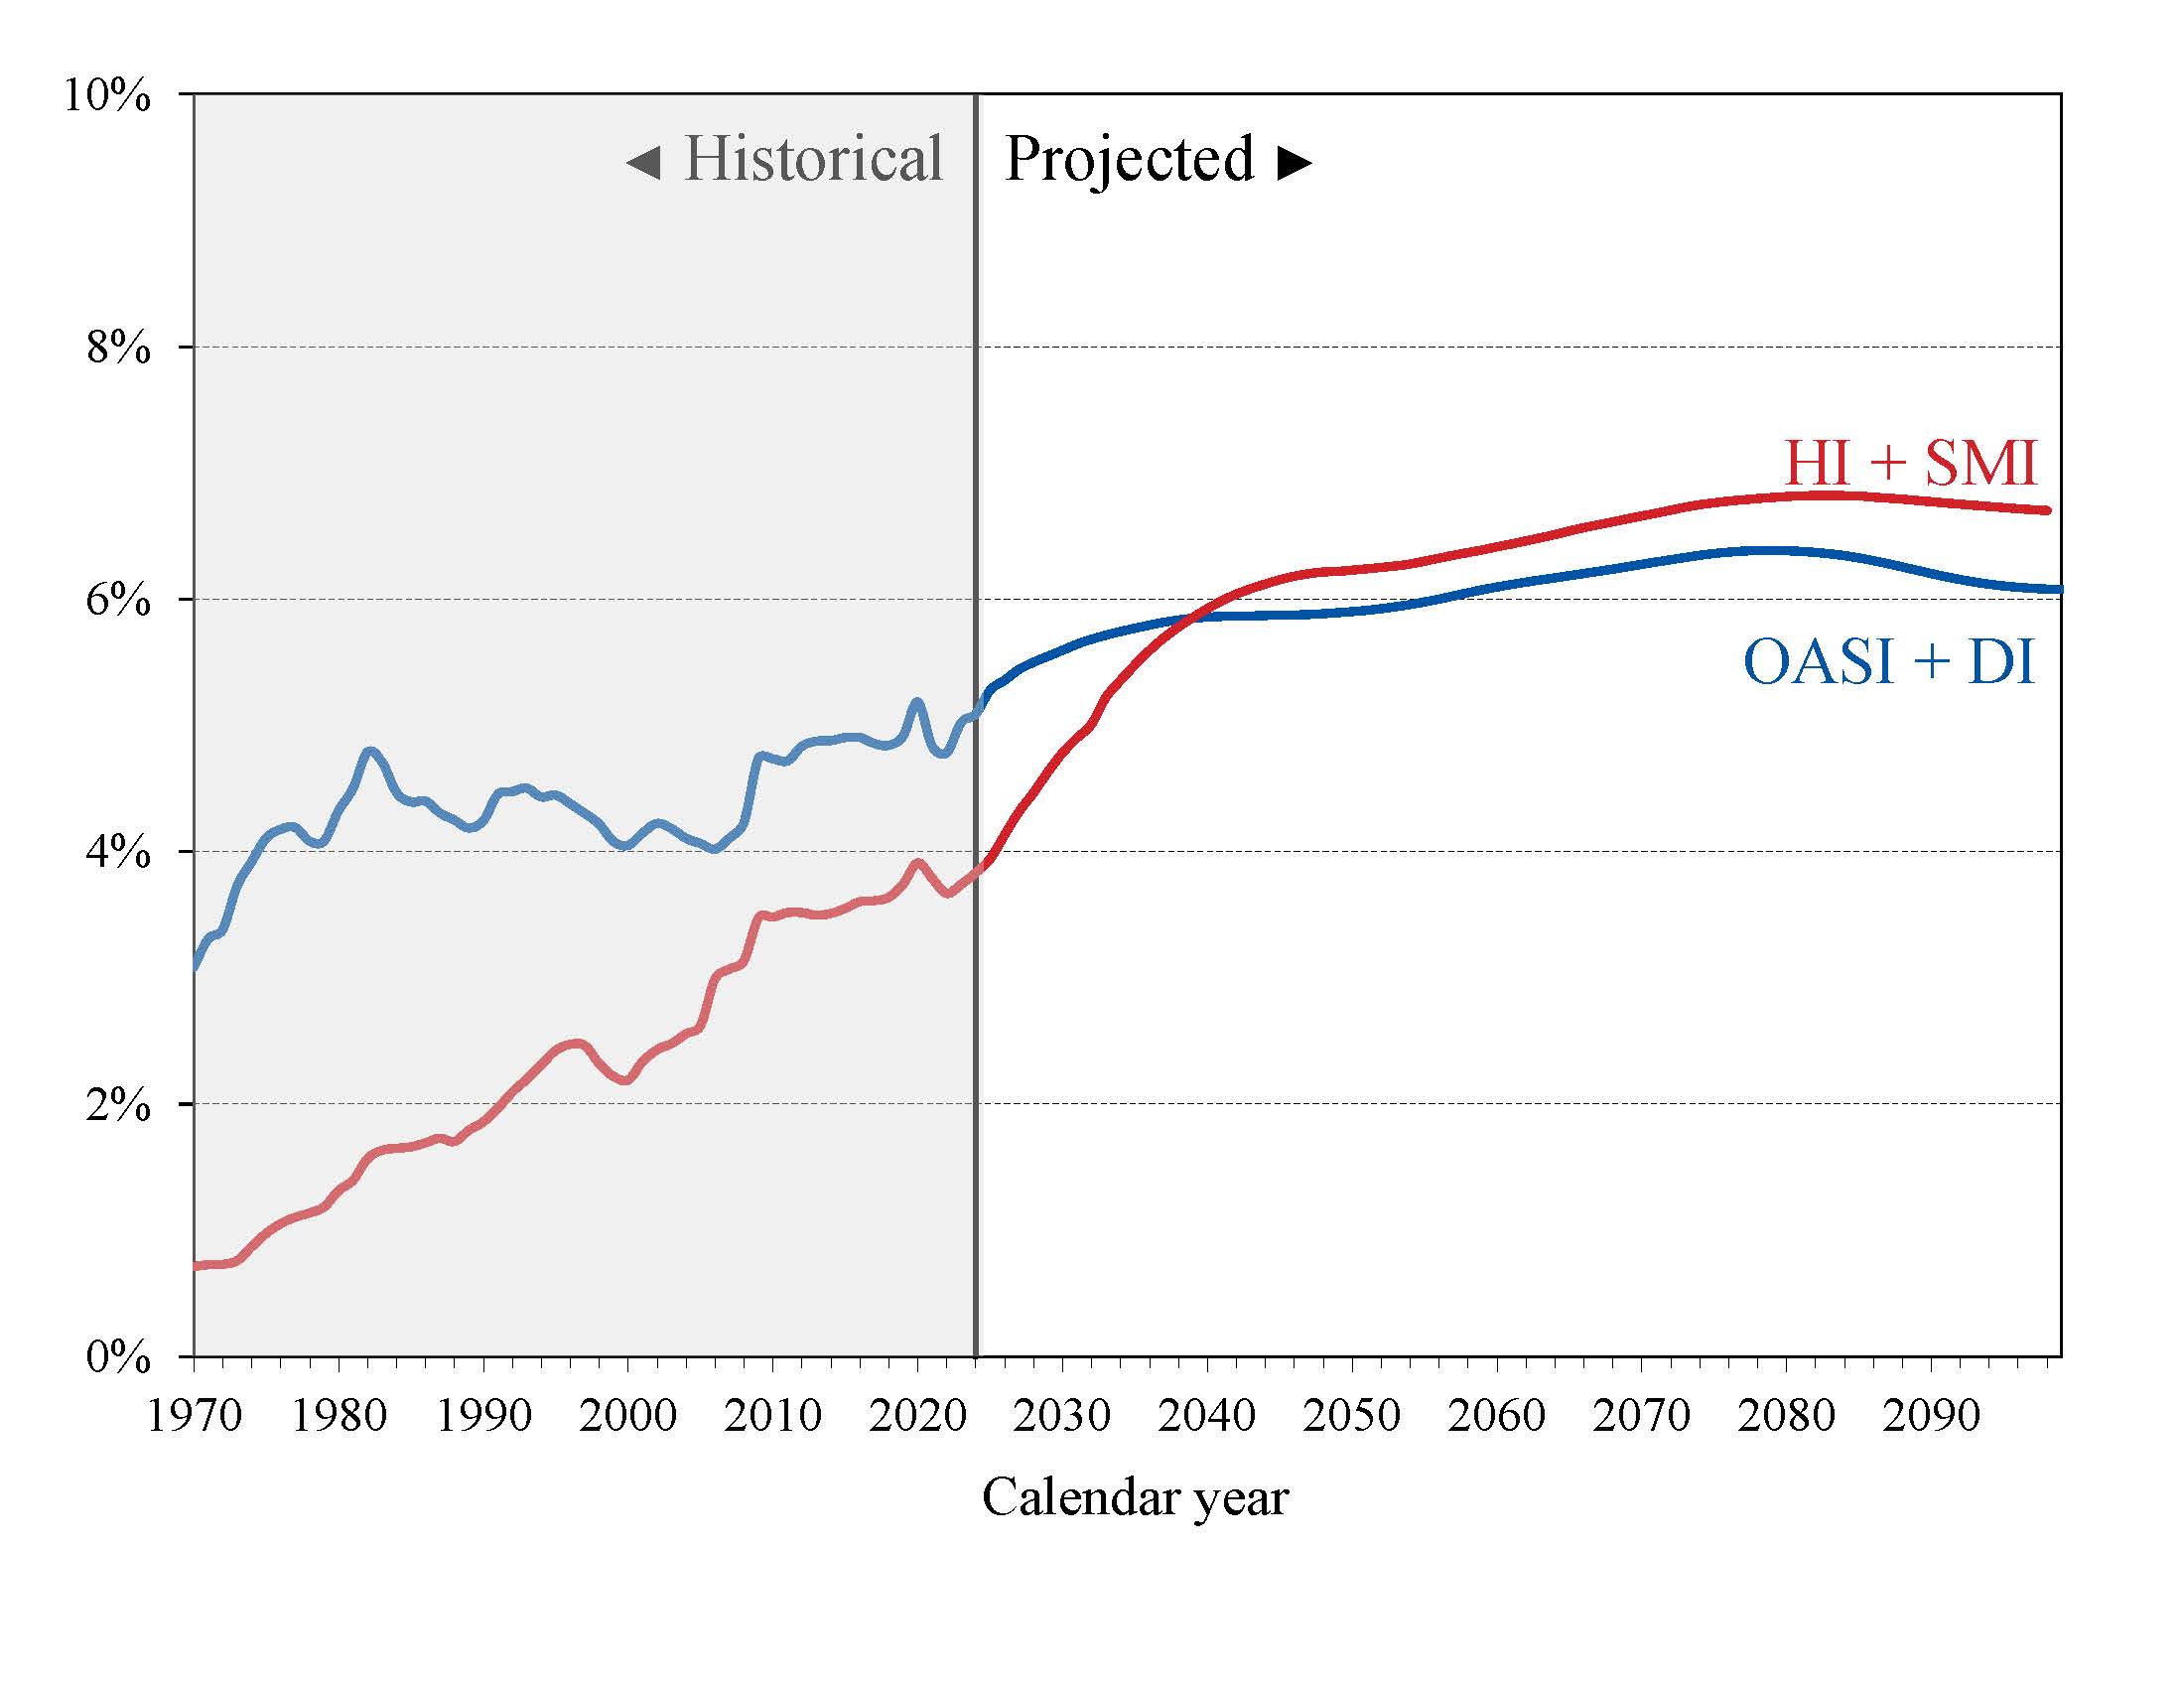
In 2026, Medicare’s annual cost is about 79 percent of Social Security’s annual cost. By 2036, Medicare's cost is expected to exceed that of Social Security, and will continue to do so through 2100.
Costs for both programs relative to GDP grow as the baby boomers reach retirement ages and as GDP growth slows in the future due to assumed lower birth rates and lower levels of immigration.
Social Security (OASI and DI)
Social Security’s annual cost increases from 5.3 percent of GDP in 2026 to a peak of about 6.9 percent in 2084 and then declines to 6.7 percent for 2100. The annual deficit not including interest rises from 0.8 percent of GDP in 2026 to 2.4 percent in 2085, then declines to 2.2 percent in 2100.
Medicare (HI and SMI)
HI projected cost rises from 1.5 percent of GDP in 2026 to 2.0 percent by 2036 and then increases slightly to 2.1 percent in 2080 before falling back to 2.0 percent by the end of the projection period. The annual deficit is projected to rise from 0.06 percent of GDP in 2027 to 0.32 percent in 2042 before gradually declining to 0.15 percent in 2100.
SMI spending is expected to rise from 2.6 percent of GDP in 2026 to 4.5 percent by 2050, and further to 5.5 percent by 2100.
Together, Medicare costs are expected to rise from 4.1 percent of GDP in 2026 to 6.5 percent in 2050. Costs then rise more slowly to about 7.6 percent in 2089 before declining slightly to 7.5 percent in 2100.
Social Security and Medicare, combined
The combined cost of the Social Security and Medicare programs is projected to rise from 9.4 percent of GDP in 2026 to 12.5 percent of GDP in 2050 and to 14.2 percent in 2100, with most of the increase attributable to Medicare. By 2099 the combined cost will have declined slightly to 12.8 percent of GDP.
The projected costs for the OASI, DI, and HI programs as shown in the charts and described in this summary assume that the full benefits set out in law will continue to be paid. Under current law, however, these programs are not allowed to pay any benefits beyond what is available from annual income and trust fund reserves, and they cannot borrow. Therefore, after the trust fund reserves become depleted, and in the absence of additional legislation, the cost of benefits that would be paid is lower than shown in this summary.
How will cost growth change the sources of Medicare financing? The Federal Government contribution and the beneficiary premiums, which account for much of the income of the SMI fund, finance a growing share of overall Medicare costs.
Chart C shows scheduled cost and non-interest revenue sources under current law for HI and SMI combined as a percentage of GDP. The total cost line is the same as displayed in Chart B, rising from 3.9 percent in 2025 to 7.5 percent in 2100.
Chart C—Medicare Cost and Non-Interest Income by Source as a Percentage of GDP
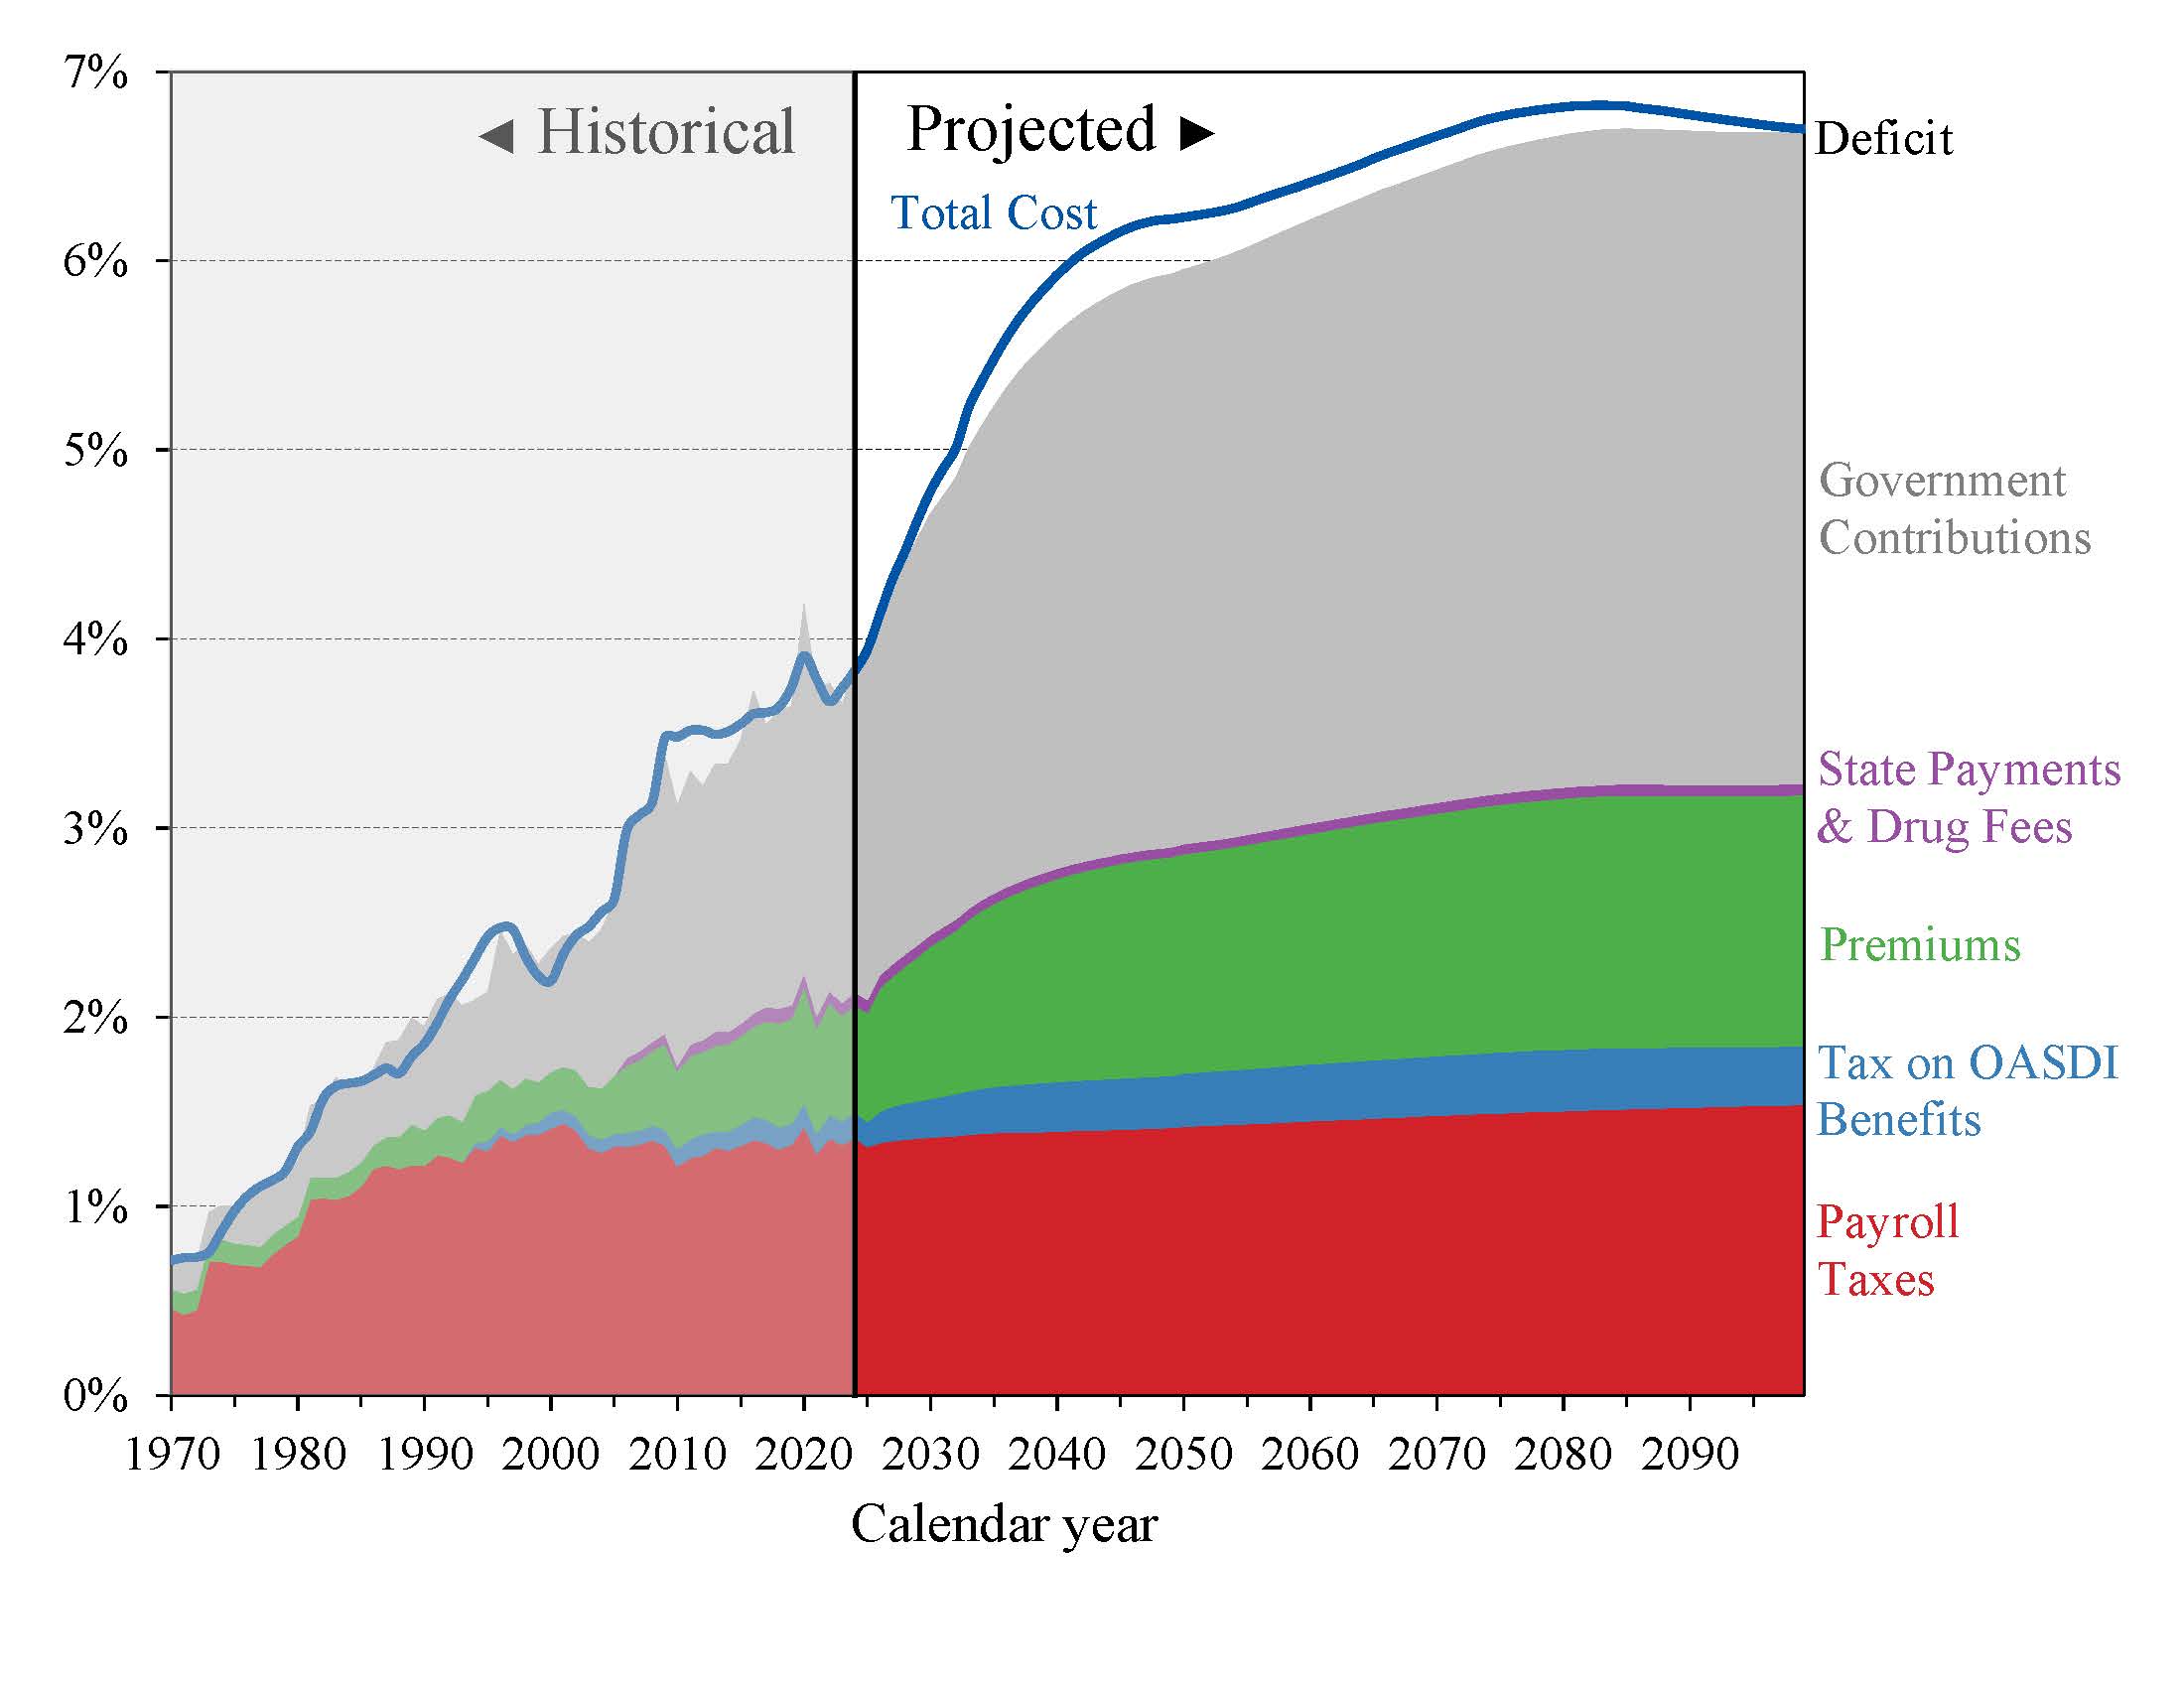
Projected revenue from payroll taxes and income taxes on OASDI benefits financing the HI Trust Fund increases from 1.4 percent of GDP in 2026 to 1.9 percent in 2100 under current law.
During the same period, projected Government contributions to the SMI Trust Fund increase more rapidly from 2.1 percent of GDP in 2026 to 3.9 percent in 2100. Beneficiary premiums increase from 0.6 percent of GDP to 1.5 percent. Therefore, the share of total non-interest Medicare income from taxes declines from 34 percent to 25 percent, while the Government contributions share rises from 49 percent to 53 percent and the share of premiums rises from 15 percent to 21 percent.
Medicare’s distribution of financing changes in large part because the Trustees project that costs for Part B and Part D increase at a faster rate than for Part A.
The Medicare Funding Warning
The law requires the Trustees to include in each year's report a determination of "excess general revenue funding" if the proportion of annual Medicare costs funded by certain statutorily defined financing sources, primarily Federal Government contributions to SMI, is expected to exceed 45 percent in any of the next 7 fiscal years. For this report the Trustees have projected that the funding is expected to reach that level in fiscal year 2026. This is the tenth consecutive report that includes such a determination.
Two consecutive such determinations are to be treated under the law as a “Medicare funding warning,” under which the President is to submit to Congress in the year following the report proposed legislation to respond to the warning. The law then requires Congress to consider the legislation on an expedited basis. This is the ninth consecutive year in which two successive determinations have resulted in a funding warning.
PROJECTED TRUST FUND ADEQUACY
The 2026 reports project that the OASI and HI Trust Funds’ reserves are insufficient to pay full scheduled benefits throughout the 75-year projection period. The DI Trust Fund is projected to have sufficient income to pay full scheduled benefits throughout the long-range period. The SMI Trust Fund is adequately financed into the indefinite future because current law provides financing from Federal Government contributions and beneficiary premiums each year to meet the next year’s expected costs.
Chart D shows the trust fund ratios for the OASI, DI, and HI Trust Funds throughout the 75-year projection period. The “trust fund ratio” is the value of trust fund reserves at the start of a year expressed as a percentage of the projected costs for the ensuing year.
A trust fund ratio of 100 percent or more, or a ratio that is expected to reach 100 percent within 5 years and remain at or above 100 percent through the short-range period, indicates that the fund’s reserves are adequate in the short-range. That level of projected reserves for any year suggests that even if cost exceeds income, the trust fund reserves combined with annual tax revenues would be sufficient to pay full benefits for several years.
Chart D—OASI, DI and HI Trust Fund Ratios
[Reserves as a percentage of annual cost]
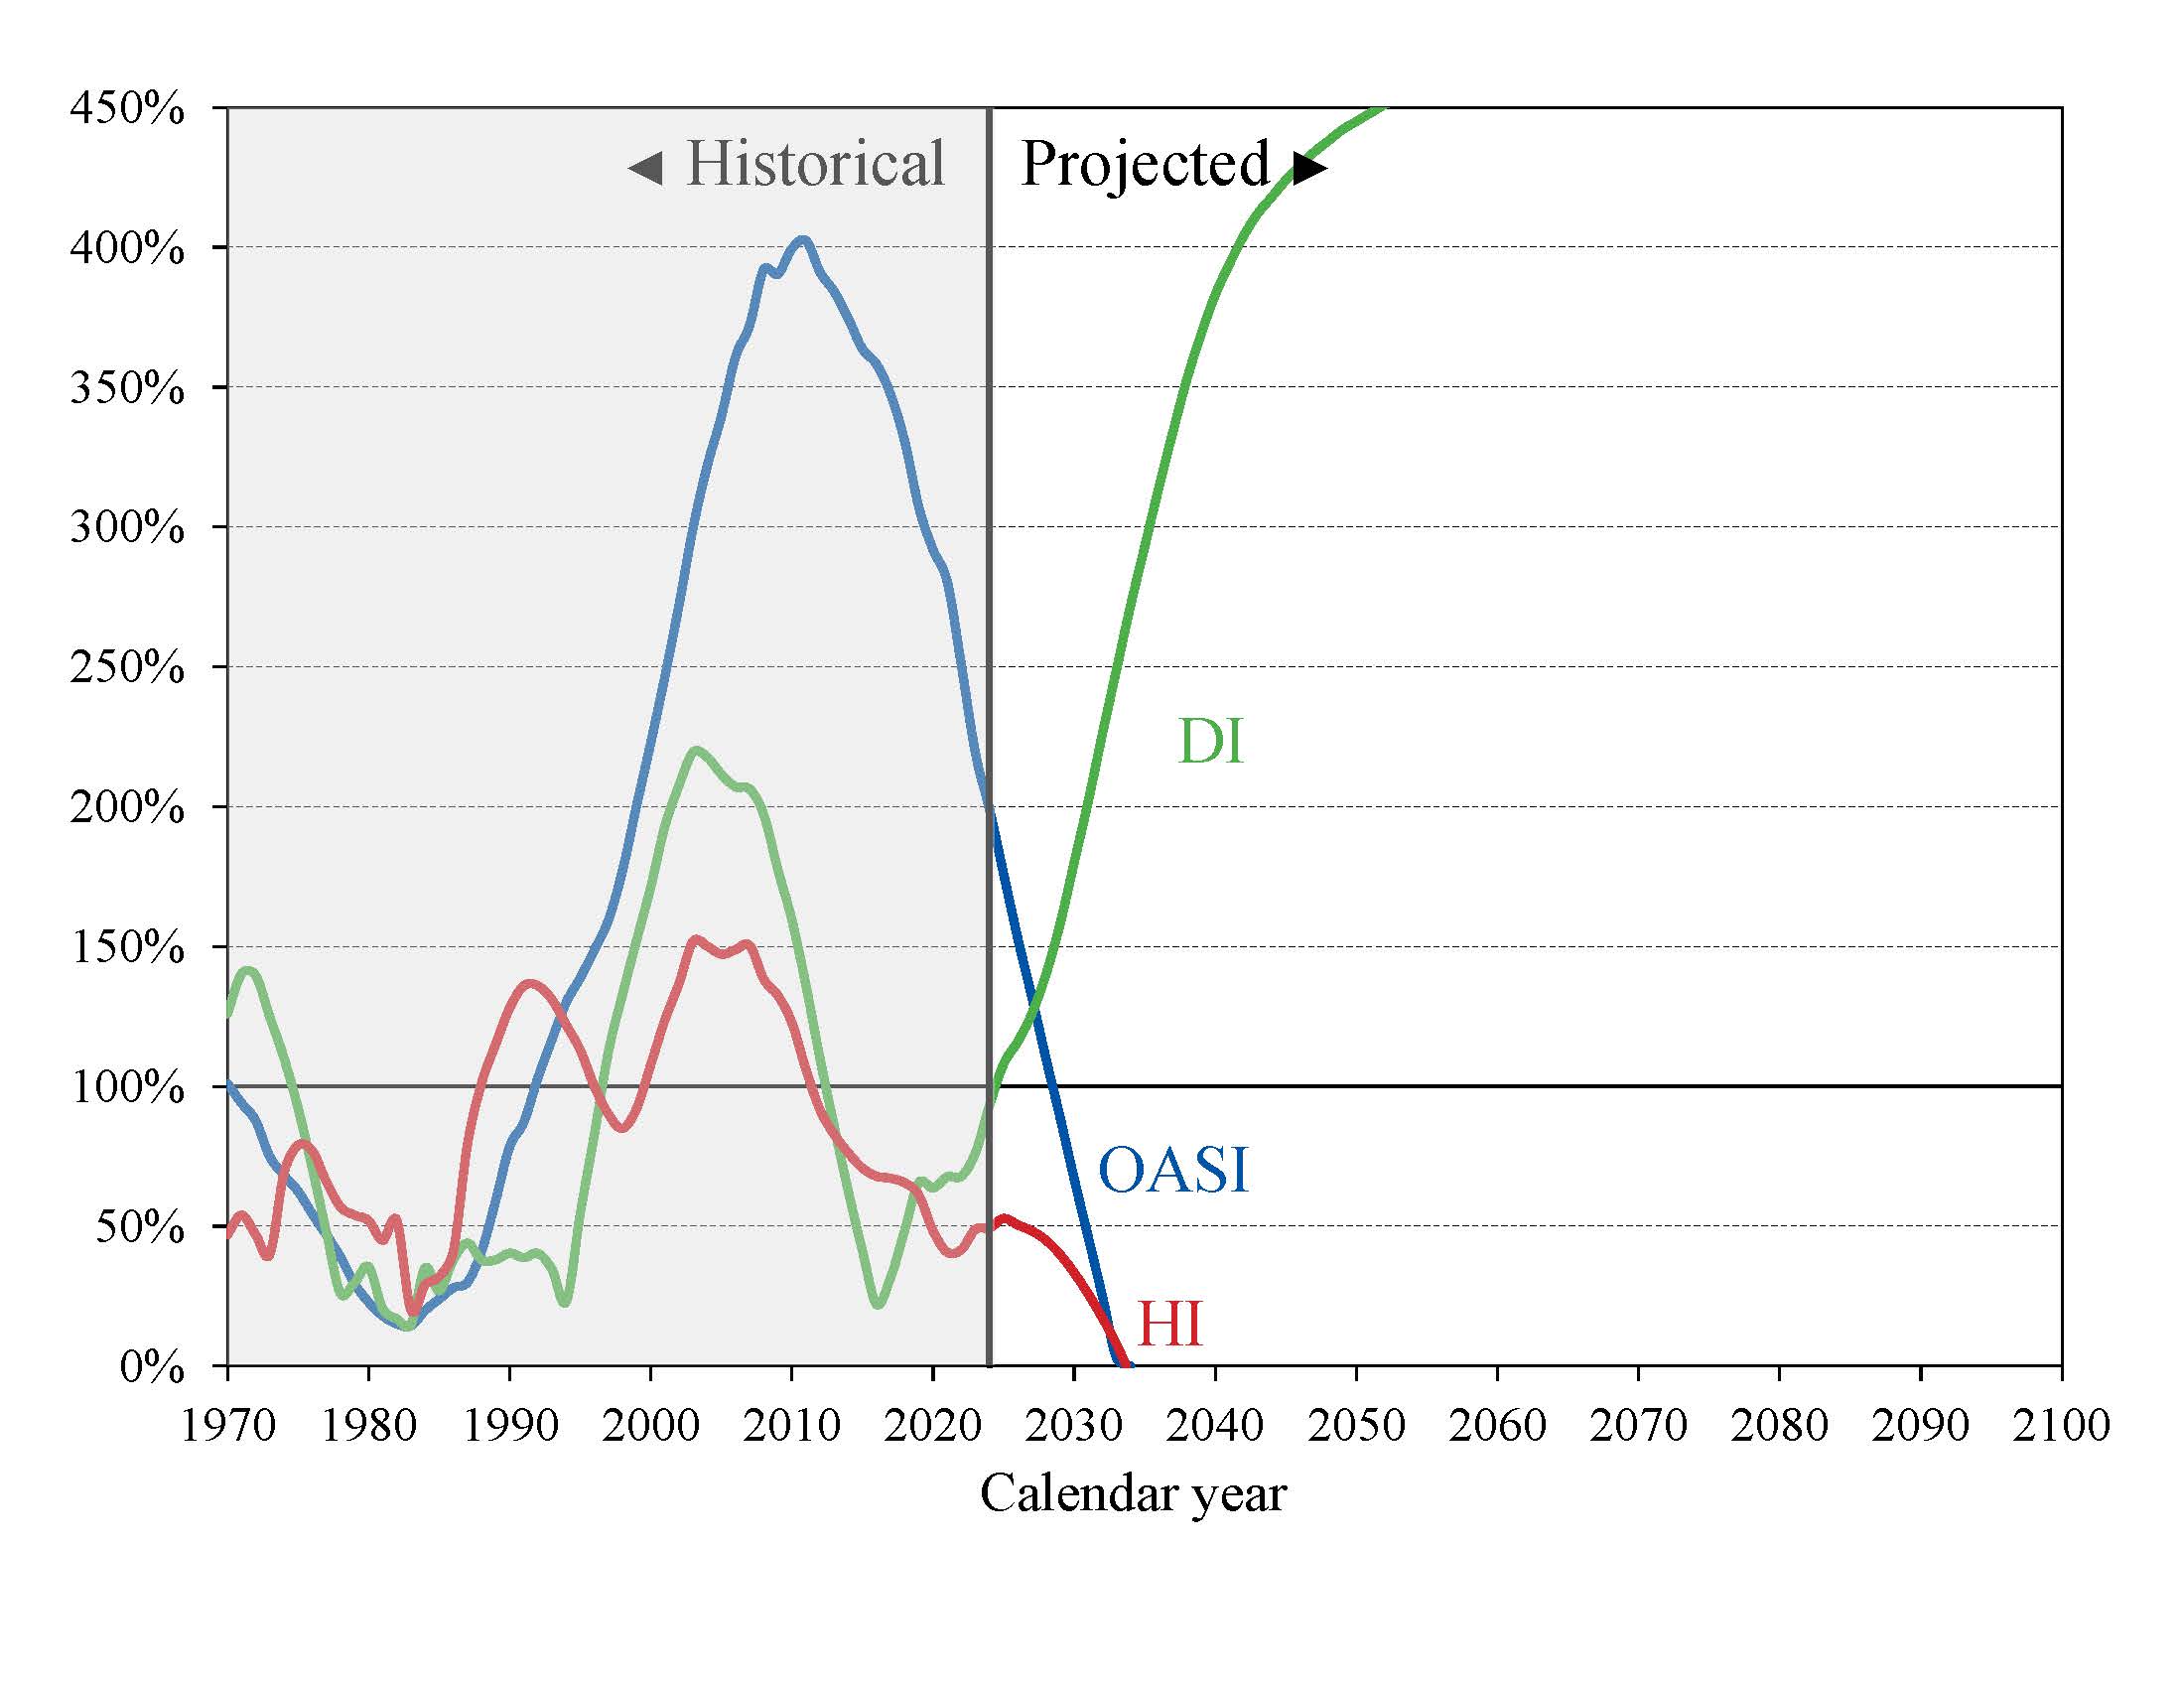
The financial outlook for the OASI and HI Trust Funds depends on a number of demographic, economic, and program-specific assumptions. Nevertheless, the actuarial deficit in both OASI and HI is large enough that averting trust fund depletion under current-law financing is extremely unlikely.
Table 8 summarizes the projected years of reserve depletion for the OASI, DI, and HI Trust Funds, as well as the expected percent of scheduled benefits that could be paid from program income at the time of reserve depletion and at the end of the 75-year projection period.
| OASI | DI | OASDI | HI | |
|---|---|---|---|---|
| Year reserves are depleted | 2032 (Q4) | a | b2034 (Q3) | 2033 (Q2) |
| Percent of scheduled benefits able to be paid: | ||||
| At the time of reserve depletion | 78 | a | 83 | 89 |
| For 2100 | 62 | a100 | 65 | c93 |
a The trust fund reserves are projected to remain positive during the 75-year period ending in 2100. The trust fund ratio is projected to be 857 percent in 2100.
b If the OASI and DI trust funds were combined, the quarter the combined reserves would become depleted.
c The percent of scheduled benefits payable is projected to decline to 85 percent by 2050 before gradually rising to 93 percent by 2100.
What is the outlook for short-range trust fund adequacy? For the 75-year projection period, the short-range accounts for the first 10 years, which is 2026 through 2035 for this report. The short-range adequacy of the OASI, DI, and HI Trust Funds is measured using the trust fund ratio.
• The OASI Trust Fund is not adequately financed throughout the short-range period and has not been since 2019. Its trust fund ratio, 153 percent at the beginning of 2026, is projected to fall below 100 percent by the beginning of 2029.
• The DI Trust Fund is projected to be adequately financed throughout the short-range period. Its trust fund ratio, 132 percent at the beginning of 2026, is projected to continue increasing for the remainder of the short-range period.
• The HI Trust Fund is not adequately financed throughout the short-range period and has not been since 2003. Its trust fund ratio is 53 percent at the beginning of 2026 and is not projected to attain 100 percent within the following 5 years.
The Trustees apply a less stringent "contingency reserve" test to SMI reserves, applying the test to Part B and Part D separately. The financing for each part is considered adequate if it is sufficient to fund all services provided, including benefits and administrative expenses, through a given period (generally, through the end of the current calendar year).
To account for the possibility that cost increases under either part of SMI will be higher than expected, the SMI accounts need reserves that are adequate to cover a reasonable degree of variation between actual and projected costs. The Trustees consider the adequacy for SMI Part B and Part D separately.
The outlook of the two parts over the short-range period is as follows:
• For SMI Part B, the Trustees estimate that the financing established through December 2026 will be sufficient to cover benefits and administrative costs incurred through the current calendar year and that reserves will be adequate to cover potential variations in costs as a result of new legislation or cost growth factors that exceed expectations.
• For SMI Part D, the Trustees estimate the financing established for Part D, together with the flexible appropriation authority, will be sufficient to cover benefits and administrative costs incurred through 2026. The Centers for Medicare & Medicaid Services calculate Part D premiums paid by enrollees based on the plan bids such that Part D revenues annually cover estimated costs. This flexible appropriation authority established by lawmakers for Part D allows additional financing through Government contributions if costs are higher than anticipated.
What is the outlook for long-range trust fund adequacy? The long-range period is a 75-year valuation period, which is 2026-2100 for the 2026 reports.
The long-range adequacy of the OASI, DI, and HI Trust Funds is measured using the actuarial balance.6 The actuarial balance captures how expected income for the 75-year projection period compares to the expected costs for the same period, as a percentage of taxable payroll.
A negative actuarial balance (a deficit) indicates that estimated income is insufficient to meet estimated trust fund obligations for all or part of the 75-year period. A positive actuarial balance indicates that estimated income is more than sufficient to meet estimated obligations over the period as a whole, although not necessarily year by year.
A projected actuarial deficit represents the average amount of change in income or cost that is needed over the 75-year period in order to achieve an actuarial balance of zero. An actuarial balance of zero indicates that costs can be met for the 75-year period with existing reserves and expected income, leaving reserves at the end of the period equal to the following year’s cost.
The long-range actuarial balances for the OASI, DI, and HI Trust Funds are:
| OASI | DI | OASDI | HI | |
|---|---|---|---|---|
| Actuarial balance | -4.55 | 0.13 | -4.42 | -0.56 |
• The OASI Trust Fund has a projected long-range actuarial deficit equal to 4.55 percent of taxable payroll, compared to 3.95 percent in the 2025 report.
• The DI Trust Fund has a projected long-range actuarial surplus equal to 0.13 percent of taxable payroll, compared to 0.12 percent in the 2025 report. The DI Trust Fund is in actuarial balance for the 75-year period.
• The combined OASDI trust funds now have a projected long-range actuarial deficit equal to 4.42 percent of taxable payroll, compared to 3.82 percent in the 2025 report.
• Medicare’s HI Trust Fund now has a long-range actuarial deficit equal to 0.56 percent of taxable payroll, compared to 0.42 in the 2025 report.
An actuarial balance of zero for the OASI and HI Trust Funds could be achieved with a uniform increase in the payroll tax rate (or a uniform percentage reduction in benefits) for all years starting in 2026. Such a change would leave the trust funds declining toward depletion at the end of the 75-year period. Larger changes in taxes or benefits would be required to achieve positive and non-declining trust fund reserves at the end of the period.
CHANGES REFLECTED IN THE 2026 REPORTS
How does this outlook for Social Security compare to last year's? This year’s report indicates that the reserves in the OASI Trust Fund are expected to be depleted in the fourth quarter of 2032, one quarter earlier than expected last year.
| 2026 Report | 2025 Report | Change | |
|---|---|---|---|
| OASI | 2032 (Q4) | 2033 (Q1) | One quarter earlier |
| DI | a | a | N/A |
a The trust fund reserves are not projected to become depleted during the 75-year period.
The DI Trust Fund is again projected to be able to pay full benefits through the end of the 75-year projection period. If these two legally separate trust funds were combined, then OASDI trust fund reserves would be projected to be depleted in the third quarter of 2034, the same quarter as in the 2025 report.
The actuarial balance for the combined OASDI trust funds worsened in the 2026 report by 0.60 percentage points.
| OASI | DI | OASDI | |
|---|---|---|---|
| Shown in the 2025 report: | |||
| Actuarial balance | -3.95 | 0.12 | -3.82 |
| Changes in actuarial balance due to changes in: | |||
| Legislation / Regulation | -.15 | a | -.16 |
| Valuation period | -.06 | -.01 | -.07 |
| Demographic data and assumptions | -.43 | -.02 | -.44 |
| Economic data and assumptions | .10 | a | .10 |
| Disability data and assumptions | a | .02 | .02 |
| Methods and programmatic data | -.06 | .01 | -.05 |
| Total change in actuarial balance | -.61 | a | -.60 |
| Shown in the 2026 report: | |||
| Actuarial balance | -4.55 | .13 | -4.42 |
a Between -0.005 and 0.005 of taxable payroll.
Note: Totals do not necessarily equal the sums of components due to rounding. A negative actuarial balance is a deficit.
The change in the actuarial balance reflects the combined effects of changes in data and assumptions, changes in methods, and advancing the valuation period by one year.
The following changes had the largest effects on the actuarial deficit:
• The large increase in the actuarial deficit attributed to changes in the demographic projections is mainly due to two changes: a lower assumed ultimate fertility rate and lower projected levels of net immigration. These changes were somewhat offset by higher estimated death rates over the projection period following an update of post-pandemic mortality trends.
• The One Big Beautiful Bill Act reduced income tax rates and increased income tax deductions. As a result, projected trust fund revenues from income taxes on benefits are reduced from what had been projected last year.
• Updates to economic data and an assumed improvement in near-term labor productivity growth and annual real earnings growth on net improved the balance.
• The 75-year valuation period advanced from 2025-2099 to 2026-2100, which adds a high-deficit year (2100) into the calculation. Future annual balances are now discounted to January 1, 2026 rather than January 1, 2025.
Compared to the 2025 report, the 2026 report shows increasingly large deficits for OASDI after about 2050. For the full 75-year projection period, the average annual deficit as a percentage of taxable payroll is about 0.72 percentage points higher in this year’s report.
How does this outlook for Medicare compare to last year's? Reserves in the HI Trust Fund are expected to be depleted one quarter earlier in 2033 than was projected in last year’s report.
| 2026 Report | 2025 Report | Change | |
|---|---|---|---|
| HI | 2033 (Q2) | 2033 (Q3) | 1 quarter earlier |
The Trustees project that Medicare expenditures will increase in future years at a faster pace than either aggregate workers’ earnings or the economy overall. The actuarial status for the HI Trust Fund has worsened in the 2026 report, with a 0.14 percentage points increase in the actuarial deficit.
| HI | |
|---|---|
| Shown in the 2025 report: | |
| Actuarial balance | -0.42 |
| Changes in actuarial balance due to changes in: | |
| Valuation period | .00 |
| Base estimate | .06 |
| Private health plan assumptions | -.08 |
| Provider assumptions | -.09 |
| Other economic and demographic assumptions | .05 |
| Legislative changes | -.09 |
| Total change in actuarial balance | -.14 |
| Shown in the 2026 report: | |
| Actuarial balance | -.56 |
Note: Totals do not necessarily equal the sums of components due to rounding. A negative actuarial balance is a deficit.
Several factors contributed to the increase in the actuarial deficit. The following changes had the largest effects over the 75-year period:
• 2025 HI expenditures were lower than had been estimated, improving the projected balance.
• Private health plan expenditures were higher than had been estimated. This and other factors lead to higher projected private health plan expenditures, worsening the balance.
• Several changes in fee-for-service provider assumptions on net worsened the projected balance.
• The One Big Beautiful Bill Act reduced income tax rates and increased income tax deductions. As a result, projected trust fund revenues from income taxes on benefits are reduced from what had been projected last year.
• Changes in fertility and immigration assumptions that worsened the balance were more than offset by other changes in economic and demographic assumptions.
Projected SMI Part B costs as a share of GDP are slightly lower before 2048 than projected last year because of the assumed impact of policy changes that reduced skin substitute payments. In the longer term, projected costs as a share of GDP rise above those projected last year because of changes in demographic assumptions that have reduced the level of projected GDP.
Projected SMI Part D costs as a share of GDP will increase from 0.7 percent of GDP in 2026 to 1.0 percent by 2100, substantially higher than in last year’s report because of a large increase in 2025 in the utilization of expensive specialty drugs, higher cost trends after 2025, and changes in the demographic assumptions that have reduced the level of projected GDP.
CONCLUSION
The 2026 Trustees Reports indicate a need for substantial changes to address Social Security’s and Medicare’s financial challenges. The Trustees recommend that lawmakers address the projected trust fund shortfalls in a timely way in order to phase in necessary changes gradually and give workers and beneficiaries time to adjust their expectations and behavior. Implementing changes sooner rather than later would allow more generations to share in the needed revenue increases or reductions in scheduled benefits. With informed discussion, creative thinking, and timely legislative action, Social Security and Medicare can continue to protect future generations.
2 The actuarial balance for the 75-year valuation period is the difference between the summarized income rate and the summarized cost rate as percentages of taxable payroll. When that balance is negative, or is an “actuarial deficit,” projected income over the valuation period plus any trust fund reserves at the start of the period are insufficient to pay all program costs over the period and leave an adequate “contingency reserve” at the end of the period. For the 2026 reports, the valuation period is the 75-year period from 2026 to 2100.
3 The premium for certain low-income beneficiaries is paid on their behalf by Medicaid for Part B and by Medicare for Part D; the SMI Trust Fund is partly reimbursed for the latter by the States.
4 HI results in this table of the Summary are on a cash rather than an incurred expenditures basis.
5 A program’s cost rate is the ratio of cost to the program for the year to the taxable payroll for that year. The income rate is the ratio of non-interest income during the year to the taxable payroll for the year.
6 The actuarial balance is not relevant for the SMI Trust Fund, because Federal law sets premium increases and Government contributions at the levels necessary to bring the SMI Trust Fund into annual balance.
GLOSSARY
Actuarial balance. The difference between the summarized income rate and the summarized cost rate as a percentage of taxable payroll over a given valuation period.
Actuarial deficit. A negative actuarial balance.
Assumptions. Values related to future trends in key factors that affect the trust funds and are selected by the Trustees for purposes of projecting the future status of the trust funds. Demographic assumptions include fertility, mortality, net immigration, marriage, and divorce. Economic assumptions include unemployment rates, average earnings, inflation, interest rates, and productivity. Program-specific assumptions include retirement patterns, disability incidence rates, and disability termination rates.
Contingency reserve. Funds included in the SMI Part B Trust Fund account to serve as a cushion in case actual expenditures are higher than those projected at the time financing was established. Because the financing is set prospectively, actual experience may be different from the estimates used in setting the financing.
Cost rate. The ratio of cost during the year to the taxable payroll for the year.
Depletion. The point at which reserves in a trust fund are insufficient to pay scheduled benefits in full and on time.
General Fund of the Treasury. Funds held by the Treasury of the United States, other than income collected for a specific purpose (such as Social Security), and maintained in a separate account for that purpose.
Income rate. The ratio of non-interest income during the year to the taxable payroll for the year.
Labor productivity. The total dollar value of all goods and services produced in the U.S. (i.e., the Gross Domestic Product or GDP) divided by hours worked by all workers.
Long-range period. The first 75 projection years. The Trustees make long-range actuarial estimates for this period because it covers approximately the maximum remaining lifetime for virtually all current Social Security participants.
Present value. The equivalent value, at the present time, of a stream of values (either income or cost, past or future). Present values are widely used in calculations involving financial transactions over long periods of time to account for the time value of money, by discounting or accumulating these transactions at the rate of interest. Present-value calculations in the Trustees Reports use the effective yield on trust fund reserves.
Short-range period. The first 10 projection years.
Summarized cost rate. The ratio, expressed as a percentage, of (1) the sum of the present value of the cost during the valuation period plus the present value of the targeted ending trust fund level to (2) the present value of the taxable payroll (or GDP) during the valuation period. The targeted trust fund level is 100 percent of annual cost.
Summarized income rate. The ratio, expressed as a percentage, of (1) the sum of the trust fund reserve at the beginning of the valuation period plus the present value of non-interest income during the valuation period to (2) the present value of the taxable payroll (or GDP) for the valuation period.
Taxable payroll. A weighted sum of taxable wages and taxable self-employment income. When multiplied by the combined employee-employer payroll tax rate, taxable payroll yields the total amount of payroll taxes incurred by employees, employers, and the self-employed for work during the period.
Trust fund ratio. A measure of trust fund adequacy equal to the proportion of a year’s cost that could be paid solely with the reserves at the beginning of the year.
Valuation period. A period of years which is considered as a unit for purposes of calculating the financial status of a trust fund.
A MESSAGE FROM THE PUBLIC TRUSTEES
Because the two Public Trustee positions are currently vacant, there is no Message from the Public Trustees for inclusion in the Summary of the 2026 Annual Reports.