SOCIAL SECURITY
DISABILITY INSURANCE PROGRAM
WORKER EXPERIENCE
ACTUARIAL STUDY NO. 114
III. EXPERIENCE OF DISABILITY INCIDENCE
Since the commencement of disability cash benefits in July 1957, dynamics of the DI program have been subject to many internal and external factors. Congressional action, public opinion, and court rulings have shaped program characteristics including: how disability is defined; the determination of entitlement; the level of benefits; the review process of current beneficiaries; and ultimate program cost. Prior to 1960, the DI program applied only to workers age 50 or older. Prior to 1965, a claimant needed to be permanently disabled to qualify for benefits. The Social Security Amendments of 1967 (Public Law 90-248) eased the insured status requirements for persons under age 31, allowing a substantial number of young beneficiaries to enter the rolls. From 1968 through 1970, disability incidence remained fairly stable; however, through the early 1970s program growth far exceeded any reasonable expectations.
The introduction of the Black Lung program (1970) and the SSI program (1974), and a severe economic recession (1974-75) led to hundreds of thousands of new disability claims. In addition, administrative policy also tended to change as the DI program became bigger and more complex. Notably, the SSI program generally requires applicants under the age of 65 to apply for benefits from all other programs including DI, which may partially or fully offset SSI benefits. As expediency in processing applications was naturally given high priority, central office review of DDS initial decisions fell to roughly 5 percent in 1972 from 100 percent prior to 1972. The increased public awareness and pressures of administering two new programs probably contributed significantly to the sharp increase in new awards from 1972 to 1976.
The Social Security Amendments of 1977 (Public Law 95-216) and the Social Security Disability Amendments of 1980 (Public Law 96-265) also had significant impact on the DI program. The 1977 amendments changed the benefit formula used to calculate benefits awarded in 1979 and later. The 1980 amendments introduced a more restrictive limit on the total monthly amount of Social Security benefits payable on a disabled worker's account; and mandated a 65 percent review rate of DDS allowances to assure uniformity of decisions. The return to high levels of review during this period led the DDSs to give increasingly careful consideration to new allowances, and increased the chances of reversing an initially favorable decision. These circumstances contributed to steadily declining awards from 1977 through 1982.
By 1984, DI program policy had undergone another reversal. Congressional and public concern over the removal of a large number of beneficiaries (particularly the mentally impaired) resulted in an administrative moratorium on the review of the disability rolls while Congress considered new DI legislation. Many beneficiaries whose benefits had been terminated were returned to the rolls through the appeals process. This initiated a period of increased court appeals and class action suits. In response, Congress passed the Social Security Disability Benefits Reform Act of 1984 (Public Law 98-460). Provisions of the Act include: revised mental impairment standards; increased emphasis on treating physician opinion; emphasis given to the combined effects of multiple impairments in the absence of a single severe impairment; required proof of medical improvement prior to termination of benefits; and standards to evaluate pain.
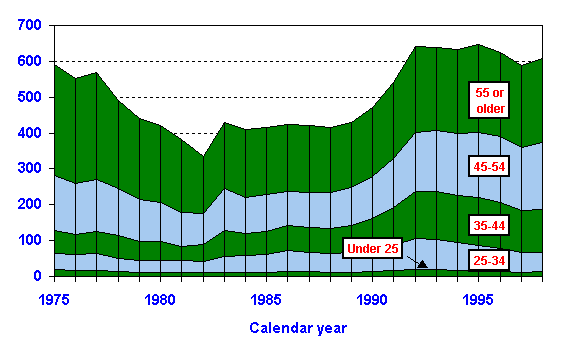
Table 3 shows the total number of DI disabled workers awarded benefits grouped by calendar age 6 at time of award, for calendar years 1975-1998. These awards are also illustrated in figure 2.
Figure 2.--DI Disabled Worker Awards by Age Group, Calendar Years 1975-1998
Table 4 shows the associated disabled worker incidence rates, which are expressed as annual awards per thousand disability insured not already receiving benefits. Adjusted figures are expressed as age-adjusted (male and female) or age-sex-adjusted (total) relative to the exposed population as of 1998. Tables 3 and 4 are tabulated as of the year the beneficiary is added to the rolls. Note, however, that the year of award may actually be different from the year of disability onset or entitlement. This is due to factors such as the waiting period, the nature of the determination process, and claims processing times in general. Consequently, the incidence rates shown are not necessarily representative of true morbidity rates for the stated calendar years.
The highest rates of incidence within the DI program occur from ages 50-65. The chance of disability entitlement increases naturally with advancing age, but also as a result of greater consideration given to vocational factors. This trend will have a significant impact on future program cost as the baby-boom generation progresses toward ages of higher incidence. Note that the rates shown in table 4 for ages 60 and older are likely to understate the true incidence rate--beginning at age 62, a disabled worker may elect to forgo disability benefits, opting instead to receive reduced old-age benefits. Many factors can influence this decision including: the disability waiting period (old-age benefits are payable immediately); the potential for worker's compensation offset; differences between disability and old-age maximum family benefits payable; and the possibility for denial of disability benefits.
Female age-specific disability incidence is usually lower, and tends to fluctuate more than males. Trends that might influence female incidence include: a varying degree of labor force participation and the effect on insured status; and greater potential for part-time work.
Many of the same factors that affect the number of claims filed and claims allowed, also affect incidence rates. In general, the decline in incidence between 1975-1982 is attributable, in part, to a stricter program. Following a very low-growth period in incidence from 1983-1989, the program experienced a surge in claims beginning in 1990, and incidence rates rose significantly through 1995. Most recently, the prevailing economic and political environment has been characterized by robust economic expansion, low unemployment, and legislative restrictions on certain impairments. In addition, advancements in medical treatment; public need for employer-sponsored healthcare protection; and pursuit of financial goals for retirement may have provided incentive to remain in the labor force, if possible. These factors have contributed to the decline in applications and awards over the last several years.
Table 5 presents historical termination data for disabled workers. Termination experience is discussed in detail in the next section.
Table 6 shows the number of disabled workers in current-payment status, at the end of calendar years 1975-1998. The current-payment population is derived from the in-force population (not shown). The number in-force at the end of the year is derived from the number of individuals on the rolls at the beginning of the year, augmented by the number of new beneficiaries awarded during the year, and reduced by the number of beneficiaries terminated during the year. The number in-force is then reduced by the number of entitled individuals whose benefits are suspended, resulting in the current-payment population. DI benefits may be suspended for a variety of reasons including: refusal of vocational rehabilitation services; engagement of substantial gainful work following completion of a trial work period; imprisonment; worker's compensation offset; or pending determination of an appeal of continuing disability. Since 1983, the current-payment population has grown at an average annual rate of roughly 4.1 percent, as growth in awards has steadily outpaced growth in terminations. The following table summarizes the progression of the DI rolls.
Growth in the DI disabled worker rolls
(Grouped by selected calendar periods 7)
|
|
|
|
|
|
||||||||||||||||
|
|
|
Annual growth |
|
Annual growth |
|
Annual growth |
|
|
Annual growth |
|||||||||||
6 Calendar age is the integral age attained on the birthday in the year in which the individual is awarded benefits.
July 30, 1999