|
Skip to content Social Security Online |
Actuarial Publications | |
|
|
Home FAQs Contact Us Search |
| Office of the Chief Actuary |
The 1997 OASDI Trustees ReportUpdated September 9, 1997 Historical document |
|
Long-range estimates are subject to much uncertainty and should not be considered precise forecasts. Instead they should be considered as indicative of the general trend and range of costs that could reasonably be expected to occur. The emphasis in this appendix on combined operations, while significant, should not obscure the analysis of the financial status of the individual trust funds, which are legally separate and cannot be commingled. In addition, the factors which determine the costs of the OASI, DI, and HI programs differ substantially.
As with the OASI and DI Trust Funds, income to the HI Trust Fund
comes primarily from contributions paid by employees, employers,
and self-employed persons. The combined OASDI and HI contribution
rate for employees and their employers is often referred to as the
FICA tax, because it is authorized by the Federal Insurance
Contributions Act. Contribution rates for the OASDI and HI programs are
shown in table III.A1.
Table III.A1. Contribution Rates for the OASDI and HI Programs[In percent] | |||||||
| Calendar years |
Employees and employers, each |
Self employed | |||||
| OASDI | HI | Combined | OASDI | HI | Combined | ||
| 1966 | 3.85 | 0.35 | 4.20 | 5.80 | 0.35 | 6.15 | |
| 1967 | 3.90 | .50 | 4.40 | 5.90 | .50 | 6.40 | |
| 1968 | 3.80 | .60 | 4.40 | 5.80 | .60 | 6.40 | |
| 1969-70 | 4.20 | .60 | 4.80 | 6.30 | .60 | 6.90 | |
| 1971-72 | 4.60 | .60 | 5.20 | 6.90 | .60 | 7.50 | |
| 1973 | 4.85 | 1.00 | 5.85 | 7.00 | 1.00 | 8.00 | |
| 1974-77 | 4.95 | .90 | 5.85 | 7.00 | .90 | 7.90 | |
| 1978 | 5.05 | 1.00 | 6.05 | 7.10 | 1.00 | 8.10 | |
| 1979-80 | 5.08 | 1.05 | 6.13 | 7.05 | 1.05 | 8.10 | |
| 1981 | 5.35 | 1.30 | 6.65 | 8.00 | 1.30 | 9.30 | |
| 1982-83 | 5.40 | 1.30 | 6.70 | 8.05 | 1.30 | 9.35 | |
| 1984 1/ | 5.70 | 1.30 | 7.00 | 11.40 | 2.60 | 14.00 | |
| 1985 | 5.70 | 1.35 | 7.05 | 11.40 | 2.70 | 14.10 | |
| 1986-87 | 5.70 | 1.45 | 7.15 | 11.40 | 2.90 | 14.30 | |
| 1988-89 | 6.06 | 1.45 | 7.51 | 12.12 | 2.90 | 15.02 | |
| 1990 and later | 6.20 | 1.45 | 7.65 | 12.40 | 2.90 | 15.30 | |
| 1 See footnote 1 under table II.B1 in the section entitled "Description of the Trust Funds" for a description of tax credits allowed against the combined OASDI and HI taxes on net earnings from self-employment in 1984-89. | |||||||
Table III.A2 shows estimated annual income rates and cost rates for
the OASDI program, the HI program, and the combined OASDI and
HI programs, based on the low cost, intermediate, and high cost sets
of assumptions (alternatives I, II, and III) described earlier in this
report. These annual rates are intended to indicate the cash-flow
operation of the programs. Therefore, income rates exclude interest
earned on trust fund assets and cost rates exclude the cost of
accumulating or maintaining target trust fund balances. Table III.A2 also
shows the difference between income rates and cost rates, called
balances. Estimates shown for the combined trust funds are theoretical
because no authority currently exists for transferring assets from one
trust fund to another.
Under all three sets of assumptions, combined OASDI and HI cost
rates are projected to rise above current levels, with the sharpest
increase occurring during the period 2010-30. Under the high cost set
of assumptions, alternative III, annual deficits are projected to occur
beginning in 1998, and to continue for the remainder of the 75-year
projection period. Cost rates are projected to rise to over three times
their current level by the end of the projection period. Under the
intermediate assumptions, alternative II, annual deficits begin in the
year 2000, with cost rates doubling by the end of the projection period.
Under the low cost assumptions, alternative I, cost rates are projected
to increase by about 33 percent, with annual deficits beginning by the
year 2015.
Table III.A2.
Comparison of Estimated Income Rates and Cost Rates
1/
[As a percentage of taxable payroll
1/]
| |||||||||||
|
Calendar year |
OASDI |
HI |
Combined | ||||||||
|
Income rate |
Cost rate |
Balance |
Income rate |
Cost rate |
Balance |
Income rate |
Cost rate |
Balance | |||
| Intermediate: | |||||||||||
| 1997 | 12.63 | 11.49 | 1.14 | 3.01 | 3.57 | -0.56 | 15.64 | 15.06 | 0.58 | ||
| 1998 | 12.63 | 11.61 | 1.02 | 3.01 | 3.72 | -.71 | 15.64 | 15.33 | .31 | ||
| 1999 | 12.64 | 11.68 | .95 | 3.01 | 3.84 | -.83 | 15.65 | 15.53 | .12 | ||
| 2000 | 12.64 | 11.73 | .91 | 3.02 | 3.96 | -.95 | 15.65 | 15.69 | -.03 | ||
| 2001 | 12.65 | 11.77 | .88 | 3.02 | 4.08 | -1.07 | 15.67 | 15.85 | -.18 | ||
| 2002 | 12.66 | 11.83 | .83 | 3.02 | 4.20 | -1.18 | 15.68 | 16.03 | -.35 | ||
| 2003 | 12.66 | 11.87 | .79 | 3.03 | 4.32 | -1.29 | 15.69 | 16.19 | -.50 | ||
| 2004 | 12.67 | 11.93 | .74 | 3.03 | 4.43 | -1.40 | 15.70 | 16.36 | -.66 | ||
| 2005 | 12.67 | 11.98 | .70 | 3.03 | 4.53 | -1.49 | 15.71 | 16.51 | -.80 | ||
| 2006 | 12.68 | 12.03 | .65 | 3.04 | 4.63 | -1.59 | 15.72 | 16.66 | -.94 | ||
| 2010 | 12.73 | 12.48 | .26 | 3.06 | 5.08 | -2.02 | 15.79 | 17.55 | -1.76 | ||
| 2015 | 12.82 | 13.62 | -.80 | 3.10 | 5.82 | -2.71 | 15.92 | 19.44 | -3.51 | ||
| 2020 | 12.92 | 15.14 | -2.22 | 3.16 | 6.74 | -3.59 | 16.07 | 21.88 | -5.81 | ||
| 2025 | 13.01 | 16.53 | -3.51 | 3.21 | 7.70 | -4.49 | 16.22 | 24.23 | -8.01 | ||
| 2030 | 13.09 | 17.47 | -4.38 | 3.25 | 8.63 | -5.38 | 16.34 | 26.10 | -9.76 | ||
| 2035 | 13.14 | 17.84 | -4.70 | 3.28 | 9.37 | -6.09 | 16.42 | 27.21 | -10.79 | ||
| 2040 | 13.16 | 17.78 | -4.61 | 3.30 | 9.86 | -6.56 | 16.46 | 27.64 | -11.18 | ||
| 2045 | 13.18 | 17.78 | -4.60 | 3.31 | 10.17 | -6.86 | 16.49 | 27.95 | -11.46 | ||
| 2050 | 13.21 | 17.97 | -4.76 | 3.33 | 10.36 | -7.04 | 16.54 | 28.33 | -11.80 | ||
| 2055 | 13.25 | 18.36 | -5.11 | 3.35 | 10.54 | -7.19 | 16.59 | 28.89 | -12.30 | ||
| 2060 | 13.28 | 18.72 | -5.45 | 3.36 | 10.80 | -7.44 | 16.64 | 29.53 | -12.88 | ||
| 2065 | 13.30 | 18.97 | -5.67 | 3.38 | 11.13 | -7.75 | 16.68 | 30.10 | -13.42 | ||
| 2070 | 13.32 | 19.18 | -5.86 | 3.39 | 11.50 | -8.11 | 16.71 | 30.68 | -13.97 | ||
| Low Cost: | |||||||||||
| 1997 | 12.63 | 11.38 | 1.24 | 3.01 | 3.51 | -.50 | 15.63 | 14.89 | .74 | ||
| 1998 | 12.63 | 11.36 | 1.26 | 3.01 | 3.60 | -.59 | 15.63 | 14.97 | .67 | ||
| 1999 | 12.63 | 11.30 | 1.33 | 3.01 | 3.67 | -.66 | 15.64 | 14.97 | .67 | ||
| 2000 | 12.61 | 11.21 | 1.40 | 3.01 | 3.73 | -.72 | 15.62 | 14.94 | .68 | ||
| 2001 | 12.64 | 11.13 | 1.50 | 3.01 | 3.79 | -.78 | 15.65 | 14.92 | .73 | ||
| 2002 | 12.64 | 11.05 | 1.59 | 3.02 | 3.84 | -.83 | 15.66 | 14.90 | .76 | ||
| 2003 | 12.64 | 10.97 | 1.68 | 3.02 | 3.90 | -.88 | 15.66 | 14.86 | .80 | ||
| 2004 | 12.65 | 10.92 | 1.73 | 3.02 | 3.94 | -.92 | 15.67 | 14.86 | .81 | ||
| 2005 | 12.65 | 10.86 | 1.79 | 3.02 | 3.97 | -.95 | 15.67 | 14.84 | .84 | ||
| 2006 | 12.65 | 10.82 | 1.84 | 3.03 | 4.01 | -.98 | 15.68 | 14.82 | .86 | ||
| 2010 | 12.69 | 11.02 | 1.67 | 3.04 | 4.16 | -1.11 | 15.73 | 15.18 | .55 | ||
| 2015 | 12.76 | 11.95 | .81 | 3.08 | 4.43 | -1.36 | 15.84 | 16.38 | -.55 | ||
| 2020 | 12.84 | 13.18 | -.34 | 3.12 | 4.78 | -1.66 | 15.96 | 17.96 | -2.00 | ||
| 2025 | 12.91 | 14.20 | -1.29 | 3.16 | 4.99 | -1.83 | 16.07 | 19.19 | -3.12 | ||
| 2030 | 12.97 | 14.73 | -1.76 | 3.19 | 5.18 | -1.99 | 16.16 | 19.91 | -3.76 | ||
| 2035 | 12.99 | 14.70 | -1.70 | 3.21 | 5.32 | -2.11 | 16.20 | 20.02 | -3.81 | ||
| 2040 | 13.00 | 14.27 | -1.27 | 3.22 | 5.40 | -2.19 | 16.22 | 19.68 | -3.46 | ||
| 2045 | 13.00 | 13.93 | -.93 | 3.22 | 5.49 | -2.27 | 16.22 | 19.43 | -3.21 | ||
| 2050 | 13.01 | 13.76 | -.75 | 3.23 | 5.59 | -2.37 | 16.24 | 19.36 | -3.12 | ||
| 2055 | 13.02 | 13.75 | -.72 | 3.23 | 5.68 | -2.44 | 16.26 | 19.43 | -3.17 | ||
| 2060 | 13.03 | 13.69 | -.66 | 3.24 | 5.82 | -2.57 | 16.28 | 19.51 | -3.23 | ||
| 2065 | 13.04 | 13.56 | -.52 | 3.24 | 5.99 | -2.75 | 16.28 | 19.55 | -3.27 | ||
| 2070 | 13.04 | 13.46 | -.41 | 3.25 | 6.20 | -2.96 | 16.29 | 19.66 | -3.37 | ||
| High Cost: | |||||||||||
| 1997 | 12.63 | 11.58 | 1.05 | 3.01 | 3.71 | -.70 | 15.64 | 15.29 | .35 | ||
| 1998 | 12.64 | 12.09 | .55 | 3.01 | 3.98 | -.96 | 15.65 | 16.07 | -.42 | ||
| 1999 | 12.64 | 12.04 | .60 | 3.02 | 4.13 | -1.11 | 15.66 | 16.17 | -.51 | ||
| 2000 | 12.67 | 12.24 | .44 | 3.02 | 4.27 | -1.25 | 15.69 | 16.51 | -.82 | ||
| 2001 | 12.67 | 12.96 | -.28 | 3.03 | 4.57 | -1.54 | 15.70 | 17.53 | -1.83 | ||
| 2002 | 12.68 | 13.01 | -.33 | 3.03 | 4.74 | -1.70 | 15.71 | 17.75 | -2.03 | ||
| 2003 | 12.69 | 13.06 | -.37 | 3.04 | 4.91 | -1.88 | 15.72 | 17.97 | -2.25 | ||
| 2004 | 12.69 | 13.14 | -.45 | 3.04 | 5.11 | -2.07 | 15.73 | 18.25 | -2.52 | ||
| 2005 | 12.70 | 13.27 | -.57 | 3.04 | 5.30 | -2.25 | 15.75 | 18.57 | -2.82 | ||
| 2006 | 12.71 | 13.42 | -.71 | 3.05 | 5.49 | -2.44 | 15.76 | 18.91 | -3.15 | ||
| 2010 | 12.78 | 14.12 | -1.34 | 3.08 | 6.40 | -3.31 | 15.86 | 20.52 | -4.66 | ||
| 2015 | 12.89 | 15.49 | -2.60 | 3.14 | 7.94 | -4.80 | 16.03 | 23.43 | -7.41 | ||
| 2020 | 13.01 | 17.38 | -4.37 | 3.20 | 9.98 | -6.78 | 16.21 | 27.36 | -11.15 | ||
| 2025 | 13.13 | 19.25 | -6.12 | 3.27 | 12.49 | -9.22 | 16.40 | 31.74 | -15.34 | ||
| 2030 | 13.24 | 20.79 | -7.55 | 3.33 | 15.08 | -11.75 | 16.57 | 35.87 | -19.30 | ||
| 2035 | 13.33 | 21.81 | -8.49 | 3.37 | 17.29 | -13.92 | 16.70 | 39.11 | -22.40 | ||
| 2040 | 13.39 | 22.44 | -9.05 | 3.41 | 18.78 | -15.37 | 16.79 | 41.21 | -24.42 | ||
| 2045 | 13.44 | 23.15 | -9.71 | 3.44 | 19.62 | -16.18 | 16.88 | 42.77 | -25.89 | ||
| 2050 | 13.50 | 24.07 | -10.57 | 3.47 | 19.97 | -16.50 | 16.98 | 44.05 | -27.07 | ||
| 2055 | 13.58 | 25.29 | -11.71 | 3.52 | 20.28 | -16.76 | 17.10 | 45.56 | -28.46 | ||
| 2060 | 13.66 | 26.55 | -12.88 | 3.56 | 20.77 | -17.20 | 17.23 | 47.31 | -30.09 | ||
| 2065 | 13.74 | 27.68 | -13.94 | 3.60 | 21.40 | -17.80 | 17.34 | 49.07 | -31.74 | ||
| 2070 | 13.80 | 28.71 | -14.90 | 3.64 | 22.16 | -18.52 | 17.44 | 50.86 | -33.42 | ||
|
1
The taxable payroll for HI is significantly larger than the taxable
payroll for OASDI because the HI taxable maximum amount was eliminated
beginning 1994, and because HI covers all Federal civilian
employees, including those hired before 1984, all State and local
government employees hired after April 1, 1986, and railroad
employees. Combined OASDI and HI rates are computed as the sum of
the separately derived rates for each program.
Notes:
1. The income rate excludes interest income and certain transfers from the general fund of the Treasury. 2. Totals do not necessarily equal the sums of rounded components. | |||||||||||
Tables III.A3 and III.A4 show the estimates of summarized OASDI
and HI income rates, cost rates and balances for various time periods,
based on all three sets of assumptions. In table
III.A3 values are summarized over the
three 25-year subperiods (excluding the beginning
fund balances and the cost of accumulating ending fund targets). In
table III.A4 values are summarized over the 25-year, 50-year, and 75-year
valuation periods (for which beginning fund balances are
included in the summarized income rates, and the costs of accumulating
an ending fund balance equal to 100 percent of annual expenditures
by the end of the period are included in the summarized cost
rates). Estimates shown for the combined trust funds are theoretical
because no authority currently exists for transferring assets from one
trust fund to another.
Table III.A3. Comparison of Summarized
Income Rates and Cost Rates 1/
[As a percentage of taxable payroll 1/]
| |||||||||||
| Subperiod |
OASDI |
HI |
Combined | ||||||||
|
Income rate |
Cost rate |
Balance |
Income rate |
Cost rate |
Balance |
Income rate |
Cost rate |
Balance | |||
| Intermediate: | |||||||||||
| 1997-2021 | 12.72 | 12.76 | -0.04 | 3.06 | 5.00 | -1.94 | 15.78 | 17.76 | -1.98 | ||
| 2022-2046 | 13.08 | 17.41 | -4.33 | 3.26 | 8.91 | -5.65 | 16.34 | 26.32 | -9.98 | ||
| 2047-2071 | 13.24 | 18.62 | -5.38 | 3.35 | 10.77 | -7.41 | 16.59 | 29.39 | -12.79 | ||
| Low Cost: | |||||||||||
| 1997-2021 | 12.68 | 11.55 | 1.13 | 3.05 | 4.13 | -1.08 | 15.73 | 15.68 | .05 | ||
| 2022-2046 | 12.95 | 14.42 | -1.47 | 3.19 | 5.23 | -2.04 | 16.14 | 19.65 | -3.51 | ||
| 2047-2071 | 13.01 | 13.74 | -.73 | 3.24 | 5.81 | -2.57 | 16.25 | 19.55 | -3.30 | ||
| High Cost: | |||||||||||
| 1997-2021 | 12.77 | 14.17 | -1.41 | 3.08 | 6.36 | -3.27 | 15.85 | 20.53 | -4.68 | ||
| 2022-2046 | 13.26 | 21.20 | -7.95 | 3.35 | 15.98 | -12.63 | 16.61 | 37.18 | -20.58 | ||
| 2047-2071 | 13.61 | 26.14 | -12.52 | 3.54 | 20.71 | -17.17 | 17.15 | 46.85 | -29.69 | ||
| 1 The taxable payroll for HI is significantly larger than the taxable payroll for OASDI because the HI taxable maximum amount was eliminated beginning 1994, and because HI covers all Federal civilian employees, including those hired before 1984, all State and local government employees hired after April 1, 1986, and railroad employees. Combined OASDI and HI rates are computed as the sum of the separately derived rates for each program. 2 For 25-year subperiods, income rates do not include beginning trust fund balances and cost rates do not include the cost of reaching ending fund targets. Note: Totals do not necessarily equal the sums of rounded components. | |||||||||||
Under the high cost alternative III, the combined OASDI and HI
system is projected to experience large deficits during the 25-year, 50-year,
and 75-year valuation periods (including beginning trust fund
balances and the cost of ending fund targets). Deficits are projected to
occur during each 25-year subperiod of the 75-year projection period
(excluding beginning trust fund balances and the cost of ending fund
targets). Under intermediate alternative II assumptions, deficits of
smaller magnitude than those for the high cost alternative III are
projected to occur for each of the three 25-year subperiods and for each of
the three valuation periods. Under the low cost alternative I, the
combined OASDI and HI system is projected to show positive balances for
the first 25-year subperiod and the 25-year valuation period.
Relatively small deficits are projected for the 50-year and
75-year valuation periods and for the second and third 25-year subperiods.
Table III.A4.
Comparison of Summarized Income Rates and Cost Rates
1/ for Valuation
[As a percentage of taxable payroll 1/]
| |||||||||||
|
Valuation period |
OASDI |
HI |
Combined | ||||||||
|
Income rate |
Cost rate |
Balance |
Income rate |
Cost rate |
Balance |
Income rate |
Cost rate |
Balance | |||
| Intermediate: | |||||||||||
| 25-years: | |||||||||||
| 1997-2021 | 13.62 | 13.28 | 0.35 | 3.06 | 5.08 | -2.02 | 16.68 | 18.36 | -1.67 | ||
| 50-years: | |||||||||||
| 1997-2046 | 13.41 | 14.86 | -1.45 | 3.14 | 6.64 | -3.50 | 16.55 | 21.50 | -4.95 | ||
| 75-years: | |||||||||||
| 1997-2071 | 13.37 | 15.60 | -2.23 | 3.19 | 7.51 | -4.32 | 16.56 | 23.11 | -6.55 | ||
| Low Cost: | |||||||||||
| 25-years: | |||||||||||
| 1997-2021 | 13.57 | 12.00 | 1.57 | 3.05 | 4.14 | -1.09 | 16.62 | 16.14 | .48 | ||
| 50-years: | |||||||||||
| 1997-2046 | 13.32 | 12.89 | .42 | 3.11 | 4.57 | -1.46 | 16.43 | 17.46 | -1.04 | ||
| 75-years: | |||||||||||
| 1997-2071 | 13.25 | 13.03 | .21 | 3.14 | 4.85 | -1.71 | 16.39 | 17.88 | -1.50 | ||
| High Cost: | |||||||||||
| 25-years: | |||||||||||
| 1997-2021 | 13.69 | 14.78 | -1.09 | 3.08 | 6.57 | -3.49 | 16.77 | 21.35 | -4.58 | ||
| 50-years: | |||||||||||
| 1997-2046 | 13.51 | 17.32 | -3.81 | 3.19 | 10.55 | -7.35 | 16.70 | 27.87 | -11.16 | ||
| 75-years: | |||||||||||
| 1997-2071 | 13.53 | 19.07 | -5.54 | 3.27 | 12.68 | -9.41 | 16.80 | 31.75 | -14.95 | ||
|
1
The taxable payroll for HI is significantly larger than the taxable
payroll for OASDI because the HI taxable maximum amount was
eliminated beginning 1994, and because HI covers all Federal
civilian employees, including those hired before 1984, all State
and local government employees hired after April 1, 1986, and
railroad employees. Combined OASDI and HI rates are computed as the
sum of the separately derived rates for each program. 2 For valuation periods, beginning trust fund balances are included in the income rates for OASDI but are treated as offsets to the cost rates for HI (to be consistent with the treatment of the beginning fund balance in the HI Trustees Report); cost rates for both programs include an ending fund target equal to 100 percent of annual expenditures by the end of the period. Note: Totals do not necessarily equal the sums of rounded components. | |||||||||||
The selection of a particular index for adjustment of current dollars depends upon the analyst's decision as to which index provides the most useful standard for adjusting dollar amounts, over time, to create values that are appropriately comparable. Table III.B1 presents five such indices for adjustment.
One of the most common forms of standardization is based on some measure of change in the prices of consumer goods. One such price index is the Consumer Price Index for Urban Wage Earners and Clerical Workers (CPI-W, hereafter referred to as "CPI") which is published by the Bureau of Labor Statistics, Department of Labor. This is the index used to determine annual increases in OASDI monthly benefits payable after the year of initial eligibility. The CPI is assumed to increase ultimately at annual rates of 2.5, 3.5, and 4.5 percent for the low cost, intermediate, and high cost sets of assumptions (alternatives I, II, and III, respectively). Constant-dollar values (those adjusted by the CPI) are provided in table III.B2.
Another type of standardization combines the effects of price inflation and real-wage growth. The wage index presented here is the "SSA average wage index," as defined in section 215(i)(1)(G) of the Social Security Act. This index is used to make annual adjustments to many earnings-related quantities embodied in the Social Security Act, such as the contribution and benefit base. The average annual wage is assumed to increase ultimately by 3.9, 4.4, and 4.9 percent under the low cost, intermediate, and high cost alternatives (I, II, and III), respectively.
The taxable payroll index adjusts for the effects of changes in the number of workers and changes in the proportion of earnings that are taxable, as well as for the effects of price inflation and real-wage growth. The OASDI taxable payroll consists of all earnings subject to OASDI taxation, adjusted for the lower effective tax rate on multiple-employer "excess wages," and including deemed wage credits for military service.
The gross domestic product (GDP) index adjusts for the growth in the aggregate amount of goods and services produced in the United States. Values adjusted by GDP (see appendix C) indicate their relative share of the total output of the economy. No explicit assumptions are made about growth in taxable payroll or GDP. These series are computed reflecting the other more basic economic and demographic assumptions, as discussed in section II.H.
Discounting with interest is another way of adjusting current dollars.
The series of interest-rate factors included here is based on the average
of the assumed annual interest rates for special public-debt obligations
issuable to the trust funds. This series is slightly different
from the interest rates used to create summarized values elsewhere in
this report, where the actual yield on currently held trust fund assets
is used for each year. Ultimate nominal interest rates, compounded
semiannually, are assumed to be approximately 5.9, 6.2, and 6.4 percent
for the low cost, intermediate, and high cost alternatives (I, II,
and III), respectively.
Table III.B1. Selected Economic
Variables by Alternative,
[GDP and taxable payroll in billions] | |||||
|
Calendar year |
Adjusted CPI 1/ |
SSA average wage index 2/ |
Taxable payroll 3/ |
Gross domestic product |
Compound interest-rate factor 4/ |
| Intermediate: | |||||
| 1996 | 96.92 | $25,723.87 | $3,077 | $7,580 | 0.9372 |
| 1997 | 100.00 | 26,731.84 | 3,229 | 7,963 | 1.0000 |
| 1998 | 103.21 | 27,582.94 | 3,350 | 8,365 | 1.0675 |
| 1999 | 106.54 | 28,674.74 | 3,503 | 8,796 | 1.1404 |
| 2000 | 110.13 | 29,875.21 | 3,671 | 9,256 | 1.2182 |
| 2001 | 113.96 | 31,139.42 | 3,860 | 9,748 | 1.3007 |
| 2002 | 117.92 | 32,487.42 | 4,057 | 10,273 | 1.3883 |
| 2003 | 122.08 | 33,926.04 | 4,266 | 10,825 | 1.4818 |
| 2004 | 126.35 | 35,427.70 | 4,489 | 11,408 | 1.5807 |
| 2005 | 130.75 | 36,985.18 | 4,726 | 12,024 | 1.6849 |
| 2006 | 135.35 | 38,608.67 | 4,977 | 12,678 | 1.7939 |
| 2010 | 155.31 | 45,865.58 | 6,087 | 15,587 | 2.2911 |
| 2015 | 184.46 | 56,883.93 | 7,695 | 19,886 | 3.1089 |
| 2020 | 219.08 | 70,549.22 | 9,623 | 25,111 | 4.2185 |
| 2025 | 260.20 | 87,497.34 | 11,972 | 31,542 | 5.7241 |
| 2030 | 309.04 | 108,516.90 | 14,975 | 39,835 | 7.7672 |
| 2035 | 367.04 | 134,586.00 | 18,805 | 50,507 | 10.5394 |
| 2040 | 435.93 | 166,917.69 | 23,614 | 64,037 | 14.3012 |
| 2045 | 517.75 | 207,016.45 | 29,548 | 80,902 | 19.4055 |
| 2050 | 614.92 | 256,748.19 | 36,879 | 101,948 | 26.3317 |
| 2055 | 730.33 | 318,426.94 | 45,966 | 128,296 | 35.7300 |
| 2060 | 867.41 | 394,922.84 | 57,308 | 161,494 | 48.4828 |
| 2065 | 1,030.21 | 489,795.44 | 71,500 | 203,431 | 65.7872 |
| 2070 | 1,223.56 | 607,459.38 | 89,191 | 256,211 | 89.2679 |
| 2075 | 1,453.21 | 753,389.75 | 111,126 | 322,298 | 121.1294 |
| Low Cost: | |||||
| 1996 | 97.22 | 25,831.11 | 3,079 | 7,587 | .9372 |
| 1997 | 100.00 | 26,812.51 | 3,249 | 8,004 | 1.0000 |
| 1998 | 102.65 | 27,569.06 | 3,391 | 8,422 | 1.0670 |
| 1999 | 105.24 | 28,606.74 | 3,555 | 8,853 | 1.1374 |
| 2000 | 107.82 | 29,705.69 | 3,730 | 9,304 | 1.2102 |
| 2001 | 110.54 | 30,834.16 | 3,918 | 9,775 | 1.2862 |
| 2002 | 113.31 | 31,998.55 | 4,116 | 10,270 | 1.3662 |
| 2003 | 116.15 | 33,265.39 | 4,323 | 10,787 | 1.4499 |
| 2004 | 119.05 | 34,570.01 | 4,537 | 11,323 | 1.5382 |
| 2005 | 122.02 | 35,914.90 | 4,764 | 11,887 | 1.6318 |
| 2006 | 125.05 | 37,312.17 | 5,003 | 12,480 | 1.7311 |
| 2010 | 138.03 | 43,482.33 | 6,033 | 15,031 | 2.1837 |
| 2015 | 156.17 | 52,649.06 | 7,463 | 18,677 | 2.9202 |
| 2020 | 176.69 | 63,748.26 | 9,162 | 23,039 | 3.9051 |
| 2025 | 199.91 | 77,187.36 | 11,229 | 28,374 | 5.2222 |
| 2030 | 226.18 | 93,459.62 | 13,896 | 35,284 | 6.9836 |
| 2035 | 255.90 | 113,162.29 | 17,318 | 44,184 | 9.3390 |
| 2040 | 289.52 | 137,018.58 | 21,635 | 55,466 | 12.4888 |
| 2045 | 327.57 | 165,904.11 | 26,979 | 69,499 | 16.7011 |
| 2050 | 370.62 | 200,879.14 | 33,611 | 87,000 | 22.3340 |
| 2055 | 419.32 | 243,227.44 | 41,898 | 108,973 | 29.8668 |
| 2060 | 474.42 | 294,503.37 | 52,321 | 136,734 | 39.9402 |
| 2065 | 536.76 | 356,589.09 | 65,412 | 171,770 | 53.4112 |
| 2070 | 607.30 | 431,763.41 | 81,751 | 215,706 | 71.4257 |
| 2075 | 687.10 | 522,785.63 | 102,015 | 270,469 | 95.5161 |
| High Cost: | |||||
| 1996 | 96.37 | 25,716.81 | 3,075 | 7,573 | .9372 |
| 1997 | 100.00 | 26,750.93 | 3,212 | 7,922 | 1.0000 |
| 1998 | 103.94 | 27,356.31 | 3,263 | 8,159 | 1.0693 |
| 1999 | 109.57 | 29,114.53 | 3,479 | 8,801 | 1.1467 |
| 2000 | 116.14 | 30,833.02 | 3,696 | 9,416 | 1.2390 |
| 2001 | 121.51 | 31,711.98 | 3,786 | 9,661 | 1.3436 |
| 2002 | 126.95 | 33,854.48 | 4,032 | 10,371 | 1.4572 |
| 2003 | 132.65 | 35,547.71 | 4,285 | 11,072 | 1.5708 |
| 2004 | 138.65 | 37,243.99 | 4,552 | 11,739 | 1.6831 |
| 2005 | 144.90 | 39,054.18 | 4,814 | 12,444 | 1.8007 |
| 2006 | 151.41 | 40,973.14 | 5,087 | 13,184 | 1.9227 |
| 2010 | 180.56 | 49,613.66 | 6,304 | 16,515 | 2.4737 |
| 2015 | 225.01 | 63,020.05 | 8,128 | 21,595 | 3.3869 |
| 2020 | 280.40 | 80,049.07 | 10,344 | 27,885 | 4.6372 |
| 2025 | 349.43 | 101,679.58 | 13,055 | 35,705 | 6.3490 |
| 2030 | 435.45 | 129,155.00 | 16,501 | 45,785 | 8.6927 |
| 2035 | 542.65 | 164,054.72 | 20,876 | 58,766 | 11.9017 |
| 2040 | 676.24 | 208,384.88 | 26,316 | 75,159 | 16.2953 |
| 2045 | 842.72 | 264,693.72 | 32,986 | 95,576 | 22.3107 |
| 2050 | 1,050.18 | 336,218.09 | 41,165 | 121,007 | 30.5468 |
| 2055 | 1,308.72 | 427,069.53 | 51,193 | 152,668 | 41.8233 |
| 2060 | 1,630.90 | 542,470.31 | 63,557 | 192,292 | 57.2626 |
| 2065 | 2,032.40 | 689,054.25 | 78,878 | 242,110 | 78.4013 |
| 2070 | 2,532.73 | 875,247.50 | 97,849 | 304,698 | 107.3434 |
| 2075 | 3,156.25 | 1,111,753.00 | 121,259 | 383,075 | 146.9697 |
| 1 The CPI used to adjust OASDI benefits is the Consumer Price Index for Urban Wage Earners and Clerical Workers (CPI), as defined by the Bureau of Labor Statistics, Department of Labor. The values shown are adjusted by dividing the calendar-year annual average CPI by the analogous value for 1997, and multiplying the result by 100, thereby initializing the CPI at 100 for 1997. 2 The "SSA average wage index" is defined in section 215(i)(1)(G) of the Social Security Act; it is used in the calculations of initial benefits and the automatic adjustment of the contribution and benefit base and other wage-indexed program amounts. 3 Taxable payroll consists of total earnings subject to OASDI contribution rates, adjusted to include deemed wages based on military service and to reflect the lower effective contribution rates (compared to the combined employee-employer rate) which apply to multiple-employer "excess wages." 4 The compound interest-rate factor is based on the average of the assumed annual interest rates for special public-debt obligations issuable to the trust funds in the 12 months of the year, under each alternative. | |||||
Table III.B2 shows estimated operations of the combined OASI and DI
Trust Funds in constant 1997 dollars (i.e., adjusted by the CPI indexing
series as discussed above). Items included in the table are: income
excluding interest, interest income, total income, total outgo, and
assets at the end of the year. Income excluding interest consists of
payroll-tax contributions, income from taxation of benefits, and miscellaneous
reimbursements from the general fund of the Treasury.
Outgo consists of benefit payments, administrative expenses, net
transfers from the OASI and DI Trust Funds to the Railroad Retirement program
under the financial-interchange provisions, and payments for vocational
rehabilitation services for disabled beneficiaries.
These estimates are based on the low cost, intermediate, and high cost
sets of assumptions (alternatives I, II, and III).
Table III.B2. Estimated Operations of the Combined OASI and DI Trust Funds in Constant 1997 Dollars 1/ by Alternative, Calendar Years 1997-2075[In billions] | |||||
|
Calendar year |
Income excluding interest |
Interest income |
Total income |
Outgo |
Assets at end of year |
| Intermediate: | |||||
| 1997 | $407.7 | $43.7 | $451.3 | $370.8 | $647.4 |
| 1998 | 409.1 | 47.1 | 456.2 | 377.0 | 706.5 |
| 1999 | 414.4 | 50.4 | 464.8 | 384.1 | 765.1 |
| 2000 | 420.4 | 53.8 | 474.3 | 390.9 | 823.5 |
| 2001 | 427.6 | 57.1 | 484.8 | 398.6 | 882.0 |
| 2002 | 434.4 | 60.5 | 494.9 | 406.9 | 940.3 |
| 2003 | 441.3 | 63.9 | 505.2 | 414.9 | 998.7 |
| 2004 | 448.6 | 67.1 | 515.7 | 423.9 | 1,056.7 |
| 2005 | 457.2 | 70.3 | 527.5 | 433.0 | 1,115.6 |
| 2006 | 464.7 | 73.3 | 538.0 | 442.3 | 1,173.5 |
| 2010 | 497.4 | 81.3 | 578.7 | 489.0 | 1,378.5 |
| 2015 | 533.1 | 87.1 | 620.2 | 568.1 | 1,484.6 |
| 2020 | 565.7 | 77.2 | 642.9 | 665.0 | 1,293.5 |
| 2025 2/ | 596.9 | 44.5 | 641.3 | 760.4 | 717.0 |
| Low Cost: | |||||
| 1997 | 409.1 | 43.6 | 452.8 | 369.9 | 649.8 |
| 1998 | 416.1 | 47.4 | 463.5 | 375.4 | 721.1 |
| 1999 | 425.5 | 51.4 | 476.8 | 381.8 | 798.4 |
| 2000 | 435.2 | 55.8 | 491.0 | 387.8 | 882.5 |
| 2001 | 447.1 | 60.4 | 507.5 | 394.5 | 973.8 |
| 2002 | 458.0 | 65.3 | 523.4 | 401.5 | 1,071.8 |
| 2003 | 469.3 | 70.6 | 539.9 | 408.1 | 1,177.4 |
| 2004 | 480.5 | 76.2 | 556.7 | 416.0 | 1,289.3 |
| 2005 | 493.0 | 82.4 | 575.3 | 424.2 | 1,409.2 |
| 2006 | 504.6 | 88.8 | 593.4 | 432.7 | 1,535.7 |
| 2010 | 553.0 | 115.8 | 668.8 | 481.7 | 2,083.8 |
| 2015 | 608.0 | 152.7 | 760.7 | 571.0 | 2,752.2 |
| 2020 | 663.9 | 182.9 | 846.8 | 683.4 | 3,268.9 |
| 2025 | 723.2 | 200.7 | 923.9 | 797.5 | 3,564.4 |
| 2030 | 794.3 | 206.3 | 1,000.6 | 905.0 | 3,653.4 |
| 2035 | 876.8 | 206.0 | 1,082.8 | 994.6 | 3,650.8 |
| 2040 | 968.6 | 208.1 | 1,176.7 | 1,066.7 | 3,701.4 |
| 2045 | 1,067.8 | 217.2 | 1,285.0 | 1,147.7 | 3,876.5 |
| 2050 | 1,176.5 | 232.1 | 1,408.6 | 1,248.2 | 4,149.6 |
| 2055 | 1,297.6 | 250.0 | 1,547.6 | 1,373.8 | 4,472.3 |
| 2060 | 1,433.2 | 269.7 | 1,703.0 | 1,510.2 | 4,829.8 |
| 2065 | 1,584.1 | 294.4 | 1,878.6 | 1,652.6 | 5,279.1 |
| 2070 | 1,750.2 | 326.3 | 2,076.5 | 1,811.2 | 5,856.2 |
| 2075 | 1,931.2 | 364.5 | 2,295.8 | 1,995.7 | 6,542.9 |
| High Cost: | |||||
| 1997 | 406.5 | 43.8 | 450.2 | 372.0 | 645.2 |
| 1998 | 396.3 | 46.6 | 442.9 | 379.6 | 684.0 |
| 1999 | 399.8 | 48.9 | 448.7 | 382.4 | 715.1 |
| 2000 | 402.8 | 51.7 | 454.5 | 389.5 | 739.7 |
| 2001 | 394.3 | 54.1 | 448.4 | 403.7 | 751.7 |
| 2002 | 401.3 | 55.1 | 456.4 | 413.2 | 762.7 |
| 2003 | 408.8 | 55.6 | 464.3 | 421.9 | 772.4 |
| 2004 | 415.1 | 55.5 | 470.6 | 431.4 | 778.1 |
| 2005 | 421.0 | 55.2 | 476.1 | 441.0 | 779.7 |
| 2006 | 425.5 | 54.3 | 479.9 | 450.9 | 775.2 |
| 2010 | 444.6 | 42.4 | 487.0 | 493.1 | 678.6 |
| 2015 2/ | 464.1 | 21.4 | 485.5 | 559.7 | 335.6 |
| 1 The adjustment from current to constant dollars is by the CPI indexing series shown in table III.B1. 2 Estimates for later years are not shown because the combined OASI and DI Trust Funds are estimated to become exhausted in 2029 under the intermediate assumptions and in 2018 under the high cost assumptions. Note: Totals do not necessarily equal the sums of rounded components. | |||||
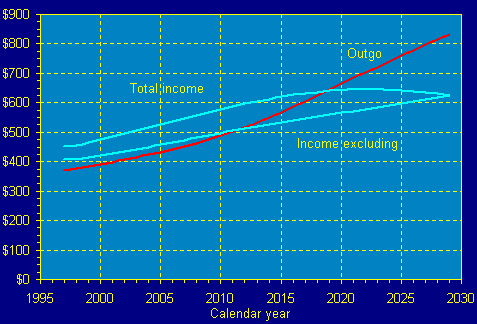
Figure III.B1 provides a comparison of outgo with total annual income
(including interest) and annual income excluding interest, for the
OASDI program under intermediate assumptions. All values are
expressed in constant dollars, as shown in table III.B2. The difference
between the income values for each year is equal to the trust fund
interest earnings. Thus the figure illustrates the fact that, under
intermediate assumptions, combined OASDI expenditures will be
payable from (1) current tax income alone through 2011, (2) current
tax income plus a portion of annual interest income for years 2012
through 2018, and (3) current tax income, annual interest income,
plus a portion of the principal balance in the trust funds for years
2019 through 2028, i.e., through the year preceding the year of trust
fund exhaustion.
Figure III.B1.
Estimated OASDI Income and Outgo in Constant Dollars,
[In billions] |
|
Table III.B3. Estimated Operations of the Combined OASI and DI Trust Funds in Current Dollars by Alternative, Calendar Years 1997-2075[In billions] | |||||
|
Calendar year |
Income excluding interest |
Interest income |
Total income |
Outgo |
Assets at end of year |
| Intermediate: | |||||
| 1997 | $407.7 | $43.7 | $451.3 | $370.8 | $647.4 |
| 1998 | 422.3 | 48.6 | 470.8 | 389.1 | 729.2 |
| 1999 | 441.5 | 53.7 | 495.2 | 409.3 | 815.1 |
| 2000 | 463.0 | 59.3 | 522.3 | 430.5 | 906.9 |
| 2001 | 487.3 | 65.1 | 552.5 | 454.3 | 1,005.1 |
| 2002 | 512.2 | 71.4 | 583.6 | 479.9 | 1,108.9 |
| 2003 | 538.8 | 78.0 | 616.8 | 506.5 | 1,219.1 |
| 2004 | 566.8 | 84.8 | 651.6 | 535.6 | 1,335.1 |
| 2005 | 597.8 | 91.9 | 689.7 | 566.2 | 1,458.7 |
| 2006 | 628.9 | 99.3 | 728.2 | 598.6 | 1,588.2 |
| 2010 | 772.5 | 126.3 | 898.8 | 759.5 | 2,141.0 |
| 2015 | 983.3 | 160.7 | 1,144.0 | 1,048.0 | 2,738.5 |
| 2020 | 1,239.5 | 169.1 | 1,408.5 | 1,457.0 | 2,833.8 |
| 2025 1/ | 1,553.1 | 115.7 | 1,668.8 | 1,978.5 | 1,865.5 |
| Low Cost: | |||||
| 1997 | 409.1 | 43.6 | 452.8 | 369.9 | 649.8 |
| 1998 | 427.1 | 48.6 | 475.7 | 385.3 | 740.3 |
| 1999 | 447.7 | 54.1 | 501.8 | 401.8 | 840.2 |
| 2000 | 469.2 | 60.2 | 529.4 | 418.2 | 951.5 |
| 2001 | 494.2 | 66.8 | 561.0 | 436.1 | 1,076.4 |
| 2002 | 519.0 | 74.0 | 593.0 | 455.0 | 1,214.4 |
| 2003 | 545.1 | 82.0 | 627.1 | 474.0 | 1,367.6 |
| 2004 | 572.0 | 90.7 | 662.7 | 495.3 | 1,535.0 |
| 2005 | 601.5 | 100.5 | 702.0 | 517.5 | 1,719.5 |
| 2006 | 631.0 | 111.1 | 742.0 | 541.1 | 1,920.4 |
| 2010 | 763.3 | 159.9 | 923.2 | 664.9 | 2,876.2 |
| 2015 | 949.5 | 238.5 | 1,188.0 | 891.8 | 4,298.1 |
| 2020 | 1,173.0 | 323.2 | 1,496.2 | 1,207.5 | 5,775.8 |
| 2025 | 1,445.8 | 401.2 | 1,846.9 | 1,594.3 | 7,125.4 |
| 2030 | 1,796.6 | 466.5 | 2,263.1 | 2,046.9 | 8,263.2 |
| 2035 | 2,243.7 | 527.2 | 2,770.9 | 2,545.2 | 9,342.3 |
| 2040 | 2,804.3 | 602.5 | 3,406.8 | 3,088.3 | 10,716.4 |
| 2045 | 3,497.8 | 711.5 | 4,209.4 | 3,759.5 | 12,698.1 |
| 2050 | 4,360.4 | 860.1 | 5,220.5 | 4,626.0 | 15,378.9 |
| 2055 | 5,441.1 | 1,048.3 | 6,489.4 | 5,760.8 | 18,753.2 |
| 2060 | 6,799.6 | 1,279.7 | 8,079.3 | 7,164.8 | 22,913.4 |
| 2065 | 8,503.1 | 1,580.3 | 10,083.4 | 8,870.4 | 28,336.3 |
| 2070 | 10,629.1 | 1,981.4 | 12,610.5 | 10,999.6 | 35,564.8 |
| 2075 | 13,269.6 | 2,504.6 | 15,774.2 | 13,712.8 | 44,956.1 |
| High Cost: | |||||
| 1997 | 406.5 | 43.8 | 450.2 | 372.0 | 645.2 |
| 1998 | 411.9 | 48.4 | 460.3 | 394.6 | 710.9 |
| 1999 | 438.1 | 53.5 | 491.6 | 419.0 | 783.6 |
| 2000 | 467.7 | 60.1 | 527.8 | 452.3 | 859.1 |
| 2001 | 479.2 | 65.7 | 544.9 | 490.5 | 913.4 |
| 2002 | 509.5 | 70.0 | 579.5 | 524.6 | 968.3 |
| 2003 | 542.2 | 73.7 | 615.9 | 559.6 | 1,024.6 |
| 2004 | 575.5 | 76.9 | 652.5 | 598.2 | 1,078.9 |
| 2005 | 610.0 | 79.9 | 689.9 | 639.0 | 1,129.8 |
| 2006 | 644.3 | 82.3 | 726.5 | 682.6 | 1,173.7 |
| 2010 | 802.8 | 76.5 | 879.3 | 890.3 | 1,225.2 |
| 2015 1/ | 1,044.3 | 48.1 | 1,092.5 | 1,259.3 | 755.1 |
| 1 Estimates for later years are not shown because the combined OASI and DI Trust Funds are estimated to become exhausted in 2029 under alternative II and in 2018 under alternative III. Note: Totals do not necessarily equal the sums of rounded components. | |||||
Table III.B3 shows estimated operations of the combined OASI and DI
Trust Funds in current dollars -- that is in dollars unadjusted for price
inflation. Items included in the table are: income excluding interest,
interest income, total income, total outgo, and assets at the end of the
year. These estimates, based on the low cost, intermediate, and high
cost sets of economic and demographic assumptions (I, II, and III), are
presented to facilitate independent analysis.
Table III.B4 shows, in current dollars, estimated income (excluding interest) and estimated total outgo (excluding the cost of accumulating target trust fund balances) of the combined OASI and DI Trust Funds, of the HI Trust Fund, and of the combined OASI, DI, and HI Trust Funds, based on the low cost, intermediate, and high cost sets of assumptions (alternatives I, II, and III) described earlier in this report. For OASDI, income excluding interest consists of payroll-tax contributions, proceeds from taxation of OASDI benefits, and miscellaneous transfers from the general fund of the Treasury. Outgo consists of benefit payments, administrative expenses, net transfers from the trust funds to the Railroad Retirement program, and payments for vocational rehabilitation services for disabled beneficiaries. For HI, income excluding interest consists of contributions (including contributions from railroad employment), proceeds from the taxation of OASDI benefits, and payments from the general fund of the Treasury for contributions on deemed wage credits for military service. Total outgo consists of outlays (benefits and administrative expenses) for insured beneficiaries. Income and outgo estimates are shown on a cash basis for the OASDI program and on an incurred basis for the HI program.
Table III.B4 also shows the difference between income excluding
interest and outgo, which is called the balance. The balance indicates
the size of the net cash flow from tax income and expenditures to the
funds.
Table III.B4.
Estimated OASDI and HI Income Excluding Interest, Outgo, and
[In billions]
| |||||||||||
|
Calendar year |
OASDI |
HI |
Combined | ||||||||
|
Income exclud- ing interest |
Outgo | Balance |
Income exclud- ing interest |
Outgo | Balance |
Income exclud- ing interest |
Outgo | Balance | |||
| Intermediate: | |||||||||||
| 1997 | $408 | $371 | $37 | $118 | $140 | -$22 | $525 | $511 | $15 | ||
| 1998 | 422 | 389 | 33 | 122 | 151 | -29 | 545 | 540 | 4 | ||
| 1999 | 441 | 409 | 32 | 128 | 164 | -35 | 570 | 573 | -3 | ||
| 2000 | 463 | 431 | 33 | 135 | 177 | -42 | 598 | 608 | -10 | ||
| 2001 | 487 | 454 | 33 | 142 | 192 | -50 | 630 | 647 | -17 | ||
| 2002 | 512 | 480 | 32 | 150 | 208 | -58 | 662 | 688 | -26 | ||
| 2003 | 539 | 507 | 32 | 158 | 225 | -67 | 697 | 732 | -35 | ||
| 2004 | 567 | 536 | 31 | 167 | 243 | -77 | 733 | 779 | -46 | ||
| 2005 | 598 | 566 | 32 | 176 | 262 | -87 | 773 | 828 | -55 | ||
| 2006 | 629 | 599 | 30 | 185 | 282 | -97 | 814 | 881 | -67 | ||
| 2010 | 772 | 759 | 13 | 229 | 379 | -151 | 1,001 | 1,139 | -138 | ||
| 2015 | 983 | 1,048 | -65 | 294 | 550 | -257 | 1,277 | 1,598 | -321 | ||
| 2020 | 1,239 | 1,457 | -218 | 374 | 800 | -425 | 1,614 | 2,257 | -643 | ||
| 2025 | 1,553 | 1,978 | -425 | 474 | 1,137 | -664 | 2,027 | 3,116 | -1,089 | ||
| 2030 | 1,954 | 2,616 | -662 | 601 | 1,595 | -995 | 2,555 | 4,211 | -1,657 | ||
| 2035 | 2,464 | 3,354 | -891 | 762 | 2,176 | -1,414 | 3,225 | 5,530 | -2,304 | ||
| 2040 | 3,099 | 4,198 | -1,098 | 962 | 2,876 | -1,914 | 4,061 | 7,074 | -3,013 | ||
| 2045 | 3,885 | 5,255 | -1,370 | 1,208 | 3,712 | -2,504 | 5,093 | 8,967 | -3,875 | ||
| 2050 | 4,858 | 6,627 | -1,769 | 1,516 | 4,725 | -3,209 | 6,374 | 11,351 | -4,977 | ||
| 2055 | 6,071 | 8,438 | -2,367 | 1,902 | 5,990 | -4,088 | 7,973 | 14,428 | -6,455 | ||
| 2060 | 7,588 | 10,731 | -3,143 | 2,386 | 7,659 | -5,274 | 9,974 | 18,390 | -8,416 | ||
| 2065 | 9,485 | 13,566 | -4,081 | 2,990 | 9,850 | -6,860 | 12,475 | 23,416 | -10,941 | ||
| 2070 | 11,850 | 17,107 | -5,258 | 3,745 | 12,704 | -8,959 | 15,594 | 29,811 | -14,217 | ||
| Low Cost: | |||||||||||
| 1997 | 409 | 370 | 39 | 118 | 138 | -20 | 527 | 508 | 20 | ||
| 1998 | 427 | 385 | 42 | 123 | 147 | -24 | 550 | 533 | 17 | ||
| 1999 | 448 | 402 | 46 | 129 | 157 | -28 | 577 | 559 | 18 | ||
| 2000 | 469 | 418 | 51 | 136 | 168 | -32 | 605 | 586 | 19 | ||
| 2001 | 494 | 436 | 58 | 143 | 179 | -37 | 637 | 616 | 21 | ||
| 2002 | 519 | 455 | 64 | 150 | 191 | -41 | 669 | 646 | 23 | ||
| 2003 | 545 | 474 | 71 | 158 | 203 | -46 | 703 | 677 | 25 | ||
| 2004 | 572 | 495 | 77 | 165 | 216 | -50 | 737 | 711 | 26 | ||
| 2005 | 602 | 518 | 84 | 174 | 228 | -55 | 775 | 746 | 29 | ||
| 2006 | 631 | 541 | 90 | 183 | 242 | -59 | 814 | 783 | 31 | ||
| 2010 | 763 | 665 | 98 | 221 | 302 | -81 | 984 | 967 | 17 | ||
| 2015 | 950 | 892 | 58 | 277 | 399 | -122 | 1,227 | 1,291 | -65 | ||
| 2020 | 1,173 | 1,207 | -34 | 346 | 530 | -184 | 1,519 | 1,737 | -219 | ||
| 2025 | 1,446 | 1,594 | -149 | 429 | 678 | -249 | 1,875 | 2,272 | -398 | ||
| 2030 | 1,797 | 2,047 | -250 | 537 | 872 | -335 | 2,333 | 2,919 | -586 | ||
| 2035 | 2,244 | 2,545 | -301 | 673 | 1,115 | -443 | 2,916 | 3,661 | -744 | ||
| 2040 | 2,804 | 3,088 | -284 | 842 | 1,415 | -573 | 3,647 | 4,503 | -857 | ||
| 2045 | 3,498 | 3,759 | -262 | 1,052 | 1,795 | -743 | 4,550 | 5,554 | -1,005 | ||
| 2050 | 4,360 | 4,626 | -266 | 1,313 | 2,277 | -964 | 5,674 | 6,903 | -1,230 | ||
| 2055 | 5,441 | 5,761 | -320 | 1,642 | 2,882 | -1,240 | 7,083 | 8,643 | -1,560 | ||
| 2060 | 6,800 | 7,165 | -365 | 2,055 | 3,687 | -1,632 | 8,855 | 10,852 | -1,997 | ||
| 2065 | 8,503 | 8,870 | -367 | 2,572 | 4,751 | -2,179 | 11,076 | 13,622 | -2,546 | ||
| 2070 | 10,629 | 11,000 | -371 | 3,218 | 6,150 | -2,932 | 13,847 | 17,150 | -3,303 | ||
| High Cost: | |||||||||||
| 1997 | 406 | 372 | 34 | 117 | 144 | -27 | 524 | 516 | 7 | ||
| 1998 | 412 | 395 | 17 | 119 | 157 | -38 | 531 | 552 | -21 | ||
| 1999 | 438 | 419 | 19 | 128 | 175 | -47 | 566 | 594 | -28 | ||
| 2000 | 468 | 452 | 15 | 137 | 194 | -57 | 605 | 646 | -42 | ||
| 2001 | 479 | 491 | -11 | 141 | 212 | -72 | 620 | 703 | -83 | ||
| 2002 | 509 | 525 | -15 | 150 | 234 | -84 | 660 | 759 | -99 | ||
| 2003 | 542 | 560 | -17 | 161 | 260 | -99 | 703 | 820 | -117 | ||
| 2004 | 576 | 598 | -23 | 171 | 287 | -116 | 746 | 885 | -139 | ||
| 2005 | 610 | 639 | -29 | 181 | 315 | -134 | 791 | 954 | -163 | ||
| 2006 | 644 | 683 | -38 | 192 | 345 | -154 | 836 | 1,028 | -192 | ||
| 2010 | 803 | 890 | -88 | 241 | 500 | -259 | 1,044 | 1,390 | -346 | ||
| 2015 | 1,044 | 1,259 | -215 | 317 | 802 | -485 | 1,361 | 2,061 | -700 | ||
| 2020 | 1,342 | 1,798 | -456 | 413 | 1,287 | -874 | 1,755 | 3,085 | -1,330 | ||
| 2025 | 1,709 | 2,514 | -804 | 532 | 2,033 | -1,502 | 2,241 | 4,547 | -2,306 | ||
| 2030 | 2,178 | 3,431 | -1,253 | 685 | 3,105 | -2,420 | 2,863 | 6,536 | -3,672 | ||
| 2035 | 2,774 | 4,553 | -1,779 | 879 | 4,507 | -3,628 | 3,653 | 9,061 | -5,407 | ||
| 2040 | 3,512 | 5,904 | -2,392 | 1,121 | 6,173 | -5,053 | 4,633 | 12,077 | -7,444 | ||
| 2045 | 4,421 | 7,636 | -3,215 | 1,418 | 8,089 | -6,671 | 5,839 | 15,725 | -9,886 | ||
| 2050 | 5,544 | 9,910 | -4,367 | 1,789 | 10,284 | -8,495 | 7,333 | 20,195 | -12,862 | ||
| 2055 | 6,934 | 12,945 | -6,011 | 2,254 | 12,991 | -10,737 | 9,188 | 25,936 | -16,748 | ||
| 2060 | 8,661 | 16,873 | -8,212 | 2,835 | 16,530 | -13,695 | 11,496 | 33,403 | -21,907 | ||
| 2065 | 10,806 | 21,831 | -11,024 | 3,560 | 21,152 | -17,591 | 14,367 | 42,982 | -28,616 | ||
| 2070 | 13,468 | 28,088 | -14,620 | 4,463 | 27,189 | -22,726 | 17,931 | 55,277 | -37,345 | ||
|
Notes: 1. Annual figures are available from the Office of the Chief Actuary, Social Security Administration. 2. Totals do not necessarily equal the sums of rounded components. | |||||||||||
Table III.B5 shows estimated future benefit
amounts payable to persons attaining age 65 in various years based on
retirement at the normal retirement age and at age 65, for various steady
levels of pre-retirement earnings, based on intermediate assumptions. The benefit
amount is shown in current dollars, constant dollars (adjusted by the
CPI indexing series shown in table III.B1), and as a percentage of
earnings in the 12-month period preceding retirement. The normal
retirement age is currently 65 and is scheduled to increase to age 66
during the period 2000-05 (at a rate of 2 months per year as workers
attain age 62) and to age 67 during the period 2017-22 (also by
2 months per year as workers attain age 62). The pre-retirement
earnings levels shown are: low (earnings at 45 percent of the projected
SSA average wage index), average (earnings at the amount of the projected SSA
average wage index), high (earnings at 160 percent of the
projected SSA average wage index), and maximum (earnings at the
amount of the projected OASDI contribution and benefit base).
Table III.B5.
Estimated Annual Benefit Amount Payable
1/ to Retired Workers
| ||||||||
|
Year attain age 65 2/ |
Retirement at normal retirement age |
Retirement at age 65 | ||||||
|
Age at retire- ment |
Current dollars |
Constant 1997 dollars 3/ |
Percent of earnings |
Current dollars |
Constant 1997 dollars 3/ |
Percent of earnings | ||
| Low earnings: 4/ | ||||||||
| 1997 | 65:0 | $6,810 | $6,810 | 58.8 | $6,810 | $6,810 | 58.8 | |
| 2000 | 65:0 | 7,461 | 6,775 | 57.8 | 7,461 | 6,775 | 57.8 | |
| 2005 | 65:6 | 9,254 | 6,956 | 56.8 | 8,797 | 6,728 | 55.2 | |
| 2010 | 66:0 | 11,698 | 7,277 | 56.7 | 10,507 | 6,765 | 53.1 | |
| 2015 | 66:0 | 14,502 | 7,596 | 56.7 | 13,034 | 7,066 | 53.2 | |
| 2020 | 66:2 | 18,096 | 7,935 | 56.6 | 15,971 | 7,290 | 52.5 | |
| 2025 | 67:0 | 23,203 | 8,324 | 56.4 | 18,618 | 7,155 | 49.4 | |
| 2030 | 67:0 | 28,775 | 8,692 | 56.4 | 23,095 | 7,473 | 49.4 | |
| 2035 | 67:0 | 35,684 | 9,076 | 56.4 | 28,643 | 7,804 | 49.4 | |
| 2040 | 67:0 | 44,265 | 9,479 | 56.4 | 35,527 | 8,150 | 49.4 | |
| 2045 | 67:0 | 54,903 | 9,899 | 56.5 | 44,060 | 8,510 | 49.4 | |
| 2050 | 67:0 | 68,094 | 10,337 | 56.5 | 54,651 | 8,887 | 49.4 | |
| 2055 | 67:0 | 84,461 | 10,796 | 56.5 | 67,781 | 9,281 | 49.4 | |
| 2060 | 67:0 | 104,752 | 11,273 | 56.5 | 84,065 | 9,692 | 49.4 | |
| 2065 | 67:0 | 129,918 | 11,772 | 56.5 | 104,271 | 10,121 | 49.4 | |
| 2070 | 67:0 | 161,125 | 12,293 | 56.5 | 129,316 | 10,569 | 49.4 | |
| 2075 | 67:0 | 199,841 | 12,837 | 56.5 | 160,390 | 11,037 | 49.4 | |
| Average earnings: | ||||||||
| 1997 | 65:0 | 11,226 | 11,226 | 43.6 | 11,226 | 11,226 | 43.6 | |
| 2000 | 65:0 | 12,322 | 11,189 | 43.0 | 12,322 | 11,189 | 43.0 | |
| 2005 | 65:6 | 15,289 | 11,493 | 42.2 | 14,526 | 11,109 | 41.0 | |
| 2010 | 66:0 | 19,340 | 12,031 | 42.2 | 17,354 | 11,174 | 39.5 | |
| 2015 | 66:0 | 23,974 | 12,557 | 42.1 | 21,519 | 11,666 | 39.5 | |
| 2020 | 66:2 | 29,922 | 13,121 | 42.1 | 26,369 | 12,036 | 39.0 | |
| 2025 | 67:0 | 38,416 | 13,782 | 42.1 | 30,749 | 11,817 | 36.7 | |
| 2030 | 67:0 | 47,634 | 14,389 | 42.0 | 38,127 | 12,337 | 36.7 | |
| 2035 | 67:0 | 59,080 | 15,026 | 42.0 | 47,286 | 12,883 | 36.7 | |
| 2040 | 67:0 | 73,281 | 15,693 | 42.1 | 58,647 | 13,453 | 36.7 | |
| 2045 | 67:0 | 90,888 | 16,387 | 42.1 | 72,740 | 14,049 | 36.7 | |
| 2050 | 67:0 | 112,731 | 17,114 | 42.1 | 90,226 | 14,673 | 36.7 | |
| 2055 | 67:0 | 139,811 | 17,871 | 42.1 | 111,902 | 15,322 | 36.7 | |
| 2060 | 67:0 | 173,400 | 18,661 | 42.1 | 138,788 | 16,000 | 36.7 | |
| 2065 | 67:0 | 215,065 | 19,488 | 42.1 | 172,136 | 16,709 | 36.7 | |
| 2070 | 67:0 | 266,731 | 20,350 | 42.1 | 213,488 | 17,448 | 36.7 | |
| 2075 | 67:0 | 330,806 | 21,250 | 42.1 | 264,770 | 18,220 | 36.7 | |
| High earnings: 5/ | ||||||||
| 1997 | 65:0 | 14,462 | 14,462 | 35.1 | 14,462 | 14,462 | 35.1 | |
| 2000 | 65:0 | 15,969 | 14,501 | 34.8 | 15,969 | 14,501 | 34.8 | |
| 2005 | 65:6 | 20,079 | 15,094 | 34.7 | 19,075 | 14,588 | 33.7 | |
| 2010 | 66:0 | 25,502 | 15,865 | 34.8 | 22,927 | 14,762 | 32.6 | |
| 2015 | 66:0 | 31,616 | 16,560 | 34.7 | 28,438 | 15,417 | 32.6 | |
| 2020 | 66:2 | 39,450 | 17,298 | 34.7 | 34,853 | 15,909 | 32.2 | |
| 2025 | 67:0 | 50,523 | 18,126 | 34.6 | 40,619 | 15,611 | 30.3 | |
| 2030 | 67:0 | 62,654 | 18,926 | 34.6 | 50,378 | 16,302 | 30.3 | |
| 2035 | 67:0 | 77,710 | 19,764 | 34.6 | 62,485 | 17,024 | 30.3 | |
| 2040 | 67:0 | 96,376 | 20,638 | 34.6 | 77,494 | 17,777 | 30.3 | |
| 2045 | 67:0 | 119,532 | 21,552 | 34.6 | 96,112 | 18,563 | 30.3 | |
| 2050 | 67:0 | 148,247 | 22,505 | 34.6 | 119,207 | 19,386 | 30.3 | |
| 2055 | 67:0 | 183,871 | 23,502 | 34.6 | 147,850 | 20,244 | 30.3 | |
| 2060 | 67:0 | 228,040 | 24,542 | 34.6 | 183,377 | 21,141 | 30.3 | |
| 2065 | 67:0 | 282,834 | 25,629 | 34.6 | 227,425 | 22,076 | 30.3 | |
| 2070 | 67:0 | 350,772 | 26,762 | 34.6 | 282,064 | 23,053 | 30.3 | |
| 2075 | 67:0 | 435,042 | 27,946 | 34.6 | 349,821 | 24,072 | 30.3 | |
| Maximum earnings: 6/ | ||||||||
| 1997 | 65:0 | 15,955 | 15,955 | 25.4 | 15,955 | 15,955 | 25.4 | |
| 2000 | 65:0 | 17,919 | 16,271 | 25.4 | 17,919 | 16,271 | 25.4 | |
| 2005 | 65:6 | 23,106 | 17,369 | 26.3 | 21,951 | 16,788 | 25.6 | |
| 2010 | 66:0 | 30,232 | 18,807 | 27.2 | 27,042 | 17,411 | 25.4 | |
| 2015 | 66:0 | 38,175 | 19,995 | 27.7 | 34,239 | 18,562 | 25.9 | |
| 2020 | 66:2 | 47,829 | 20,973 | 27.8 | 42,207 | 19,265 | 25.8 | |
| 2025 | 67:0 | 61,366 | 22,016 | 27.7 | 49,271 | 18,936 | 24.3 | |
| 2030 | 67:0 | 76,098 | 22,987 | 27.7 | 61,102 | 19,772 | 24.2 | |
| 2035 | 67:0 | 94,366 | 24,001 | 27.7 | 75,761 | 20,641 | 24.2 | |
| 2040 | 67:0 | 116,860 | 25,025 | 27.7 | 93,825 | 21,523 | 24.2 | |
| 2045 | 67:0 | 144,829 | 26,113 | 27.6 | 116,282 | 22,459 | 24.2 | |
| 2050 | 67:0 | 179,622 | 27,268 | 27.6 | 144,204 | 23,451 | 24.2 | |
| 2055 | 67:0 | 222,768 | 28,474 | 27.6 | 178,852 | 24,489 | 24.2 | |
| 2060 | 67:0 | 276,287 | 29,734 | 27.6 | 221,817 | 25,572 | 24.2 | |
| 2065 | 67:0 | 342,660 | 31,050 | 27.6 | 275,108 | 26,704 | 24.2 | |
| 2070 | 67:0 | 424,968 | 32,423 | 27.6 | 341,192 | 27,885 | 24.2 | |
| 2075 | 67:0 | 527,061 | 33,857 | 27.6 | 423,162 | 29,119 | 24.2 | |
| 1 Annual benefit amount is the benefit payable for the 12-month period starting with the month of retirement. 2 Assumed to attain age 65 in January of the year. 3 The adjustment from current to constant dollars is made using the CPI indexing series shown in table III.B1. 4 Earnings equal to 45 percent of average. 5 Earnings equal to 160 percent of average. 6 Earnings equal to the OASDI contribution and benefit base. | ||||||||
Table III.C1 shows estimated income excluding interest, total outgo, and the resulting balance of the combined OASI and DI Trust Funds, of the HI Trust Fund, and of the combined OASI, DI, and HI Trust Funds, expressed as percentages of GDP on the basis of each of the three alternative sets of assumptions. The estimated GDP on which these percentages are based is also shown in table III.C1. For OASDI, income excluding interest consists of payroll-tax contributions, proceeds from taxation of benefits, and various reimbursements from the general fund of the Treasury. Total outgo consists of benefit payments, administrative expenses, net transfers from the trust funds to the Railroad Retirement program, and payments for vocational rehabilitation services for disabled beneficiaries. For HI, income excluding interest consists of contributions (including contributions from railroad employment) and payments from the general fund of the Treasury for contributions on deemed wage credits for military service. Total outgo consists of outlays (benefits and administrative expenses) for insured beneficiaries. Both the HI income and outgo are on an incurred basis.
The OASDI balance (income excluding interest, less outgo) as a percentage of GDP is projected to be positive on the basis of the low cost alternative I through 2015, but with decreasing deficits after 2030. The OASDI balance is projected to be positive through 2010 on the basis of the intermediate alternative II and through 2000 on the basis of the high cost alternative III, before becoming permanently negative, with increasing deficits. The projected HI balance as a percentage of GDP, however, is negative, with increasing deficits, throughout the long-range period under all three alternatives. The combined OASDI and HI balance as a percentage of GDP is projected to be positive through 2010 under the low cost alternative I, through 1998 under the intermediate alternative II, and through only 1997 under the high cost alternative III. Between 2010 and about 2030, under all three alternatives, both the OASDI and HI balances as percentages of GDP are projected to decline substantially because the "baby-boom" generation reaches retirement age during these years. After balances cease to be positive under the intermediate and high cost alternatives, the size of annual deficits increases fairly steadily for the OASDI and HI programs, both separately and combined.
By the year 2070, the combined OASDI and HI balances as percentages of GDP, based on the three alternatives, are projected to differ by a relatively large amount: from a deficit of 1.53 percent for the low cost alternative I to a deficit of 12.26 percent for the high cost alternative III. Projected balances differ by a much smaller amount by the year 2006: from a positive balance of 0.25 percent for the low cost alternative I to a deficit of 1.46 percent for the high cost alternative III.
The summarized long-range (75-year) balance as a percentage of GDP
for the combined OASDI and HI programs varies by a relatively large
amount (from a deficit of 0.72 percent, based on the low cost alternative I,
to a deficit of 6.17 percent, based on the high cost alternative
III). The 25-year summarized balance varies by a smaller amount
(from a positive of 0.11 percent to a deficit of 2.05 percent). Summarized
rates are calculated on the present-value basis including the
trust fund balances on January 1, 1997 and the cost of reaching and
maintaining a target trust fund level equal to 100 percent of annual
expenditures by the end of the period.
(See section II.F for further explanation.)
Table III.C1. Estimated OASDI and HI Income Excluding Interest, Outgo, and Balance as a Percentage of GDP by Alternative, Calendar Years 1997-2071 | ||||||||||||
|
Calendar year |
Percentage of GDP |
GDP in dollars (billions) | ||||||||||
|
OASDI |
HI |
Combined | ||||||||||
|
In- come 1/ |
Out- go |
Bal- ance |
In- come 1/ |
Out- go |
Bal- ance |
In- come 1/ |
Out- go |
Bal- ance | ||||
| Intermediate: | ||||||||||||
| 1997 | 5.12 | 4.66 | 0.46 | 1.48 | 1.76 | -0.28 | 6.60 | 6.41 | 0.19 | $7,963 | ||
| 1998 | 5.05 | 4.65 | .40 | 1.46 | 1.81 | -.35 | 6.51 | 6.46 | .05 | 8,365 | ||
| 1999 | 5.02 | 4.65 | .37 | 1.46 | 1.86 | -.40 | 6.48 | 6.52 | -.04 | 8,796 | ||
| 2000 | 5.00 | 4.65 | .35 | 1.46 | 1.92 | -.46 | 6.46 | 6.57 | -.11 | 9,256 | ||
| 2001 | 5.00 | 4.66 | .34 | 1.46 | 1.97 | -.51 | 6.46 | 6.63 | -.18 | 9,748 | ||
| 2002 | 4.99 | 4.67 | .32 | 1.46 | 2.03 | -.57 | 6.45 | 6.70 | -.25 | 10,273 | ||
| 2003 | 4.98 | 4.68 | .30 | 1.46 | 2.08 | -.62 | 6.44 | 6.76 | -.32 | 10,825 | ||
| 2004 | 4.97 | 4.69 | .27 | 1.46 | 2.13 | -.67 | 6.43 | 6.83 | -.40 | 11,408 | ||
| 2005 | 4.97 | 4.71 | .26 | 1.46 | 2.18 | -.72 | 6.43 | 6.89 | -.46 | 12,024 | ||
| 2006 | 4.96 | 4.72 | .24 | 1.46 | 2.23 | -.77 | 6.42 | 6.95 | -.53 | 12,678 | ||
| 2010 | 4.96 | 4.87 | .08 | 1.47 | 2.43 | -.97 | 6.42 | 7.30 | -.88 | 15,587 | ||
| 2015 | 4.94 | 5.27 | -.32 | 1.48 | 2.77 | -1.29 | 6.42 | 8.04 | -1.62 | 19,886 | ||
| 2020 | 4.94 | 5.80 | -.87 | 1.49 | 3.18 | -1.69 | 6.43 | 8.99 | -2.56 | 25,111 | ||
| 2025 | 4.92 | 6.27 | -1.35 | 1.50 | 3.61 | -2.10 | 6.43 | 9.88 | -3.45 | 31,542 | ||
| 2030 | 4.91 | 6.57 | -1.66 | 1.51 | 4.01 | -2.50 | 6.41 | 10.57 | -4.16 | 39,835 | ||
| 2035 | 4.88 | 6.64 | -1.76 | 1.51 | 4.31 | -2.80 | 6.39 | 10.95 | -4.56 | 50,507 | ||
| 2040 | 4.84 | 6.56 | -1.72 | 1.50 | 4.49 | -2.99 | 6.34 | 11.05 | -4.70 | 64,037 | ||
| 2045 | 4.80 | 6.50 | -1.69 | 1.49 | 4.59 | -3.10 | 6.30 | 11.08 | -4.79 | 80,902 | ||
| 2050 | 4.77 | 6.50 | -1.73 | 1.49 | 4.63 | -3.15 | 6.25 | 11.13 | -4.88 | 101,948 | ||
| 2055 | 4.73 | 6.58 | -1.84 | 1.48 | 4.67 | -3.19 | 6.21 | 11.25 | -5.03 | 128,296 | ||
| 2060 | 4.70 | 6.64 | -1.95 | 1.48 | 4.74 | -3.27 | 6.18 | 11.39 | -5.21 | 161,494 | ||
| 2065 | 4.66 | 6.67 | -2.01 | 1.47 | 4.84 | -3.37 | 6.13 | 11.51 | -5.38 | 203,431 | ||
| 2070 | 4.62 | 6.68 | -2.05 | 1.46 | 4.96 | -3.50 | 6.09 | 11.64 | -5.55 | 256,211 | ||
| Summarized rates: 2/ | ||||||||||||
| 25-year: | ||||||||||||
| 1997-2021 | 5.34 | 5.20 | .14 | 1.55 | 2.51 | -.96 | 6.89 | 7.71 | -.82 | - | ||
| 50-year: | ||||||||||||
| 1997-2046 | 5.15 | 5.71 | -.56 | 1.53 | 3.16 | -1.63 | 6.68 | 8.88 | -2.19 | - | ||
| 75-year: | ||||||||||||
| 1997-2071 | 5.06 | 5.90 | -.84 | 1.52 | 3.50 | -1.99 | 6.57 | 9.40 | -2.83 | - | ||
| Low Cost: | ||||||||||||
| 1997 | 5.11 | 4.62 | .49 | 1.48 | 1.72 | -.25 | 6.59 | 6.35 | .24 | 8,004 | ||
| 1998 | 5.07 | 4.58 | .50 | 1.46 | 1.75 | -.29 | 6.53 | 6.33 | .21 | 8,422 | ||
| 1999 | 5.06 | 4.54 | .52 | 1.46 | 1.78 | -.32 | 6.52 | 6.32 | .20 | 8,853 | ||
| 2000 | 5.04 | 4.49 | .55 | 1.46 | 1.81 | -.35 | 6.50 | 6.30 | .20 | 9,304 | ||
| 2001 | 5.06 | 4.46 | .59 | 1.46 | 1.84 | -.38 | 6.51 | 6.30 | .22 | 9,775 | ||
| 2002 | 5.05 | 4.43 | .62 | 1.46 | 1.86 | -.40 | 6.51 | 6.29 | .22 | 10,270 | ||
| 2003 | 5.05 | 4.39 | .66 | 1.46 | 1.88 | -.42 | 6.51 | 6.28 | .24 | 10,787 | ||
| 2004 | 5.05 | 4.37 | .68 | 1.46 | 1.91 | -.45 | 6.51 | 6.28 | .23 | 11,323 | ||
| 2005 | 5.06 | 4.35 | .71 | 1.46 | 1.92 | -.46 | 6.52 | 6.28 | .25 | 11,887 | ||
| 2006 | 5.06 | 4.34 | .72 | 1.46 | 1.94 | -.47 | 6.52 | 6.27 | .25 | 12,480 | ||
| 2010 | 5.08 | 4.42 | .65 | 1.47 | 2.01 | -.54 | 6.55 | 6.43 | .12 | 15,031 | ||
| 2015 | 5.08 | 4.77 | .31 | 1.48 | 2.14 | -.65 | 6.57 | 6.91 | -.35 | 18,677 | ||
| 2020 | 5.09 | 5.24 | -.15 | 1.50 | 2.30 | -.80 | 6.59 | 7.54 | -.95 | 23,039 | ||
| 2025 | 5.10 | 5.62 | -.52 | 1.51 | 2.39 | -.88 | 6.61 | 8.01 | -1.40 | 28,374 | ||
| 2030 | 5.09 | 5.80 | -.71 | 1.52 | 2.47 | -.95 | 6.61 | 8.27 | -1.66 | 35,284 | ||
| 2035 | 5.08 | 5.76 | -.68 | 1.52 | 2.52 | -1.00 | 6.60 | 8.28 | -1.68 | 44,184 | ||
| 2040 | 5.06 | 5.57 | -.51 | 1.52 | 2.55 | -1.03 | 6.57 | 8.12 | -1.54 | 55,466 | ||
| 2045 | 5.03 | 5.41 | -.38 | 1.51 | 2.58 | -1.07 | 6.55 | 7.99 | -1.45 | 69,499 | ||
| 2050 | 5.01 | 5.32 | -.31 | 1.51 | 2.62 | -1.11 | 6.52 | 7.93 | -1.41 | 87,000 | ||
| 2055 | 4.99 | 5.29 | -.29 | 1.51 | 2.64 | -1.14 | 6.50 | 7.93 | -1.43 | 108,973 | ||
| 2060 | 4.97 | 5.24 | -.27 | 1.50 | 2.70 | -1.19 | 6.48 | 7.94 | -1.46 | 136,734 | ||
| 2065 | 4.95 | 5.16 | -.21 | 1.50 | 2.77 | -1.27 | 6.45 | 7.93 | -1.48 | 171,770 | ||
| 2070 | 4.93 | 5.10 | -.17 | 1.49 | 2.85 | -1.36 | 6.42 | 7.95 | -1.53 | 215,706 | ||
| Summarized rates: 2/ | ||||||||||||
| 25-year: | ||||||||||||
| 1997-2021 | 5.44 | 4.81 | .63 | 1.55 | 2.07 | -.52 | 6.99 | 6.88 | .11 | - | ||
| 50-year: | ||||||||||||
| 1997-2046 | 5.29 | 5.13 | .17 | 1.54 | 2.23 | -.69 | 6.83 | 7.36 | -.52 | - | ||
| 75-year: | ||||||||||||
| 1997-2071 | 5.22 | 5.14 | .08 | 1.53 | 2.33 | -.80 | 6.75 | 7.47 | -.72 | - | ||
| High Cost: | ||||||||||||
| 1997 | 5.13 | 4.70 | .43 | 1.48 | 1.82 | -.34 | 6.61 | 6.52 | .09 | 7,922 | ||
| 1998 | 5.05 | 4.84 | .21 | 1.46 | 1.93 | -.47 | 6.51 | 6.76 | -.25 | 8,159 | ||
| 1999 | 4.98 | 4.76 | .22 | 1.45 | 1.99 | -.53 | 6.43 | 6.75 | -.32 | 8,801 | ||
| 2000 | 4.97 | 4.80 | .16 | 1.46 | 2.06 | -.60 | 6.42 | 6.86 | -.44 | 9,416 | ||
| 2001 | 4.96 | 5.08 | -.12 | 1.45 | 2.20 | -.74 | 6.41 | 7.27 | -.86 | 9,661 | ||
| 2002 | 4.91 | 5.06 | -.15 | 1.45 | 2.26 | -.81 | 6.36 | 7.32 | -.96 | 10,371 | ||
| 2003 | 4.90 | 5.05 | -.16 | 1.45 | 2.35 | -.90 | 6.35 | 7.40 | -1.05 | 11,072 | ||
| 2004 | 4.90 | 5.10 | -.19 | 1.45 | 2.44 | -.99 | 6.36 | 7.54 | -1.18 | 11,739 | ||
| 2005 | 4.90 | 5.14 | -.23 | 1.45 | 2.53 | -1.07 | 6.36 | 7.66 | -1.31 | 12,444 | ||
| 2006 | 4.89 | 5.18 | -.29 | 1.46 | 2.62 | -1.16 | 6.34 | 7.80 | -1.46 | 13,184 | ||
| 2010 | 4.86 | 5.39 | -.53 | 1.46 | 3.03 | -1.57 | 6.32 | 8.42 | -2.10 | 16,515 | ||
| 2015 | 4.84 | 5.83 | -1.00 | 1.47 | 3.71 | -2.25 | 6.30 | 9.55 | -3.24 | 21,595 | ||
| 2020 | 4.81 | 6.45 | -1.63 | 1.48 | 4.61 | -3.13 | 6.29 | 11.06 | -4.77 | 27,885 | ||
| 2025 | 4.79 | 7.04 | -2.25 | 1.49 | 5.70 | -4.21 | 6.28 | 12.73 | -6.46 | 35,705 | ||
| 2030 | 4.76 | 7.49 | -2.74 | 1.50 | 6.78 | -5.28 | 6.25 | 14.27 | -8.02 | 45,785 | ||
| 2035 | 4.72 | 7.75 | -3.03 | 1.50 | 7.67 | -6.17 | 6.22 | 15.42 | -9.20 | 58,766 | ||
| 2040 | 4.67 | 7.86 | -3.18 | 1.49 | 8.21 | -6.72 | 6.16 | 16.07 | -9.90 | 75,159 | ||
| 2045 | 4.63 | 7.99 | -3.36 | 1.48 | 8.46 | -6.98 | 6.11 | 16.45 | -10.34 | 95,576 | ||
| 2050 | 4.58 | 8.19 | -3.61 | 1.48 | 8.50 | -7.02 | 6.06 | 16.69 | -10.63 | 121,007 | ||
| 2055 | 4.54 | 8.48 | -3.94 | 1.48 | 8.51 | -7.03 | 6.02 | 16.99 | -10.97 | 152,668 | ||
| 2060 | 4.50 | 8.77 | -4.27 | 1.47 | 8.60 | -7.12 | 5.98 | 17.37 | -11.39 | 192,292 | ||
| 2065 | 4.46 | 9.02 | -4.55 | 1.47 | 8.74 | -7.27 | 5.93 | 17.75 | -11.82 | 242,110 | ||
| 2070 | 4.42 | 9.22 | -4.80 | 1.46 | 8.92 | -7.46 | 5.88 | 18.14 | -12.26 | 304,698 | ||
| Summarized rates: 2/ | ||||||||||||
| 25-year: | ||||||||||||
| 1997-2021 | 5.26 | 5.68 | -.42 | 1.54 | 3.17 | -1.63 | 6.80 | 8.85 | -2.05 | - | ||
| 50-year: | ||||||||||||
| 1997-2046 | 5.04 | 6.46 | -1.42 | 1.52 | 4.85 | -3.33 | 6.56 | 11.31 | -4.75 | - | ||
| 75-year: | ||||||||||||
| 1997-2071 | 4.92 | 6.94 | -2.01 | 1.51 | 5.67 | -4.16 | 6.43 | 12.61 | -6.17 | - | ||
| 1 Income excludes interest on the trust funds. 2 Summarized rates are calculated on the present-value basis including the value of the trust funds on January 1, 1997 and the cost of reaching and maintaining a target trust fund level equal to 100 percent of annual expenditures by the end of the period. Note: Totals do not necessarily equal the sums of rounded components. | ||||||||||||
The difference between trust fund operations expressed as percentages of
taxable payroll and those expressed as percentages of GDP can
be seen by analyzing the estimated ratios of OASDI taxable payroll to
GDP, which are presented in table III.C2. HI taxable payroll is about
20 percent larger than the OASDI taxable payroll throughout the
long-range period (see appendix A for a detailed description of the difference).
The cost as a percentage of GDP is approximately equal to
the cost as a percentage of taxable payroll multiplied by the ratio of
taxable payroll to GDP.
Table III.C2.
Ratio of OASDI Taxable Payroll to GDP by Alternative,
| |||
| Calendar year | Intermediate | Low Cost | High Cost |
| 1997 | 0.405 | 0.406 | 0.405 |
| 1998 | .400 | .403 | .400 |
| 1999 | .398 | .402 | .395 |
| 2000 | .397 | .401 | .393 |
| 2001 | .396 | .401 | .392 |
| 2002 | .395 | .401 | .389 |
| 2003 | .394 | .401 | .387 |
| 2004 | .394 | .401 | .388 |
| 2005 | .393 | .401 | .387 |
| 2006 | .393 | .401 | .386 |
| 2010 | .391 | .401 | .382 |
| 2015 | .387 | .400 | .376 |
| 2020 | .383 | .398 | .371 |
| 2025 | .380 | .396 | .366 |
| 2030 | .376 | .394 | .360 |
| 2035 | .372 | .392 | .355 |
| 2040 | .369 | .390 | .350 |
| 2045 | .365 | .388 | .345 |
| 2050 | .362 | .386 | .340 |
| 2055 | .358 | .384 | .335 |
| 2060 | .355 | .383 | .331 |
| 2065 | .351 | .381 | .326 |
| 2070 | .348 | .379 | .321 |
| 2075 | .345 | .377 | .317 |
Projections of GDP for the first several years were based on assumed
quarterly changes in real GDP and the GDP implicit price deflator.
Thereafter, projections of GDP were based on the projected increases
in U.S. employment, labor productivity, and the GDP implicit price
deflator. Productivity projections are consistent with assumed
changes in the level of average earnings, the ratio of earnings to
worker compensation, the ratio of worker compensation to GDP, and
average hours worked per year (see section II.H).
Projections of taxable payroll, which are described in detail in section II.H, were based on the projected increases in covered employment and average taxable earnings. Therefore, the projected increases in taxable payroll differ from projected increases in GDP primarily to the extent that average taxable earnings are assumed to increase more slowly than is productivity and to the extent that OASDI program coverage of employment changes over time.
The long-range trend in the ratio of taxable payroll to GDP reflects the assumed trend in the ratio of wages to total employee compensation -- i.e., wages plus fringe benefits. The ratio of wages to total employee compensation declined at average annual rates of 0.36 percent for the 40 years 1956-95 and 0.31, 0.60, 0.40, and 0.12 percent for the 10-year periods 1956-65, 1966-75, 1976-85, and 1986-95, respectively. Ultimate future annual rates of decline in the ratio of wages to employee compensation are assumed to be 0.1, 0.2, and 0.3 percent for alternatives I, II, and III, respectively. An additional factor that has made the overall ratio of taxable payroll to GDP decline in recent years is the decline in the ratio of taxable earnings to covered earnings, as a result the relatively greater increases in earnings for persons with earnings above the benefit and contribution base. This decline in the taxable ratio is assumed to continue at a slower pace through the end of this century.
Between 1983 and 2015, however, the tendency toward decreases in the ratio of taxable payroll to GDP, discussed above, is at least partially offset by the gradually expanding OASDI coverage of Federal civilian employment resulting from the 1983 amendments.
For the low cost alternative I, the ratio of taxable payroll to GDP is projected to be nearly constant through the year 2010, and then to decrease for the remainder of the long-range period. For the intermediate and high cost alternatives, the ratio of taxable payroll to GDP is projected to decrease essentially throughout the long-range period.
In 1973, when the average-cost method was first used, the long-range financing of the program was more nearly on a pay-as-you-go basis. Also, based on the long-range economic and demographic assumptions then being used, the annual rate of growth in taxable payroll was about the same as the annual rate at which the trust funds earned interest. In either situation (i.e., pay-as-you-go financing, where the annual income rate is the same as the annual cost rate, or an annual rate of growth in taxable payroll equal to the annual interest rate), the average-cost method produces the same result as the present-value method. However, by 1988, neither of these situations still existed.
As a result of legislation enacted in 1977 and in 1983, substantial increases in the trust funds were estimated to occur well into the next century, so that the program was partially "advance funded," rather than being funded on a pay-as-you-go basis. Also, because of declines in long-range fertility rates and average real-wage growth that were assumed in the annual reports over the period 1973-87, the annual rate of growth in taxable earnings assumed for the long range became significantly lower than the assumed interest rate. Therefore, during the period 1973-87, the results of the average-cost method and the present-value method began to diverge, and by 1988 they were quite different. While the average-cost method still accounted for most of the effects of the assumed interest rate, it no longer accounted for all of the interest effects. The present-value method, of course, does account for the full effect of the assumed interest rates. So, in 1988, the present-value method of calculating the actuarial balance was resumed.
A positive actuarial balance indicates that estimated income is more than sufficient to meet estimated trust fund obligations for the period as a whole. A negative actuarial balance indicates that estimated income is insufficient to meet estimated trust fund obligations for the entire period. An actuarial balance of zero indicates that the estimated income exactly matches estimated trust fund obligations for the period.
Table III.D1 shows the estimated OASDI actuarial balances, as well
as the summarized income and cost rates, for the last 10 annual
reports (1987-96), along with the estimates for the current report. The
values shown are based on the intermediate alternative II assumptions,
or alternative II-B for years prior to 1991.
Table III.D1. Long-Range Actuarial Balances for the OASDI Program as Shown for the Intermediate Assumptions 1/ in the Trustees' Reports Issued in Years 1987-97[As a percentage of taxable payroll] | ||||
| Year of report |
Summarized income rate |
Summarized cost rate |
Actuarial balance |
Change from previous year |
| 1987 | 12.89 | 13.51 | -0.62 | -0.18 |
| 1988 | 12.94 | 13.52 | -.58 | +.04 |
| 1989 | 13.02 | 13.72 | -.70 | -.13 |
| 1990 | 13.04 | 13.95 | -.91 | -.21 |
| 1991 | 13.11 | 14.19 | -1.08 | -.17 |
| 1992 | 13.16 | 14.63 | -1.46 | -.38 |
| 1993 | 13.21 | 14.67 | -1.46 | -.00 |
| 1994 | 13.24 | 15.37 | -2.13 | -.66 |
| 1995 | 13.27 | 15.44 | -2.17 | -.04 |
| 1996 | 13.33 | 15.52 | -2.19 | -.02 |
| 1997 | 13.37 | 15.60 | -2.23 | -.03 |
| 1 Values shown are based on the intermediate alternative II assumptions for 1991-97, and on the intermediate alternative II-B assumptions for 1987-90. Note: Totals do not necessarily equal the sums of rounded components. | ||||
Rebenchmarking of the National Income and Product Accounts, and
changes in demographic assumptions contributed to the change in
actuarial balance for 1987. Various changes in assumptions and
methods for the 1988 report had roughly offsetting effects on the actuarial
balance. In 1989 and 1990, changes in economic assumptions
accounted for most of the changes in the estimated actuarial balance.
In 1991, the effect of legislation, changes in economic assumptions,
and the introduction of the cost of reaching and maintaining an ending
trust fund target combined to produce the change in actuarial balance.
In 1992, changes in disability assumptions and the method for
projecting average benefit levels accounted for most of the change in
the actuarial balance. In 1993, numerous small changes in assumptions
and methods had offsetting effects on the actuarial balance. In
1994, changes in the real-wage assumption, disability rates, and the
earnings sample used for projecting average benefit levels accounted
for most of the change in the actuarial balance. In 1995, numerous
small changes had largely offsetting effects on the actuarial balance,
including a substantial reallocation of the payroll tax rate, which
reduced the OASI actuarial balance, but increased the DI actuarial
balance. In 1996, a change in the method of projecting dually entitled
beneficiaries produced a large increase in the actuarial balance, which
almost totally offset decreases produced by changes in the valuation
period and in the economic and demographic assumptions. Changes
affecting the actuarial balance shown for the 1997 report are
described in section II.F2g.
On December 31, 1996, about 782,000 persons were receiving monthly
benefits from the OASI Trust Fund because of their disabilities or the
disabilities of children. This total includes 43,000 mothers and fathers
(wives or husbands under age 65 of retired-worker beneficiaries and
widows or widowers of deceased insured workers) who met all other
qualifying requirements and were receiving unreduced benefits solely
because they had disabled-child beneficiaries (or disabled children
aged 16 or 17) in their care. Benefits paid from this trust fund to the
persons described above totaled $4,410 million in calendar year 1996.
Table III.E1 shows these and similar figures for selected calendar
years during 1960-96, and estimated experience for 1997-2006 based
on the intermediate set of assumptions.
Table III.E1. Benefit
Disbursements From the OASI Trust Fund With Respect
to
[Beneficiaries in thousands; benefit payments in millions] | |||||||
|
Calendar years |
Disabled beneficiaries, end of year |
Amount of benefit payments 1/ | |||||
| Total | Children 2/ |
Widows- widowers 3/ |
Total | Children 2/ |
Widows- widowers 4/ | ||
| Historical data: | |||||||
| 1960 | 117 | 117 | - | $59 | $59 | - | |
| 1965 | 214 | 214 | - | 134 | 134 | - | |
| 1970 | 316 | 281 | 36 | 301 | 260 | $41 | |
| 1975 | 435 | 376 | 58 | 664 | 560 | 104 | |
| 1980 | 519 | 460 | 59 | 1,223 | 1,097 | 126 | |
| 1985 | 594 | 547 | 47 | 2,072 | 1,885 | 187 | |
| 1986 | 614 | 565 | 49 | 2,219 | 2,022 | 197 | |
| 1987 | 629 | 580 | 49 | 2,331 | 2,128 | 203 | |
| 1988 | 633 | 584 | 49 | 2,518 | 2,307 | 211 | |
| 1989 | 651 | 602 | 49 | 2,680 | 2,459 | 221 | |
| 1990 | 662 | 613 | 49 | 2,882 | 2,649 | 233 | |
| 1991 | 687 | 627 | 61 | 3,179 | 2,875 | 304 | |
| 1992 | 715 | 643 | 72 | 3,459 | 3,079 | 380 | |
| 1993 | 740 | 659 | 81 | 3,752 | 3,296 | 456 | |
| 1994 | 758 | 671 | 86 | 3,973 | 3,481 | 492 | |
| 1995 | 772 | 681 | 91 | 4,202 | 3,672 | 531 | |
| 1996 | 782 | 687 | 94 | 4,410 | 3,846 | 565 | |
| Estimates: | |||||||
| 1997 | 803 | 701 | 101 | 4,684 | 4,061 | 623 | |
| 1998 | 816 | 715 | 100 | 4,935 | 4,283 | 651 | |
| 1999 | 828 | 729 | 99 | 5,214 | 4,546 | 668 | |
| 2000 | 841 | 743 | 98 | 5,501 | 4,819 | 682 | |
| 2001 | 852 | 756 | 96 | 5,796 | 5,103 | 693 | |
| 2002 | 862 | 769 | 93 | 6,105 | 5,406 | 700 | |
| 2003 | 871 | 782 | 90 | 6,422 | 5,718 | 704 | |
| 2004 | 880 | 794 | 87 | 6,758 | 6,048 | 710 | |
| 2005 | 889 | 805 | 84 | 7,101 | 6,384 | 717 | |
| 2006 | 896 | 816 | 80 | 7,449 | 6,738 | 711 | |
| 1 Beginning in 1966, includes payments for vocational rehabilitation services. 2 Also includes certain mothers and fathers (see text). 3 In 1984 and later years, only disabled widows and widowers aged 50-59 are included because disabled widows and widowers aged 60-64 would be eligible for the same benefit as a nondisabled aged widow or widower; therefore, they are not receiving benefits solely because of a disability. 4 In 1983 and prior years, reflects the offsetting effect of lower benefits payable to disabled widows and widowers who continue to receive benefits after attaining age 60 (62, for disabled widowers, prior to 1973) as compared to the higher nondisabled widow's and widower's benefits that would otherwise be payable. In 1984 and later years, only benefit payments to disabled widows and widowers aged 50-59 are included (see footnote 3). Note: Totals do not necessarily equal the sums of rounded components. | |||||||
Total benefit payments from the OASI Trust Fund with respect to disabled
beneficiaries are estimated to increase from $4,684 million in
calendar year 1997 to $7,449 million in calendar year 2006, based on
the intermediate assumptions.
In calendar year 1996, benefit payments (including expenditures for
vocational rehabilitation services) with respect to disabled persons
from the OASI Trust Fund and from the DI Trust Fund (including
payments from the latter fund to all children and spouses of disabled-worker
beneficiaries) totaled $48,615 million. Of this amount, $4,410
million or 9.1 percent represented payments from the OASI Trust
Fund. These and similar figures for selected calendar years during
1960-96 and estimates for calendar years 1997-2006 are presented in
table III.E2.
Table III.E2. Benefit
Disbursements Under the OASDI Program With Respect to
[Amounts in millions] | |||||||
|
Calendar years |
Total 1/ |
DI Trust Fund 2/ |
OASI Trust Fund | ||||
| Amount 3/ |
Percentage of total | ||||||
| Historical data: | |||||||
| 1960 | $627 | $568 | $59 | 9.4 | |||
| 1965 | 1,707 | 1,573 | 134 | 7.9 | |||
| 1970 | 3,386 | 3,085 | 301 | 8.9 | |||
| 1975 | 9,169 | 8,505 | 664 | 7.2 | |||
| 1980 | 16,738 | 15,515 | 1,223 | 7.3 | |||
| 1985 | 20,908 | 18,836 | 2,072 | 9.9 | |||
| 1986 | 22,075 | 19,856 | 2,219 | 10.1 | |||
| 1987 | 22,858 | 20,527 | 2,331 | 10.2 | |||
| 1988 | 24,226 | 21,708 | 2,518 | 10.4 | |||
| 1989 | 25,591 | 22,911 | 2,680 | 10.5 | |||
| 1990 | 27,717 | 24,835 | 2,882 | 10.4 | |||
| 1991 | 30,877 | 27,698 | 3,179 | 10.3 | |||
| 1992 | 34,583 | 31,124 | 3,459 | 10.0 | |||
| 1993 | 38,378 | 34,626 | 3,752 | 9.8 | |||
| 1994 | 41,730 | 37,757 | 3,973 | 9.5 | |||
| 1995 | 45,140 | 40,937 | 4,202 | 9.3 | |||
| 1996 | 48,615 | 44,205 | 4,410 | 9.1 | |||
| Estimates: | |||||||
| 1997 | 52,098 | 47,414 | 4,684 | 9.0 | |||
| 1998 | 55,861 | 50,927 | 4,935 | 8.8 | |||
| 1999 | 60,069 | 54,855 | 5,214 | 8.7 | |||
| 2000 | 64,182 | 58,681 | 5,501 | 8.6 | |||
| 2001 | 69,242 | 63,446 | 5,796 | 8.4 | |||
| 2002 | 74,837 | 68,732 | 6,105 | 8.2 | |||
| 2003 | 80,861 | 74,439 | 6,422 | 7.9 | |||
| 2004 | 87,733 | 80,975 | 6,758 | 7.7 | |||
| 2005 | 95,102 | 88,001 | 7,101 | 7.5 | |||
| 2006 | 102,837 | 95,388 | 7,449 | 7.2 | |||
|
1
Beginning in 1966, includes payments for vocational rehabilitation services.
2
Benefit payments to disabled workers and their children and spouses.
3
Benefit payments to disabled children aged 18 and over, to certain mothers
and fathers (see text), and to disabled widows and widowers (see footnote
4, table III.E1). Note: Totals do not necessarily equal the sums of rounded components. | |||||||
Office of the Commissioner
1997 Cost-of-Living Increase and Other Determinations
AGENCY:
Office of the Commissioner,ACTION: Notice.
(1) A 2.9 percent cost-of-living increase in Social Security benefits under title II of the Social Security Act (the Act), effective for December 1996;
(2) An increase in the Federal Supplemental Security Income (SSI) monthly benefit amounts under title XVI of the Act for 1997 to $484 for an eligible individual, $726 for an eligible individual with an eligible spouse, and $242 for an essential person;
(3) The national average wage index for 1995 to be $24,705.66;
(4) The Old-Age, Survivors, and Disability Insurance (OASDI) contribution and benefit base to be $65,400 for remuneration paid in 1997 and self-employment income earned in taxable years beginning in 1997;
(5) For beneficiaries under age 65, the monthly exempt amount under the Social Security retirement earnings test for taxable years ending in calendar year 1997 to be $720;
(6) The dollar amounts ("bend points") used in the benefit formula for workers who become eligible for benefits in 1997 and in the formula for computing maximum family benefits;
(7) The amount of earnings a person must have to be credited with a quarter of coverage in 1997 to be $670;
(8) The "old-law" contribution and benefit base to be $48,600 for 1997;
(9) The monthly amount of substantial gainful activity applicable to statutorily blind individuals in 1997 to be $1,000;
(10) The domestic worker coverage threshold to be $1,000 for 1997; and
(11) The OASDI fund ratio to be 139.9 percent for 1996.
FOR FURTHER INFORMATION CONTACT: Jeffrey L. Kunkel, Office of the Actuary, Social Security Administration, 6401 Security Boulevard, Baltimore, MD 21235, (410) 965-3013. A summary of the information in this announcement is available in a recorded message by telephoning (410) 965-3053. This telephone message will be updated to reflect changes to the cost-of-living benefit increase and other determinations. Information relating to this announcement is also available on the Social Security Administration's World Wide Web server -- http://www.ssa.gov/OACT/COLA/index.html.
SUPPLEMENTARY INFORMATION: The Commissioner is required by the Act to publish within 45 days after the close of the third calendar quarter of 1996 the benefit increase percentage and the revised table of "special minimum" benefits (section 215(i)(2)(D)). Also, the Commissioner is required to publish on or before November 1 the national average wage index for 1995 (section 215(a)(1)(D)), the OASDI fund ratio for 1996 (section 215(i)(2)(C)(ii)), the OASDI contribution and benefit base for 1997 (section 230(a)), the amount of earnings required to be credited with a quarter of coverage in 1997 (section 213(d)(2)), the monthly exempt amounts under the Social Security retirement earnings test for 1997 (section 203(f)(8)(A)), the formula for computing a primary insurance amount for workers who first become eligible for benefits or die in 1997 (section 215(a)(1)(D)), and the formula for computing the maximum amount of benefits payable to the family of a worker who first becomes eligible for old-age benefits or dies in 1997 (section 203(a)(2)(C)).
Cost-of-Living Increases
General. The cost-of-living increase is 2.9 percent for benefits under titles II and XVI of the Act.
Under title II, OASDI benefits will increase by 2.9 percent beginning with the December 1996 benefits, which are payable on January 3, 1997. This increase is based on the authority contained in section 215(i) of the Act (42 U.S.C. 415(i)).
Under title XVI, Federal SSI payment levels will also increase by 2.9 percent effective for payments made for the month of January 1997 but paid on December 31, 1996. This is based on the authority contained in section 1617 of the Act (42 U.S.C. 1382f). The percentage increase effective January 1997 is the same as the title II percentage increase and the annual payment amount is rounded, when not a multiple of $12, to the next lower multiple of $12.
Automatic Benefit Increase Computation. Under section 215(i) of the Act, the third calendar quarter of 1996 is a cost-of-living computation quarter for all the purposes of the Act. The Commissioner is, therefore, required to increase benefits, effective with December 1996, for individuals entitled under section 227 or 228 of the Act, to increase primary insurance amounts of all other individuals entitled under title II of the Act, and to increase maximum benefits payable to a family. For December 1996, the benefit increase is the percentage increase in the Consumer Price Index for Urban Wage Earners and Clerical Workers from the third quarter of 1995 through the third quarter of 1996.
Section 215(i)(1) of the Act provides that the Consumer Price Index for a cost-of-living computation quarter shall be the arithmetic mean of this index for the 3 months in that quarter. The arithmetic mean is rounded, if necessary, to the nearest 0.1. The Department of Labor's Consumer Price Index for Urban Wage Earners and Clerical Workers for each month in the quarter ending September 30, 1995, was: for July 1995, 149.9; for August 1995, 150.2; and for September 1995, 150.6. The arithmetic mean for this calendar quarter is 150.2. The corresponding Consumer Price Index for each month in the quarter ending September 30, 1996, was: for July 1996, 154.3; for August 1996, 154.5; and for September 1996, 155.1. The arithmetic mean for this calendar quarter is 154.6. Thus, because the Consumer Price Index for the calendar quarter ending September 30, 1996, exceeds that for the calendar quarter ending September 30, 1995 by 2.9 percent, a cost-of-living benefit increase of 2.9 percent is effective for benefits under title II of the Act beginning December 1996.
Title II Benefit Amounts. In accordance with section 215(i) of the Act, in the case of insured workers and family members for whom eligibility for benefits (i.e., the worker's attainment of age 62, or disability or death before age 62) occurred before 1997, benefits will increase by 2.9 percent beginning with benefits for December 1996 which are payable on January 3, 1997. In the case of first eligibility after 1996, the 2.9 percent increase will not apply.
For eligibility after 1978, benefits are generally determined by a benefit formula provided by the Social Security Amendments of 1977 (Pub. L. 95-216), as described later in this notice.
For eligibility before 1979, benefits are determined by means of a benefit table. A copy of this table may be obtained by writing to: Social Security Administration, Office of Public Inquiries, 4100 Annex, Baltimore, MD 21235.
Section 215(i)(2)(D) of the Act requires that,
when the Commissioner determines an automatic increase
in Social Security benefits, the
Commissioner shall publish in the Federal
Register a revision of the range of the primary
insurance amounts and corresponding maximum family benefits
based on the dollar
amount and other provisions described in section 215(a)(1)(C)(i).
These benefits are referred
to as "special minimum" benefits and are payable
to certain individuals with long periods of
relatively low earnings. To qualify for such benefits,
an individual must have at least 11
"years of coverage." To earn a year of coverage
for purposes of the special minimum, a person
must earn at least a certain proportion (25 percent
for years before 1991, and 15 percent for
years after 1990) of the "old-law" contribution
and benefit base. In accordance with section
215(a)(1)(C)(i), the table below shows the
revised range of primary insurance amounts
and corresponding maximum family benefit
amounts after the 2.9 percent benefit increase.
|
Special Minimum Primary Insurance Amounts and Maximum Family Benefits
| |||
|
Primary insurance amount payable for Dec. 1995 |
Number of years of coverage |
Primary insurance amount payable for Dec. 1996 |
Family benefit payable for Dec. 1996 |
| $26.40 | 11 | $27.10 | $40.90 |
| 52.80 | 12 | 54.30 | 82.10 |
| 79.70 | 13 | 82.00 | 123.30 |
| 106.20 | 14 | 109.20 | 164.30 |
| 132.80 | 15 | 136.60 | 205.00 |
| 159.50 | 16 | 164.10 | 246.70 |
| 186.20 | 17 | 191.50 | 287.90 |
| 212.90 | 18 | 219.00 | 328.90 |
| 239.50 | 19 | 246.40 | 370.10 |
| 266.00 | 20 | 273.70 | 411.10 |
| 293.00 | 21 | 301.40 | 452.50 |
| 319.40 | 22 | 328.60 | 493.60 |
| 346.30 | 23 | 356.30 | 535.30 |
| 373.00 | 24 | 383.80 | 576.20 |
| 399.60 | 25 | 411.10 | 617.00 |
| 426.50 | 26 | 438.80 | 658.90 |
| 453.10 | 27 | 466.20 | 699.90 |
| 479.60 | 28 | 493.50 | 740.80 |
| 506.20 | 29 | 520.80 | 782.10 |
| 532.90 | 30 | 548.30 | 823.00 |
Section 227 of the Act provides flat-rate benefits to a worker who became age 72 before 1969 and was not insured under the usual requirements, and to his or her spouse or surviving spouse. Section 228 of the Act provides similar benefits at age 72 for certain uninsured persons. The current monthly benefit amount of $193.40 for an individual under sections 227 and 228 of the Act is increased by 2.9 percent to obtain the new amount of $199.00. The present monthly benefit amount of $96.70 for a spouse under section 227 is increased by 2.9 percent to $99.50.
Title XVI Benefit Amounts. In accordance with section 1617 of the Act, Federal SSI benefit amounts for the aged, blind, and disabled are increased by 2.9 percent effective January 1997. Therefore, the yearly Federal SSI benefit amounts of $5,640 for an eligible individual, $8,460 for an eligible individual with an eligible spouse, and $2,820 for an essential person, which became effective January 1996, are increased, effective January 1997, to $5,808, $8,712, and $2,904, respectively, after rounding. The corresponding monthly amounts for 1997 are determined by dividing the yearly amounts by 12, giving $484, $726, and $242, respectively. The monthly amount is reduced by subtracting monthly countable income. In the case of an eligible individual with an eligible spouse, the amount payable is further divided equally between the two spouses.
Fee for Services Performed as a Representative Payee. Sections 205(j)(4)(A)(i) and 1631 (a)(2)(D)(i) of the Act permit a qualified organization to collect from an individual a monthly fee for expenses incurred in providing services performed as such individual's representative payee. Currently the fee is limited to the lesser of (1) 10 percent of the monthly benefit involved, or (2) $25 per month ($50 per month in any case in which the individual is entitled to disability benefits and the Commissioner has determined that payment to the representative payee would serve the interest of the individual because the individual has an alcoholism or drug addiction condition and is incapable of managing such benefits). The dollar fee limits are subject to increase by the automatic cost-of-living increase, with the resulting amounts rounded to the nearest whole dollar amount. The current amounts are thus increased by 2.9 percent to $26 and $51 for 1997.
National Average Wage Index for 1995
General. Under various provisions of the Act, several amounts are scheduled to increase automatically for 1997 based on the annual increase in the national average wage index. The amounts are (1) the OASDI contribution and benefit base, (2) the retirement test exempt amount for beneficiaries under age 65, (3) the dollar amounts, or "bend points," in the primary insurance amount and maximum family benefit formulas, (4) the amount of earnings required for a worker to be credited with a quarter of coverage, (5) the "old-law" contribution and benefit base (as determined under section 230 of the Act as in effect before the 1977 amendments), and (6) the substantial gainful activity amount applicable to statutorily blind individuals. Section 3121(x) of the Internal Revenue Code requires that the domestic employee coverage threshold be based on changes in the national average wage index. The threshold, however, does not increase for 1997.
Computation. The determination of the national average wage index for calendar year 1995 is based on the 1994 national average wage index of $23,753.53 announced in the Federal Register on October 25, 1995 (60 FR 54751), along with the percentage increase in average wages from 1994 to 1995 measured by annual wage data tabulated by the Social Security Administration (SSA). The wage data tabulated by SSA include contributions to deferred compensation plans, as required by section 209(k) of the Act. The average amounts of wages calculated directly from this data were $22,786.73 and $23,700.11 for 1994 and 1995, respectively. To determine the national average wage index for 1995 at a level that is consistent with the national average wage indexing series for 1951 through 1977 (published December 29, 1978, at 43 FR 61016), the 1994 national average wage index of $23,753.53 is multiplied by the percentage increase in average wages from 1994 to 1995 (based on SSA-tabulated wage data) as follows (with the result rounded to the nearest cent):
Amount. The national average wage index for 1995 is $23,753.53 times $23,700.11 divided by $22,786.73, which equals $24,705.66. Therefore, the national average wage index for calendar year 1995 is determined to be $24,705.66.
OASDI Contribution and Benefit Base
General. The OASDI contribution and benefit base is $65,400 for remuneration paid in 1997 and self-employment income earned in taxable years beginning in 1997.
The OASDI contribution and benefit base serves two purposes:
(a) It is the maximum annual amount of earnings on which OASDI taxes are paid. The OASDI tax rate for remuneration paid in 1997 is set by statute at 6.2 percent for employees and employers, each. The OASDI tax rate for self-employment income earned in taxable years beginning in 1997 is 12.4 percent. (The Hospital Insurance tax is due on remuneration, without limitation, paid in 1997, at the rate of 1.45 percent for employees and employers, each, and on self-employment income earned in taxable years beginning in 1997, at the rate of 2.9 percent.)
(b) It is the maximum annual amount used in determining a person's OASDI benefits.
Computation. Section 230(b) of the Act provides the formula used to determine the OASDI contribution and benefit base. Under the formula, the base for 1997 shall be equal to the larger of (1) the current base ($62,700) or (2) the 1994 base of $60,600 multiplied by the ratio of the national average wage index for 1995 to that for 1992. If the amount so determined is not a multiple of $300, it shall be rounded to the nearest multiple of $300.
Amount. The ratio of the national average wage index for 1995, $24,705.66 as determined above, compared to that for 1992, $22,935.42, is 1.0771837. Multiplying the 1994 OASDI contribution and benefit base amount of $60,600 by the ratio of 1.0771837 produces the amount of $65,277.33 which must then be rounded to $65,400. Because $65,400 exceeds the current base amount of $62,700, the OASDI contribution and benefit base is determined to be $65,400 for 1997.
Retirement Earnings Test Exempt Amounts
General. Social Security benefits are withheld when a beneficiary under age 70 has earnings in excess of the retirement earnings test exempt amount. Since 1978, higher exempt amounts have applied to beneficiaries aged 65 through 69 compared to those under age 65. Formulas for determining the monthly exempt amounts are provided in section 203(f)(8)(B) of the Act, as amended by section 102 of the "Senior Citizens' Right to Work Act of 1996," title I of Pub. L. 104-121. This amendment set the annual exempt amount for beneficiaries aged 65 through 69 to $12,500 for 1996, $13,500 for 1997, $14,500 for 1998, $15,500 for 1999, $17,000 for 2000, $25,000 for 2001, and $30,000 for 2002. The corresponding monthly exempt amounts are exactly one-twelfth of the annual amounts. After 2002, the monthly exempt amount for this group of beneficiaries will increase under the applicable formula.
For beneficiaries aged 65 through 69, $1 in benefits is withheld for every $3 of earnings in excess of the annual exempt amount. For beneficiaries under age 65, $1 in benefits is withheld for every $2 of earnings in excess of the annual exempt amount.
Computation. Under the formula in section 203(f)(8)(B) applicable to beneficiaries under age 65, the monthly exempt amount for 1997 shall be the larger of (1) the 1996 monthly exempt amount or (2) the 1994 monthly exempt amount multiplied by the ratio of the national average wage index for 1995 to that for 1992. The ratio of the national average wage index for 1995, $24,705.66 as determined above, compared to that for 1992, $22,935.42, is 1.0771837. Section 203(f)(8)(B) further provides that if the amount so determined is not a multiple of $10, it shall be rounded to the nearest multiple of $10.
Exempt Amount for Beneficiaries Under Age 65. Multiplying the 1994 retirement earnings test monthly exempt amount of $670 by the ratio 1.0771837 produces the amount of $721.71. This must then be rounded to $720. Because $720 is larger than the corresponding current exempt amount of $690, the retirement earnings test monthly exempt amount for beneficiaries under age 65 is thus determined to be $720 for 1997. The corresponding retirement earnings test annual exempt amount for these beneficiaries is $8,640.
Computing Benefits After 1978
General. The Social Security Amendments of 1977 provided a method for computing benefits which generally applies when a worker first becomes eligible for benefits after 1978. This method uses the worker's "average indexed monthly earnings" to compute the primary insurance amount. The computation formula is adjusted automatically each year to reflect changes in general wage levels, as measured by the national average wage index.
A worker's earnings are adjusted, or "indexed," to reflect the change in general wage levels that occurred during the worker's years of employment. Such indexation ensures that a worker's future benefits reflect the general rise in the standard of living that occurs during his or her working lifetime. A certain number of years of earnings are needed to compute the average indexed monthly earnings. After the number of years is determined, those years with the highest indexed earnings are chosen, the indexed earnings are summed, and the total amount is divided by the total number of months in those years. The resulting average amount is then rounded down to the next lower dollar amount. The result is the average indexed monthly earnings.
For example, to compute the average indexed monthly earnings for a worker attaining age 62, becoming disabled before age 62, or dying before attaining age 62, in 1997, the national average wage index for 1995, $24,705.66, is divided by the national average wage index for each year prior to 1995 in which the worker had earnings. The actual wages and self-employment income, as defined in section 211(b) of the Act and credited for each year, is multiplied by the corresponding ratio to obtain the worker's indexed earnings for each year before 1995. Any earnings in 1995 or later are considered at face value, without indexing. The average indexed monthly earnings is then computed and used to determine the worker's primary insurance amount for 1997.
Computing the Primary Insurance Amount. The primary insurance amount is the sum of three separate percentages of portions of the average indexed monthly earnings. In 1979 (the first year the formula was in effect), these portions were the first $180, the amount between $180 and $1,085, and the amount over $1,085. The dollar amounts in the formula which govern the portions of the average indexed monthly earnings are frequently referred to as the "bend points" of the formula. Thus, the bend points for 1979 were $180 and $1,085.
The bend points for 1997 are obtained by multiplying the corresponding 1979 bend-point amounts by the ratio between the national average wage index for 1995, $24,705.66, and for 1977, $9,779.44. These results are then rounded to the nearest dollar. For 1997, the ratio is 2.5262858. Multiplying the 1979 amounts of $180 and $1,085 by 2.5262858 produces the amounts of $454.73 and $2,741.02. These must then be rounded to $455 and $2,741. Accordingly, the portions of the average indexed monthly earnings to be used in 1997 are determined to be the first $455, the amount between $455 and $2,741, and the amount over $2,741.
Consequently, for individuals who first become eligible for old-age insurance benefits or disability insurance benefits in 1997, or who die in 1997 before becoming eligible for benefits, their primary insurance amount will be the sum of:
(a) 90 percent of the first $455 of their average indexed monthly earnings, plus
(b) 32 percent of the average indexed monthly earnings over $455 and through $2,741, plus
(c) 15 percent of the average indexed monthly earnings over $2,741.
This amount is then rounded to the next lower multiple of $.10 if it is not already a multiple of $.10. This formula and the rounding adjustment described above are contained in section 215(a) of the Act (42 U.S.C. 415(a)).
Maximum Benefits Payable to a Family
General. The 1977 amendments continue the long established policy of limiting the total monthly benefits which a worker's family may receive based on his or her primary insurance amount. Those amendments also continued the then existing relationship between maximum family benefits and primary insurance amounts but did change the method of computing the maximum amount of benefits which may be paid to a worker's family. The Social Security Disability Amendments of 1980 (Pub. L. 96-265) established a formula for computing the maximum benefits payable to the family of a disabled worker. This formula is applied to the family benefits of workers who first become entitled to disability insurance benefits after June 30, 1980, and who first become eligible for these benefits after 1978. For disabled workers initially entitled to disability benefits before July 1980, or whose disability began before 1979, the family maximum payable is computed the same as the old-age and survivor family maximum.
Computing the Old-Age and Survivor Family Maximum. The formula used to compute the family maximum is similar to that used to compute the primary insurance amount. It involves computing the sum of four separate percentages of portions of the worker's primary insurance amount. In 1979, these portions were the first $230, the amount between $230 and $332, the amount between $332 and $433, and the amount over $433. The dollar amounts in the formula which govern the portions of the primary insurance amount are frequently referred to as the "bend points" of the family-maximum formula. Thus, the bend points for 1979 were $230, $332, and $433.
The bend points for 1997 are obtained by multiplying the corresponding 1979 bend-point amounts by the ratio between the national average wage index for 1995, $24,705.66, and the average for 1977, $9,779.44. This amount is then rounded to the nearest dollar. For 1997, the ratio is 2.5262858. Multiplying the amounts of $230, $332, and $433 by 2.5262858 produces the amounts of $581.05, $838.73, and $1,093.88. These amounts are then rounded to $581, $839, and $1,094. Accordingly, the portions of the primary insurance amounts to be used in 1997 are determined to be the first $581, the amount between $581 and $839, the amount between $839 and $1,094, and the amount over $1,094.
Consequently, for the family of a worker who becomes age 62 or dies in 1997 before age 62, the total amount of benefits payable to them will be computed so that it does not exceed:
(a) 150 percent of the first $581 of the worker's primary insurance amount, plus
(b) 272 percent of the worker's primary insurance amount over $581 through $839, plus
(c) 134 percent of the worker's primary insurance amount over $839 through $1,094, plus
(d) 175 percent of the worker's primary insurance amount over $1,094.
This amount is then rounded to the next lower multiple of $.10 if it is not already a multiple of $.10. This formula and the rounding adjustment described above are contained in section 203(a) of the Act (42 U.S.C. 403(a)).
Quarter of Coverage Amount
General. The 1997 amount of earnings required for a quarter of coverage is $670. A quarter of coverage is the basic unit for determining whether a worker is insured under the Social Security program. For years before 1978, an individual generally was credited with a quarter of coverage for each quarter in which wages of $50 or more were paid, or an individual was credited with 4 quarters of coverage for every taxable year in which $400 or more of self-employment income was earned. Beginning in 1978, wages generally are no longer reported on a quarterly basis; instead, annual reports are made. With the change to annual reporting, section 352(b) of the Social Security Amendments of 1977 amended section 213(d) of the Act to provide that a quarter of coverage would be credited for each $250 of an individual's total wages and self-employment income for calendar year 1978 (up to a maximum of 4 quarters of coverage for the year).
Computation. Under the prescribed formula, the quarter of coverage amount for 1997 shall be equal to the larger of (1) the current amount of $640 or (2) the 1978 amount of $250 multiplied by the ratio of the national average wage index for 1995 to that for 1976. The national average wage index for 1976 was previously determined to be $9,226.48. The average wage index for 1995 is $24,705.66 as determined above. Section 213(d) further provides that if the amount so determined is not a multiple of $10, it shall be rounded to the nearest multiple of $10.
Quarter of Coverage Amount. The ratio of the national average wage index for 1995, $24,705.66, compared to that for 1976, $9,226.48, is 2.6776907. Multiplying the 1978 quarter of coverage amount of $250 by the ratio of 2.6776907 produces the amount of $669.42, which must then be rounded to $670. Because $670 exceeds the current amount of $640, the quarter of coverage amount is determined to be $670 for 1997.
"Old-Law" Contribution and Benefit Base
General. The 1997 "old-law" contribution and benefit base is $48,600. This is the base that would have been effective under the Act without the enactment of the 1977 amendments.
The base is computed under section 230(b) of the Act as it read prior to the 1977 amendments.
The "old-law" contribution and benefit base is used by:
(a) the Railroad Retirement program to determine certain tax liabilities and tier II benefits payable under that program to supplement the tier I payments which correspond to basic Social Security benefits,
(b) the Pension Benefit Guaranty Corporation to determine the maximum amount of pension guaranteed under the Employee Retirement Income Security Act (as stated in section 230(d) of the Act),
(c) Social Security to determine a year of coverage in computing the special minimum benefit, as described earlier, and
(d) Social Security to determine a year of coverage (acquired whenever earnings equal or exceed 25 percent of the "old-law" base for this purpose only) in computing benefits for persons who are also eligible to receive pensions based on employment not covered under section 210 of the Act.
Computation. The base is computed using the automatic adjustment formula in section 230(b) of the Act as it read prior to the enactment of the 1977 amendments, but with the revised indexing formula introduced by section 321(g) of the "Social Security Independence and Program Improvements Act of 1994." Under the formula, the "old-law" contribution and benefit base shall be the larger of (1) the current "old-law" base ($46,500) or (2) the 1994 "old-law" base ($45,000) multiplied by the ratio of the national average wage index for 1995 to that for 1992. If the amount so determined is not a multiple of $300, it shall be rounded to the nearest multiple of $300.
Amount. The ratio of the national average wage index for 1995, $24,705.66 as determined above, compared to that for 1992, $22,935.42, is 1.0771837. Multiplying the 1994 "old-law" contribution and benefit base amount of $45,000 by the ratio of 1.0771837 produces the amount of $48,473.27 which must then be rounded to $48,600. Because $48,600 exceeds the current amount of $46,500, the "old-law" contribution and benefit base is determined to be $48,600 for 1997.
Substantial Gainful Activity Amount for Blind Individuals
General. A finding of disability under titles II and XVI of the Act requires that a person be unable to engage in substantial gainful activity (SGA). Under current regulations, a person who is not statutorily blind and is earning more than $500 a month (net of impairment-related work expenses) is ordinarily considered to be engaging in SGA. The Social Security Amendments of 1977 established a higher SGA amount for statutorily blind individuals by setting their monthly SGA amount to the monthly exempt amount for persons aged 65 through 69 under the retirement earnings test provisions of the Act. As mentioned earlier, section 102 of Pub. L. 104-121 increased the exempt amount for persons aged 65 through 69 to specific levels for 1996-2002. Section 102 further provided that the SGA amount for blind individuals be the same as it would have been if section 102 had not been enacted. Thus, the monthly SGA amount for blind individuals in 1996 is $960 -- the same as the monthly exempt amount for persons aged 65 through 69 promulgated in the Federal Register on October 25, 1995 (60 FR 54751).
Computation. Under the formula in section 203(f)(8)(B) in effect prior to the enactment of Pub. L. 104-121, the monthly SGA amount for statutorily blind individuals for 1997 shall be the larger of (1) such amount for 1996 or (2) such amount for 1994 multiplied by the ratio of the national average wage index for 1995 to that for 1992. The ratio of the national average wage index for 1995, $24,705.66 as determined above, compared to that for 1992, $22,935.42, is 1.0771837. Section 203(f)(8)(B) further provides that if the amount so determined is not a multiple of $10, it shall be rounded to the nearest multiple of $10.
SGA Amount for Statutorily Blind Individuals. Multiplying the 1994 monthly SGA amount for statutorily blind individuals of $930 by the ratio of 1.0771837 produces the amount of $1,001.78. This must then be rounded to $1,000. Because $1,000 is larger than the current amount of $960, the monthly SGA amount for statutorily blind individuals is determined to be $1,000 for 1997.
Domestic Employee Coverage Threshold
General. Section 2 of the "Social Security Domestic Employment Reform Act of 1994" (Pub. L. 103-387) increased the threshold for coverage of a domestic employee's wages paid per employer from $50 per calendar quarter to $1,000 in calendar year 1994. The statute holds the coverage threshold at the $1,000 level for 1995 and then increases the threshold in $100 increments for years after 1995. The formula for increasing the threshold is provided in section 3121(x) of the Internal Revenue Code.
Computation. Under the new formula, the domestic employee coverage threshold amount for 1997 shall be equal to the 1995 amount of $1,000 multiplied by the ratio of the national average wage index for 1995 to that for 1993. The national average wage index for 1993 was previously determined to be $23,132.67. The national average wage index for 1995 is $24,705.66 as determined above. If the amount so determined is not a multiple of $100, it shall be rounded to the next lower multiple of $100.
Domestic Employee Coverage Threshold Amount. The ratio of the national average wage index for 1995, $24,705.66, compared to that for 1993, $23,132.67, is 1.0679986. Multiplying the 1995 domestic employee coverage threshold amount of $1,000 by the ratio of 1.0679986 produces the amount of $1,068.00, which must then be rounded to $1,000. Accordingly, the domestic employee coverage threshold amount is determined to be $1,000 for 1997.
OASDI Fund Ratio
General. Section 215(i) of the Act provides for automatic cost-of-living increases in OASDI benefit amounts. This section also includes a "stabilizer" provision that can limit the automatic OASDI benefit increase under certain circumstances. If the combined assets of the OASI and DI Trust Funds, as a percentage of annual expenditures, are below a specified threshold, the automatic benefit increase is equal to the lesser of (1) the increase in the national average wage index or (2) the increase in prices. The threshold specified for the OASDI fund ratio is 20.0 percent for benefit increases for December of 1989 and later. The law also provides for subsequent "catch-up" benefit increases for beneficiaries whose previous benefit increases were affected by this provision. "Catch-up" benefit increases can occur only when trust fund assets exceed 32.0 percent of annual expenditures.
Computation. Section 215(i) specifies the computation and application of the OASDI fund ratio. The OASDI fund ratio for 1996 is the ratio of (1) the combined assets of the OASI and DI Trust Funds at the beginning of 1996 to (2) the estimated expenditures of the OASI and DI Trust Funds during 1996, excluding transfer payments between the OASI and DI Trust Funds, and reducing any transfers to the Railroad Retirement Account by any transfers from that account into either trust fund.
Ratio. The combined assets of the OASI and DI Trust Funds at the beginning of 1996 equaled $496,068 million, and the expenditures are estimated to be $354,615 million. Thus, the OASDI fund ratio for 1996 is 139.9 percent, which exceeds the applicable threshold of 20.0 percent. Therefore, the stabilizer provision does not affect the benefit increase for December 1996. Although the OASDI fund ratio exceeds the 32.0-percent threshold for potential "catch-up" benefit increases, no past benefit increase has been reduced under the stabilizer provision. Thus, no "catch-up" benefit increase is required.
(Catalog of Federal Domestic Assistance: Program Nos. 96.001 Social Security -- Disability Insurance; 96.002 Social Security -- Retirement Insurance; 96.003 Social Security -- Special Benefits for Persons Aged 72 and Over; 96.004 Social Security -- Survivors Insurance; 96.006 Supplemental Security Income.)
Dated: October 18, 1996
Shirley S. Chater,
Commissioner, Social Security
Administration
[FR Doc. 96-27414 Filed 10-24-96; 8:45am]
BILLING CODE 4190-29-M
Actuarial deficit.
A negative actuarial balance.Adjusted gross income -- AGI.
Amount of income potentially subject to Federal income taxation, before consideration of exemptions and deductions.Administrative expenses.
Expenses incurred by the, Social Security Administration, Department of Health and Human Services, and the Department of the Treasury in administering the OASDI program and the provisions of the Internal Revenue Code relating to the collection of contributions. Such administrative expenses are paid from the OASI and DI Trust Funds.Advance tax transfers.
Amounts representing the estimated total OASDI tax contributions for a given month. From May 1983 through November 1990, such amounts were credited to the OASI and DI Trust Funds at the beginning of each month. Reimbursements were made from the trust funds to the general fund of the Treasury for the associated loss of interest. Advance tax transfers are no longer made unless needed in order to pay benefits.Advisory Council on Social Security.
Prior to the enactment of the Social Security Independence and Program Improvements Act of 1994 (Public Law 103-296) on August 15, 1994, the Social Security Act required the appointment of an Advisory Council every 4 years to study and review the financial status of the OASDI and Medicare programs. The most recent Advisory Council was appointed on June 9, 1994; and its report on the financial status of the OASDI program was submitted on January 6, 1997. Under the provisions of Public Law 103-296, this is the last Advisory Council to be appointed.Alternatives I, II, or III.
See "Assumptions."Annual balance.
The difference between the income rate and the cost rate in a given year.Assets.
Treasury notes and bonds, other securities guaranteed by the Federal Government, certain Federally sponsored agency obligations, and cash, held by the trust funds for investment purposes.Assumptions.
Values relating to future trends in certain key factors which affect the balance in the trust funds. Demographic assumptions include fertility, mortality, net immigration, marriage, divorce, retirement patterns, disability incidence and termination rates, and changes in the labor force. Economic assumptions include unemployment, average earnings, inflation, interest rates, and productivity. Three sets of economic assumptions are presented in this report --
Automatic cost-of-living increase.
The annual increase in benefits, effective for December, reflecting the increase in the cost of living. The benefit increase equals the percentage increase in the Consumer Price Index for Urban Wage Earners and Clerical Workers measured from the average over July, August, and September of the preceding year to the average for the same 3 months in the current year. If the increase is less than one-tenth of 1 percent, when rounded, there is no automatic increase for the current year; the increase for the next year would reflect the increase in the cost of living over a 2-year period. See table II.E2. If the "stabilizer provision" applies, the increase may be less than the cost of living.Auxiliary beneficiary.
Monthly benefits payable to a spouse or child of a retired or disabled worker, or to a survivor of a deceased worker.Average indexed monthly earnings -- AIME.
The amount of earnings used in determining the primary insurance amount (PIA) for most workers who attain age 62, become disabled, or die after 1978. A worker's actual past earnings are adjusted by changes in the "average wage index," in order to bring them up to their approximately equivalent value at the time of retirement or other eligibility for benefits.Average wage index.
The average amount of total wages for each year after 1950, including wages in noncovered employment and wages in covered employment in excess of the OASDI contribution and benefit base. These amounts are used to index the earnings of most workers first becoming eligible for benefits in 1979 or later, and for automatic adjustments in the contribution and benefit base, bend points, earnings test exempt amounts, and other wage-indexed amounts. See tables II.E1, II.E2, and III.B1.Award.
An administrative determination that an individual is entitled to receive a specified type of OASDI benefit. Awards can represent not only new entrants to the benefit rolls but also persons already on the rolls who become entitled to a different type of benefit. Awards usually result in the immediate payment of benefits, although payments may be deferred or withheld depending on the individual's particular circumstances.Baby boom.
The period from the end of World War II through the mid-1960s marked by unusually high birth rates.Bend points.
The dollar amounts defining the AIME or PIA brackets in the benefit formulas. For the bend points for years 1979 and later, see table II.E3.Beneficiary.
A person who has been awarded benefits on the basis of his or her own or another's earnings record. The benefits may be either in current-payment status or withheld.Benefit award.
See "Award."Benefit payments.
The amounts disbursed for OASI and DI benefits by the Department of the Treasury in specified periods.Benefit termination.
See "Termination."Best estimate assumptions.
See "Assumptions."Board of Trustees.
A Board established by the Social Security Act to oversee the financial operations of the Federal Old-Age and Survivors Insurance Trust Fund and the Federal Disability Insurance Trust Fund. The Board is composed of six members, four of whom serve automatically by virtue of their positions in the Federal Government: the Secretary of the Treasury, who is the Managing Trustee, the Secretary of Labor, the Secretary of Health and Human Services, and the Commissioner of Social Security. The other two members are appointed by the President and confirmed by the Senate to serve as public representatives. Stephen G. Kellison and Marilyn Moon began serving 4-year terms on July 20, 1995. The Commissioner of Social Security became a member of the Board effective March 31, 1995, under Public Law 103-296, signed on August 15, 1994.Book value.
A bond's value between its price at purchase and its value at maturity. Book value is calculated as par value plus unamortized premium, if purchased at a price above its par value, or less unamortized discount, if purchased below par.COLA.
See "Automatic cost-of-living increase."Constant dollars.
One or more financial amounts adjusted by the CPI to a constant year as a reference point.Consumer Price Index -- CPI.
Relative measure of inflation. In this report, all references to the CPI relate to the Consumer Price Index for Urban Wage Earners and Clerical Workers (CPI-W). See table II.D1.Contribution and benefit base.
Annual dollar amount above which earnings in employment covered under the OASDI program are neither taxable nor creditable for benefit computation purposes. (Also referred to as "maximum contribution and benefit base," "annual creditable maximum," "taxable maximum," and "maximum taxable.") See tables II.B1 and II.E2. See also, "HI contribution base."Contributions.
The amount based on a percent of earnings, up to an annual maximum, that must be paid by --Cost-of-living increase.
See "Automatic cost-of-living increase."Cost rate.
The cost rate for a year is the ratio of the cost (also called outgo, expenditures, or disbursements) of the program to the taxable payroll for the year. In this context, the outgo is defined to include benefit payments, special monthly payments to certain uninsured persons who have 3 or more quarters of coverage (and whose payments are therefore not reimbursable from the general fund of the Treasury), administrative expenses, net transfers from the trust funds to the Railroad Retirement program under the financial-interchange provisions, and payments for vocational rehabilitation services for disabled beneficiaries; it excludes special monthly payments to certain uninsured persons whose payments are reimbursable from the general fund of the Treasury (as described above), and transfers under the interfund borrowing provisions.Covered earnings.
Earnings in employment covered by the OASDI program.Covered employment.
All employment and self-employment creditable for Social Security purposes. Almost every kind of employment and self-employment is covered under the program. In a few employment situations, for example, religious orders under a vow of poverty, foreign affiliates of American employers, or State and local governments, coverage must be elected by the employer. However, effective July 1991, coverage is mandatory for State and local employees who are not participating in a public employee retirement system. In a few situations, for example, ministers or self-employed members of certain religious groups, workers can opt out of coverage.Covered worker.
A person who has earnings creditable for Social Security purposes on the basis of services for wages in covered employment and/or on the basis of income from covered self-employment.Current-cost financing.
See "Pay-as-you-go financing."Current dollars.
Amounts expressed in nominal dollars with no adjustment for inflationary changes in the value of the dollar over time.Current-payment status.
Status of a beneficiary for whom a benefit is being paid for a given month (with or without deductions, provided the deductions add to less than a full month's benefit). A benefit in current-payment status for a month is usually payable on the third day of the following month.Deemed wage credit.
See "Military service wage credits."Demographic assumptions.
See "Assumptions."Disability.
For Social Security purposes, the inability to engage in substantial gainful activity (see "Substantial gainful activity") by reason of any medically determinable physical or mental impairment that can be expected to result in death or to last for a continuous period of not less than 12 months. Special rules apply for workers age 55 or older whose disability is based on blindness. The law generally requires that a person be disabled continuously for 5 months before he or she can qualify for a disabled-worker benefit.Disability incidence rate.
The proportion of workers in a given year, insured for but not receiving disability benefits, who apply for and are awarded disability benefits.Disability Insurance (DI) Trust Fund.
See "Trust fund."Disability termination rate.
The proportion of disabled-worker beneficiaries in a given year whose disability benefits terminate as a result of the individual's recovery, death, or attainment of normal retirement age.Disabled-worker benefit.
A monthly benefit payable to a disabled worker under normal retirement age and insured for disability. Before November 1960, disability benefits were limited to disabled workers aged 50-64.Earnings.
Unless otherwise qualified, all wages from employment and net earnings from self-employment, whether or not taxable or covered.Earnings test.
The provision requiring the withholding of benefits if beneficiaries under age 70 have earnings in excess of certain exempt amounts. See table II.E2.Economic assumptions.
See "Assumptions."Effective interest rate.
See "Interest rate."Excess wages.
Wages in excess of the contribution and benefit base on which a worker initially pays taxes (usually as a result of working for more than one employer during a year). Employee taxes on excess wages are refunded to affected employees, while the employer taxes are not refunded.Federal Insurance Contributions Act -- FICA.
Provision authorizing taxes on the wages of employed persons to provide for Retirement, Survivors, and Disability Insurance, and for Hospital Insurance. The tax is paid in equal amounts by workers and their employers.Financial interchange.
Provisions of the Railroad Retirement Act providing for transfers between the trust funds and the Social Security Equivalent Benefit Account of the Railroad Retirement program in order to place each trust fund in the same position it would have been in if railroad employment had always been covered under Social Security.Fiscal year.
The accounting year of the United States Government. Since 1976, each fiscal year has begun on October 1 of the prior calendar year and ended the following September 30. For example, fiscal year 1997 began October 1, 1996 and will end September 30, 1997.Full advance funding.
A financing scheme where taxes or contributions are established to match the full cost of future benefits as these costs are incurred through current service. Such financing methods also provide for amortization over a fixed period of any financial liability that is incurred at the beginning of the program (or subsequent modification) as a result of granting credit for past service.General fund of the Treasury.
Funds held by the Treasury of the United States, other than receipts collected for a specific purpose (such as Social Security) and maintained in a separate account for that purpose.General fund reimbursements.
Transfers from the general fund of the Treasury to the trust funds for specific purposes defined in the law, including:Gross Domestic Product -- GDP.
The total dollar value of all goods and services produced by labor and property located in the United States, regardless of who supplies the labor or property.Gross National Product -- GNP.
The total dollar value of all goods and services produced by labor and property supplied by United States residents, regardless of the location in which the production occurs.HI contribution base.
Annual dollar amount above which earnings in employment covered under the HI program are not taxable. (Also referred to as "maximum contribution base," "taxable maximum," and "maximum taxable.") Beginning in 1994, the HI contribution base was eliminated.High cost assumptions.
See "Assumptions."Hospital Insurance (HI) Trust Fund.
See "Trust fund."Income rate.
Ratio of income from tax revenues on a liability basis (payroll-tax contributions and income from the taxation of benefits) to the OASDI taxable payroll for the year.Inflation.
An increase in the volume of money and credit relative to available goods, resulting in an increase in the general price level.Insured status.
The state or condition of having sufficient quarters of coverage to meet the eligibility requirements for retired-worker or disabled-worker benefits, or to permit the worker's spouse and children or survivors to establish eligibility for benefits in the event of his or her disability, retirement, or death. See "Quarters of coverage."Interest.
A payment in exchange for the use of money during a specified period.Interest rate.
Interest rates on new public-debt obligations issuable to Federal trust funds (see "Special public-debt obligation") are determined monthly. Such rates are set equal to the average market yield on all outstanding marketable U.S. securities not due to mature for at least 4 years from the date of the determination. See table II.D1 for historical and assumed future interest rates on new special-issue securities. The "effective" interest rate for a trust fund is the ratio of the interest earned by the fund over a given period of time to the average level of assets held by the fund during the period. The effective rate of interest thus represents a measure of the overall average interest earnings on the fund's portfolio of assets.Interfund borrowing.
The borrowing of assets by a trust fund (OASI, DI, or HI) from another of the trust funds when the first fund is in danger of exhaustion. Interfund borrowing was permitted by the Social Security Act only during 1982 through 1987; all amounts borrowed were to be repaid prior to the end of 1989. The only exercise of this authority occurred in 1982, when the OASI Trust Fund borrowed assets from the DI and HI Trust Funds. The final repayment of borrowed amounts occurred in 1986.Intermediate assumptions.
See "Assumptions."Long range.
The next 75 years. Long-range actuarial estimates are made for this period because it is approximately the maximum remaining lifetime of current Social Security participants.Low cost assumptions.
See "Assumptions."Lump-sum death benefit.
A lump sum, generally $255, payable on the death of a fully or currently insured worker. The lump sum is payable to the surviving spouse of the worker, under most circumstances, or to the worker's children.Maximum family benefit.
The maximum monthly amount that can be paid on a worker's earnings record. Whenever the total of the individual monthly benefits payable to all the beneficiaries entitled on one earnings record exceeds the maximum, each dependent's or survivor's benefit is proportionately reduced to bring the total within the maximum. Benefits payable to divorced spouses or surviving divorced spouses are not reduced under the family maximum provision.Medicare.
A nationwide, Federally administered health insurance program authorized in 1965 to cover the cost of hospitalization, medical care, and some related services for most people over age 65, people receiving Social Security Disability Insurance payments for 2 years, and people with End-Stage Renal Disease. Medicare consists of two separate but coordinated programs -- Part A (Hospital Insurance, HI) and Part B (Supplementary Medical Insurance, SMI). All persons entitled to HI are eligible to enroll in the SMI program on a voluntary basis by paying a monthly premium. Health insurance protection is available to Medicare beneficiaries without regard to income.Military service wage credits.
Credits recognizing that military personnel receive wages in kind (such as food and shelter) in addition to their basic pay and other cash payments. Noncontributory wage credits of $160 were provided for each month of active military service from September 16, 1940, through December 31, 1956. For years after 1956, the basic pay of military personnel is covered under the Social Security program on a contributory basis. In addition to the contributory credits for basic pay, noncontributory wage credits of $300 were granted for each calendar quarter, from January 1957 through December 1977, in which a person received pay for military service. In years after 1977, noncontributory wage credits of $100 are granted for each $300 of military wages, up to a maximum credit of $1,200 per calendar year.National average wage index.
See "Average wage index."Normal retirement age.
The age at which a person may first become entitled to unreduced retirement benefits. Currently age 65, but scheduled under present law to increase gradually to 67 for persons reaching that age in 2027 or later, beginning with an increase to 65 years and 2 months for persons reaching age 65 in 2003.Old-Age and Survivors Insurance (OASI) Trust Fund.
See "Trust fund."Old-law base.
Amount the contribution and benefit base would have been if the discretionary increases in the base under the 1977 amendments had not been enacted. The Social Security Amendments of 1972 provided for automatic annual indexing of the contribution and benefit base. The Social Security Amendments of 1977 provided ad hoc increases to the bases for 1979-81, with subsequent bases updated in accordance with the normal indexing procedure. See table II.E3.Par value.
The value printed on the face of a bond. For both public and special issues held by the trust funds, par value is also the redemption value at maturity.Partial advance funding.
A financing scheme where taxes are scheduled to provide a substantial accumulation of trust fund assets, thereby generating additional interest income to the trust funds and reducing the need for payroll tax increases in periods when costs are relatively high. (Higher general taxes or additional borrowing may be required, however, to support the payment of such interest.) While substantial, the trust fund buildup under partial advance funding is much smaller than it would be with full advance funding.Pay-as-you-go financing.
A financing scheme where taxes are scheduled to produce just as much income as required to pay current benefits, with trust fund assets built up only to the extent needed to prevent exhaustion of the fund by random economic fluctuations.Payroll taxes.
A tax levied on the gross wages of workers. See tables II.B1 and III.A1.Population in the Social Security Area.
The population comprised of (i) residents of the 50 States and the District of Columbia (adjusted for net census undercount); (ii) civilian residents of Puerto Rico, the Virgin Islands, Guam, and American Samoa; (iii) Federal civilian employees and persons in the Armed Forces abroad and their dependents; (iv) crew members of merchant vessels; and (v) all other U.S. citizens abroad.Present value.
The equivalent value, at the present time, of a future stream of payments (either income or expenditures). The present value of a future stream of payments may be thought of as the lump-sum amount that, if invested today, together with interest earnings would be just enough to meet each of the payments as they fell due. At the time of the last payment, the invested fund would be exactly zero. For example, a home mortgage of $100,000 represents the present value at 8 percent interest of future monthly payments of $714.40 for the next 30 years. Present values are widely used in calculations involving financial transactions over long periods of time to account for the time value of money (interest) and the changing value of the dollar (inflation).Primary insurance amount -- PIA.
The monthly amount payable to a retired worker who begins to receive benefits at normal retirement age or (generally) to a disabled worker. This amount, which is related to the worker's average monthly wage or average indexed monthly earnings, is also the amount used as a base for computing all types of benefits payable on the basis of one individual's earnings record.Primary insurance amount formula.
The mathematical formula relating the PIA to the AIME for workers who attain age 62, become disabled, or die after 1978. The PIA is equal to the sum of 90 percent of AIME up to the first bend point, plus 32 percent of AIME above the first bend point up to the second bend point, plus 15 percent of AIME in excess of the second bend point. Automatic benefit increases are applied beginning with the year of eligibility. See table II.E3 for historical and assumed future bend points and table II.E2 for historical and assumed future benefit increases.Quarters of coverage.
Basic unit of measurement for determining insured status. In 1997, a worker receives one quarter of coverage (up to a total of four) for each $670 of annual covered earnings. The amount of earnings required for a quarter of coverage is subject to annual automatic increases in proportion to increases in average earnings. For amounts applicable for years after 1978, see table II.E3.Railroad retirement.
A Federal insurance program, somewhat similar to Social Security, designed for workers in the railroad industry. The provisions of the Railroad Retirement Act provide for a system of coordination and financial interchange between the Railroad Retirement program and the Social Security program.Reallocation of tax rates.
An increase in the tax rate payable to either the OASI or DI Trust Fund, with a corresponding reduction in the rate for the other fund, so that the total OASDI tax rate is not changed.Real-wage differential.
The difference between the percentage increases in (1) the average annual wage in covered employment and (2) the average annual Consumer Price Index. See table II.D1.Recession.
A period of adverse economic conditions; in particular, two or more successive calendar quarters of negative growth in either Gross Domestic Product, or Gross National Product.Retired-worker benefit.
A monthly benefit payable to a fully insured retired worker aged 62 or older or to a person entitled under the transitionally insured status provision in the law. Retired-worker benefit data do not include special age-72 benefits.Retirement age.
The age at which an individual establishes entitlement to retirement benefits. See also, "Normal retirement age."Retirement earnings test.
See "Earnings test."Retirement test.
See "Earnings test."Self-employment.
Operation of a trade or business by an individual or by a partnership in which an individual is a member.Self-Employment Contributions Act -- SECA.
Provision authorizing Social Security taxes on the net earnings of most self-employed persons.Short range.
The next 10 years. Short-range actuarial estimates are prepared for this period because of the short-range test of financial adequacy. The Social Security Act requires estimates for 5 years; estimates are prepared for an additional 5 years to help clarify trends which are only starting to develop in the mandated first 5-year period.Social Security Act.
Provisions of the law governing most operations of the Social Security program. Original Social Security Act is Public Law 74-271, enacted August 14, 1935. With subsequent amendments, the Social Security Act consists of 20 titles, of which four have been repealed. The Old-Age, Survivors, and Disability Insurance program is authorized by Title II of the Social Security Act.Special public-debt obligation.
Securities of the United States Government issued exclusively to the OASI, DI, HI, and SMI Trust Funds and other Federal trust funds. Section 201(d) of the Social Security Act provides that the public-debt obligations issued for purchase by the OASI and DI Trust Funds shall have maturities fixed with due regard for the needs of the funds. The usual practice in the past has been to spread the holdings of special issues, as of each June 30, so that the amounts maturing in each of the next 15 years are approximately equal. Special public-debt obligations are redeemable at par value at any time and carry interest rates determined by law (see "Interest rate"). See also tables II.C2 and II.C4 for a listing of the obligations held by the OASI and DI Trust Funds, respectively.Stabilizer provision.
Section 215(i)(1)(C) of the Act, which provides that if the combined assets of the OASI and DI Trust Funds, as a percentage of estimated annual expenditures, fall below a specified level, automatic benefit increases will be limited to the lower of the increases in wages or prices. The specified level is 20 percent for benefit increases in 1989 and later.Statutory blindness.
Central visual acuity of 20/200 or less in the better eye with the use of a correcting lens or tunnel vision of 20° or less.Substantial gainful activity.
The level of work activity used to establish disability. A finding of disability requires that a person be unable to engage in substantial gainful activity. Under current regulations, a person who is not statutorily blind and is actually earning more than $500 a month (net of impairment-related work expenses) is ordinarily considered to be engaging in substantial gainful activity. A person who is statutorily blind (see "Statutory blindness") is not considered to be engaging in substantial gainful activity, for the purpose of determining a condition of disability, unless the person's earnings are more than $1,000 a month in 1997 (net of impairment-related work expenses). This amount for the blind is subject to adjustment each year to reflect increases in average wage levels.Summarized balance.
The difference between the summarized cost rate and the summarized income rate, expressed as a percentage of taxable payroll.Summarized cost rate.
The ratio of the present value of expenditures to the present value of the taxable payroll for the years in a given period. This ratio can be used as a measure of the relative level of expenditures during the period in question. For purposes of evaluating the financial adequacy of the program, the summarized cost rate is adjusted to include the cost of reaching and maintaining a "target" trust fund level. Because a trust fund level of about 1 year's expenditures is considered to be an adequate reserve for unforeseen contingencies, the targeted trust fund ratio used in determining summarized cost rates is 100 percent of annual expenditures. Accordingly, the adjusted summarized cost rate is equal to the ratio of (a) the sum of the present value of the outgo during the period plus the present value of the targeted ending trust fund level, to (b) the present value of the taxable payroll during the projection period.Summarized income rate.
The ratio of the present value of tax income to the present value of taxable payroll for the years in a given period. This ratio can be used as a measure of the relative level of income during the period in question. For purposes of evaluating the financial adequacy of the program, the summarized income rate is adjusted to include assets on hand at the beginning of the period. Accordingly, the adjusted summarized income rate equals the ratio of (a) the sum of the trust fund balance at the beginning of the period plus the present value of the total income from taxes during the period, to (b) the present value of the taxable payroll for the years in the period.Supplemental Security Income -- SSI.
A Federally administered program (often with State supplementation) of cash assistance for needy aged, blind, or disabled persons. SSI is funded through the general fund of the Treasury and administered by the Social Security Administration.Supplementary Medical Insurance (SMI) Trust Fund.
See "Trust fund."Survivor benefit.
Benefit payable to a survivor of a deceased worker.Taxable earnings.
Wages and/or self-employment income, in employment covered by the OASDI and/or HI programs, that is under the applicable annual maximum taxable limit. For 1994 and later, no maximum taxable limit applies to the HI program.Taxable payroll.
A weighted average of taxable wages and taxable self-employment income. When multiplied by the combined employee-employer tax rate, it yields the total amount of taxes incurred by employees, employers, and the self-employed for work during the period.Taxable self-employment income.
Net earnings from self-employment, generally above $400 and below the annual taxable and creditable maximum amount for a calendar or other taxable year, less any taxable wages in the same taxable year.Taxable wages.
See "Taxable earnings."Taxation of benefits.
During 1984-93, up to one-half of an individual's or a couple's OASDI benefits was potentially subject to Federal income taxation under certain circumstances. The revenue derived from this provision was allocated to the OASI and DI Trust Funds on the basis of the income taxes paid on the benefits from each fund. Beginning in 1994, the maximum portion of OASDI benefits potentially subject to taxation was increased to 85 percent. The additional revenue derived from taxation of benefits in excess of one-half, up to 85 percent, is allocated to the HI Trust Fund.Taxes.
See "Contributions."Termination.
Cessation of payment of a specific type of benefit because the beneficiary is no longer entitled to receive it. For example, benefits might terminate as a result of the death of the beneficiary, the recovery of a disabled beneficiary, or the attainment of age 18 by a child beneficiary. In some cases, the individual may become immediately entitled to another type of benefit (such as the conversion of a disabled-worker beneficiary at normal retirement age to a retired-worker beneficiary).Test of Long-Range Close Actuarial Balance.
Summarized income rates and cost rates are calculated for each of 66 valuation periods within the full 75-year long-range projection period. The first of these periods consists of the next 10 years. Each succeeding period becomes longer by 1 year, culminating with the period consisting of the next 75 years. The long-range test is met if, for each of the 66 valuation periods, the actuarial balance is not less than zero or is negative by, at most, a specified percentage of the summarized cost rate for the same time period. The percentage allowed for a negative actuarial balance is 0 percent for the 10-year period, grading uniformly to 5 percent for the full 75-year period. The criterion for meeting the test is less stringent for the longer periods in recognition of the greater uncertainty associated with estimates for more distant years. The test is applied to OASI and DI separately, as well as combined, based on the intermediate (alternative II) set of assumptions.Test of Short-Range Financial Adequacy.
The conditions required to meet this test are as follows:Total fertility rate.
The average number of children who would be born to a woman in her lifetime if she were to experience the birth rates by age observed in, or assumed for, a specified year, and if she were to survive the entire childbearing period.Trust fund.
Separate accounts in the United States Treasury in which are deposited the taxes received under the Federal Insurance Contributions Act, the Self-Employment Contributions Act, contributions resulting from coverage of State and local government employees; any sums received under the financial interchange with the railroad retirement account; voluntary hospital and medical insurance premiums; and transfers of Federal general revenues. Funds not withdrawn for current monthly or service benefits, the financial interchange, and administrative expenses are invested in interest-bearing Federal securities, as required by law; the interest earned is also deposited in the trust funds.Trust fund ratio.
A measure of the adequacy of the trust fund level. Defined as the assets at the beginning of the year, including advance tax transfers (if any), expressed as a percentage of the outgo during the year. The trust fund ratio represents the proportion of a year's outgo which could be paid with the funds available at the beginning of the year.Unnegotiated check.
A check which has not been cashed 6 months after the end of the month in which the check was issued. When a check has been outstanding for a year (i) the check is administratively cancelled by the Department of the Treasury and (ii) the issuing trust fund is reimbursed separately for the amount of the check and interest for the period the check was outstanding. The appropriate trust fund also receives an interest adjustment for the time the check was outstanding if it is cashed 6-12 months after the month of issue. If a check is presented for payment after it is administratively cancelled, a replacement check is issued.Valuation period.
A period of years which is considered as a unit for purposes of calculating the financial status of a trust fund.Vocational rehabilitation.
Services provided to disabled persons to help enable them to return to gainful employment. Reimbursement from the trust funds for the costs of such services is made only in those cases where the services contributed to the successful rehabilitation of the beneficiaries.Year of exhaustion.
The year in which a trust fund would become unable to pay benefits when due because the assets of the fund were exhausted.
H. STATEMENT OF ACTUARIAL OPINION
Associate of the Society of Actuaries,
Member of the American Academy of Actuaries,
Chief Actuary, Social Security Administration
| |
Privacy Policy | Website Policies & Other Important Information | Site Map | |