2007 Annual Report of the SSI Program


2007 Annual Report of the SSI Program |
|
|
|
|
|
IV. ESTIMATES OF PROGRAM PARTICIPATION AND FEDERAL EXPENDITURES UNDER THE SUPPLEMENTAL SECURITY INCOME PROGRAM
C. FEDERAL PAYMENTS UNDER SSI
In order to estimate future amounts of Federal expenditures under SSI, the projected Federal benefit rates shown in table IV.A2 are first modified to reflect actual payment levels, taking into account historical and projected levels of adjustments for other actual or deemed income. Combining these actual payment levels with the projected numbers of persons receiving Federal SSI payments yields estimates of the amounts of Federal SSI payments. Historical amounts of such payments on a calendar year basis are shown in table IV.C1. For purposes of this presentation, these payment amounts are computed on a cash-flow basis consistent with the concepts used to define SSI obligations for the Federal Budget. As a result, for months after January 1978, SSI payments due on the first of the month are tabulated in the previous month, if the first of the month falls on a weekend or Federal holiday.1
|
Calendar year
|
Blind or disabled, by age group
|
Aged, by age group
|
Totals
|
||||||||
|---|---|---|---|---|---|---|---|---|---|---|---|
|
0-17
|
18-34
|
35-49
|
50-64
|
65-74
|
75 or
older |
65-74
|
75 or
older |
Blind or
disabled |
Aged
|
All
|
|
|
1974
|
$40
|
$438
|
$452
|
$968
|
$135
|
$17
|
$825
|
$958
|
$2,050
|
$1,783
|
$3,833
|
|
1975
|
128
|
537
|
499
|
1,099
|
190
|
17
|
812
|
1,031
|
2,471
|
1,843
|
4,314
|
|
1976
|
176
|
605
|
541
|
1,147
|
241
|
17
|
762
|
1,023
|
2,727
|
1,785
|
4,512
|
|
1977
|
227
|
671
|
579
|
1,174
|
298
|
17
|
721
|
1,016
|
2,966
|
1,737
|
4,703
|
|
1978 2
|
302
|
781
|
655
|
1,312
|
381
|
18
|
736
|
1,111
|
3,449
|
1,847
|
5,296
|
|
1979
|
340
|
809
|
650
|
1,296
|
429
|
21
|
667
|
1,093
|
3,546
|
1,760
|
5,306
|
|
1980
|
397
|
931
|
731
|
1,420
|
544
|
28
|
642
|
1,230
|
4,051
|
1,872
|
5,923
|
|
1981
|
458
|
1,079
|
821
|
1,542
|
654
|
32
|
643
|
1,320
|
4,586
|
1,963
|
6,549
|
|
1982
|
512
|
1,211
|
883
|
1,590
|
704
|
38
|
630
|
1,364
|
4,937
|
1,994
|
6,931
|
|
1983
|
574
|
1,372
|
985
|
1,704
|
774
|
58
|
624
|
1,440
|
5,466
|
2,064
|
7,530
|
|
1984
|
659
|
1,576
|
1,128
|
1,835
|
836
|
102
|
670
|
1,512
|
6,136
|
2,182
|
8,318
|
|
1985
|
736
|
1,709
|
1,250
|
1,924
|
833
|
160
|
699
|
1,499
|
6,611
|
2,198
|
8,809
|
|
1986
|
831
|
1,929
|
1,452
|
2,043
|
848
|
209
|
731
|
1,479
|
7,312
|
2,210
|
9,522
|
|
1987
|
900
|
2,081
|
1,618
|
2,157
|
846
|
259
|
765
|
1,444
|
7,860
|
2,210
|
10,069
|
|
1988
|
955
|
2,228
|
1,818
|
2,303
|
874
|
304
|
814
|
1,449
|
8,481
|
2,263
|
10,744
|
|
1989
|
1,025
|
2,431
|
2,048
|
2,481
|
936
|
366
|
881
|
1,479
|
9,286
|
2,361
|
11,647
|
|
1990
|
1,201
|
2,660
|
2,395
|
2,792
|
969
|
407
|
987
|
1,532
|
10,423
|
2,519
|
12,943
|
|
1991
|
1,678
|
3,129
|
2,966
|
3,305
|
1,060
|
463
|
1,169
|
1,637
|
12,601
|
2,806
|
15,407
|
|
1992
|
3,154
|
3,900
|
3,577
|
3,790
|
1,124
|
487
|
1,303
|
1,690
|
16,033
|
2,993
|
19,026
|
|
1993
|
3,909
|
4,465
|
4,164
|
4,188
|
1,208
|
513
|
1,471
|
1,759
|
18,447
|
3,230
|
21,677
|
|
1994
|
4,167
|
4,504
|
4,666
|
4,533
|
1,274
|
538
|
1,566
|
1,814
|
19,682
|
3,380
|
23,063
|
|
1995
|
4,657
|
4,777
|
5,155
|
4,896
|
1,357
|
565
|
1,599
|
1,900
|
21,407
|
3,499
|
24,906
|
|
1996
|
4,947
|
5,004
|
5,614
|
5,298
|
1,427
|
590
|
1,643
|
1,977
|
22,880
|
3,621
|
26,501
|
|
1997
|
4,920
|
5,031
|
5,564
|
5,410
|
1,505
|
614
|
1,586
|
2,046
|
23,044
|
3,632
|
26,675
|
|
1998
|
4,965
|
5,150
|
5,901
|
5,777
|
1,588
|
635
|
1,542
|
2,136
|
24,017
|
3,678
|
27,695
|
|
1999
|
4,835
|
5,132
|
6,185
|
6,037
|
1,660
|
654
|
1,503
|
2,206
|
24,503
|
3,709
|
28,212
|
|
2000
|
4,789
|
5,121
|
6,404
|
6,293
|
1,717
|
675
|
1,470
|
2,309
|
24,999
|
3,779
|
28,778
|
|
2001
|
5,104
|
5,354
|
6,817
|
6,783
|
1,838
|
713
|
1,470
|
2,454
|
26,608
|
3,924
|
30,532
|
|
2002
|
5,353
|
5,484
|
7,048
|
7,131
|
1,909
|
738
|
1,433
|
2,520
|
27,663
|
3,953
|
31,616
|
|
2003
|
5,686
|
5,715
|
7,243
|
7,532
|
1,984
|
771
|
1,408
|
2,601
|
28,932
|
4,009
|
32,941
|
|
2004
|
6,036
|
5,954
|
7,384
|
7,943
|
2,054
|
809
|
1,366
|
2,657
|
30,179
|
4,023
|
34,202
|
|
2005
|
6,488
|
6,291
|
7,624
|
8,437
|
2,148
|
871
|
1,358
|
2,778
|
31,859
|
4,136
|
35,995
|
|
2006
|
6,948
|
6,656
|
7,760
|
8,943
|
2,235
|
924
|
1,413
|
2,895
|
33,467
|
4,308
|
37,775
|
|
2007 3
|
7,424
|
7,216
|
7,980
|
9,627
|
2,356
|
980
|
1,425
|
2,981
|
35,582
|
4,405
|
39,987
|
1 Total historical payments for 1974-77 agree with those presented in the Annual Statistical Supplement to the Social Security Bulletin. Total historical payments for 1978-83 are estimated.
2 Includes 13 months of payments since payments due on January 1, 1978 and January 1, 1979 were both paid in calendar year 1978.
3 Partially estimated.
Note: Totals do not necessarily equal the sums of rounded components. Historical split among age groups is estimated on a calendar year of age basis.
Using this cash-flow concept causes these payments to differ from similar amounts shown in other Social Security Administration publications, such as the Annual Statistical Supplement to the Social Security Bulletin, in two main ways. First, the payments shown in the Annual Statistical Supplement are tabulated for the month the payment is due, while the amounts shown in table IV.C1 are tabulated for the month they are actually paid. In particular, since January 1 of each year is a Federal holiday, SSI payments due on January 1 of years 1979 and later are actually paid in December of the previous year. Thus, for example, the calendar year 2006 payment amounts shown in table IV.C1 reflect payments made in January-December, 2006, and include the payments due on January 1, 2007 (which were actually paid in December, 2006), but not the payments due on January 1, 2006 (which were actually paid in December, 2005). Second, beginning in 1991, SSI obligations as accounted for in the Federal Budget are not reduced for certain recovered overpayments which are remitted directly to the Department of the Treasury. The payments shown in the Annual Statistical Supplement continue to report an amount which is reduced by such overpayment recoveries, as was done for the Budget prior to 1991.
Corresponding amounts of SSI outlays on a fiscal year2 basis are presented in table IV.C2 for fiscal years 1978-2007. Fiscal years prior to 1978 are omitted from table IV.C2 since historical SSI payment amounts on a fiscal year basis for years prior to 1978 are not readily available. As with the calendar year figures, these fiscal year amounts are shown on a cash-flow basis. Consequently, fiscal years 1979 and later may contain 11, 12, or 13 months of payments, depending on whether October 1 of the current and succeeding fiscal years falls on a weekend.3 Fiscal year 1978 contains 13 months of payments.
|
Fiscal
year |
Blind or disabled, by age group
|
Aged, by age group
|
Totals
|
||||||||
|---|---|---|---|---|---|---|---|---|---|---|---|
|
0-17
|
18-34
|
35-49
|
50-64
|
65-74
|
75 or
older |
65-74
|
75 or
older |
Blind or
disabled |
Aged
|
All
|
|
|
1978
|
$206
|
$740
|
$668
|
$1,438
|
$312
|
$22
|
$772
|
$1,076
|
$3,386
|
$1,848
|
$5,234
|
|
1979 1
|
226
|
711
|
620
|
1,265
|
331
|
20
|
656
|
954
|
3,172
|
1,610
|
4,782
|
|
1980
|
372
|
877
|
698
|
1,360
|
506
|
26
|
629
|
1,184
|
3,840
|
1,813
|
5,653
|
|
1981
|
442
|
1,039
|
797
|
1,508
|
625
|
31
|
647
|
1,307
|
4,442
|
1,954
|
6,396
|
|
1982
|
499
|
1,181
|
861
|
1,570
|
693
|
36
|
640
|
1,356
|
4,840
|
1,996
|
6,836
|
|
1983
|
596
|
1,416
|
1,024
|
1,783
|
806
|
56
|
660
|
1,510
|
5,680
|
2,170
|
7,850
|
|
1984 1
|
588
|
1,411
|
1,005
|
1,665
|
760
|
85
|
613
|
1,391
|
5,514
|
2,004
|
7,517
|
|
1985
|
713
|
1,662
|
1,215
|
1,895
|
828
|
145
|
691
|
1,502
|
6,459
|
2,193
|
8,652
|
|
1986
|
800
|
1,864
|
1,386
|
1,995
|
840
|
196
|
723
|
1,487
|
7,080
|
2,209
|
9,290
|
|
1987
|
880
|
2,030
|
1,565
|
2,119
|
845
|
242
|
755
|
1,448
|
7,681
|
2,203
|
9,884
|
|
1988
|
1,009
|
2,356
|
1,898
|
2,425
|
932
|
316
|
860
|
1,559
|
8,935
|
2,419
|
11,354
|
|
1989 1
|
1,012
|
2,378
|
1,997
|
2,452
|
910
|
345
|
862
|
1,473
|
9,094
|
2,335
|
11,430
|
|
1990 1
|
1,039
|
2,378
|
2,115
|
2,479
|
876
|
362
|
879
|
1,394
|
9,247
|
2,273
|
11,521
|
|
1991
|
1,519
|
2,975
|
2,772
|
3,141
|
1,032
|
447
|
1,120
|
1,608
|
11,886
|
2,728
|
14,614
|
|
1992
|
2,684
|
3,621
|
3,398
|
3,653
|
1,099
|
476
|
1,269
|
1,680
|
14,932
|
2,949
|
17,881
|
|
1993
|
3,817
|
4,377
|
3,977
|
4,033
|
1,175
|
502
|
1,420
|
1,730
|
17,880
|
3,150
|
21,029
|
|
1994
|
4,328
|
4,771
|
4,866
|
4,756
|
1,344
|
569
|
1,659
|
1,930
|
20,635
|
3,588
|
24,223
|
|
1995 1
|
4,554
|
4,719
|
5,031
|
4,822
|
1,341
|
560
|
1,596
|
1,884
|
21,027
|
3,480
|
24,507
|
|
1996 1
|
4,543
|
4,595
|
5,123
|
4,830
|
1,305
|
540
|
1,510
|
1,808
|
20,936
|
3,317
|
24,254
|
|
1997
|
4,933
|
5,004
|
5,529
|
5,340
|
1,478
|
606
|
1,602
|
2,027
|
22,890
|
3,629
|
26,519
|
|
1998
|
4,915
|
5,114
|
5,816
|
5,688
|
1,567
|
630
|
1,548
|
2,110
|
23,729
|
3,658
|
27,387
|
|
1999
|
4,901
|
5,152
|
6,123
|
5,975
|
1,638
|
648
|
1,506
|
2,180
|
24,438
|
3,685
|
28,123
|
|
2000
|
5,152
|
5,500
|
6,827
|
6,692
|
1,822
|
718
|
1,599
|
2,453
|
26,710
|
4,052
|
30,763
|
|
2001 1
|
4,597
|
4,869
|
6,170
|
6,125
|
1,670
|
652
|
1,352
|
2,236
|
24,083
|
3,588
|
27,671
|
|
2002
|
5,290
|
5,456
|
6,998
|
7,041
|
1,889
|
731
|
1,444
|
2,500
|
27,405
|
3,944
|
31,349
|
|
2003
|
5,558
|
5,623
|
7,170
|
7,390
|
1,957
|
759
|
1,417
|
2,572
|
28,456
|
3,989
|
32,445
|
|
2004
|
5,910
|
5,868
|
7,327
|
7,797
|
2,031
|
796
|
1,380
|
2,638
|
29,729
|
4,018
|
33,748
|
|
2005
|
6,856
|
6,669
|
8,150
|
8,928
|
2,282
|
916
|
1,463
|
2,945
|
33,800
|
4,409
|
38,208
|
|
2006 1
|
6,832
|
6,560
|
7,739
|
8,813
|
2,207
|
908
|
1,404
|
2,863
|
33,060
|
4,267
|
37,327
|
|
6,724
|
6,521
|
7,283
|
8,707
|
2,154
|
898
|
1,311
|
2,746
|
32,287
|
4,058
|
36,344
|
|
1 Payment due on October 1 of fiscal year paid in previous fiscal year.
2 Partially estimated.
Note: Totals do not necessarily equal the sums of rounded components. Historical split among age groups is estimated on a calendar year of age basis.
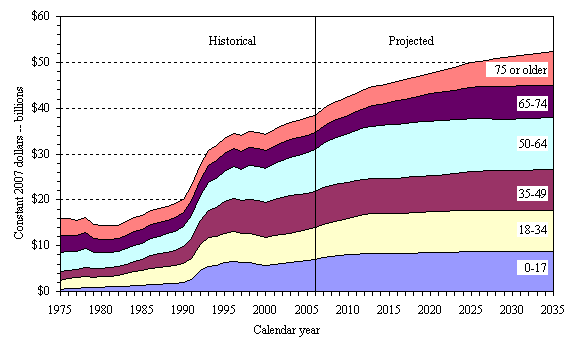
When projecting dollar amounts over longer periods of time, the changing value of the dollar due to inflation can make meaningful comparisons of such amounts difficult. For this reason, in projecting SSI expenditures for 25 years, some means of removing inflation is generally desirable. The CPI, as discussed in section IV.A, is an appropriate means of standardizing projected SSI costs over time. Constant-dollar values of Federal SSI benefit payments (those adjusted by the CPI) are presented in table IV.C3 for both the historical period, calendar years 1974-2006, and the full 25-year projection period, 2007-31. This same information is presented in graphical form in figure IV.C1. Projections of the CPI used for this standardization are based on the intermediate economic assumptions of the 2007 OASDI Trustees Report.
The future growth in the "constant dollar" estimates is primarily attributable to the underlying growth in the U.S. population as shown in table IV.A1. However, an additional contributing factor is the projected growth in the number of SSI recipients as a percent of the population, as shown in table IV.B7.
| |
|
Calendar year
|
Adjusted1 CPI
|
Blind or disabled, by age group
|
Aged, by age group
|
Totals
|
|||||||||
|---|---|---|---|---|---|---|---|---|---|---|---|---|---|
|
0-17
|
18-34
|
35-49
|
50-64
|
65-74
|
75 or
older |
65-74
|
75 or
older |
Blind or
disabled |
Aged
|
All
|
|||
|
Historical data:
|
|||||||||||||
|
1974
|
24.66
|
$164
|
$1,774
|
$1,832
|
$3,927
|
$548
|
$70
|
$3,345
|
$3,884
|
$8,315
|
$7,229
|
$15,544
|
|
|
1975
|
26.92
|
477
|
1,995
|
1,854
|
4,082
|
706
|
65
|
3,017
|
3,829
|
9,178
|
6,846
|
16,024
|
|
|
1976
|
28.46
|
618
|
2,127
|
1,901
|
4,030
|
848
|
59
|
2,677
|
3,596
|
9,583
|
6,273
|
15,856
|
|
|
1977
|
30.30
|
751
|
2,214
|
1,910
|
3,875
|
982
|
57
|
2,380
|
3,351
|
9,789
|
5,731
|
15,520
|
|
|
1978 2
|
32.61
|
927
|
2,394
|
2,007
|
4,023
|
1,170
|
56
|
2,256
|
3,408
|
10,577
|
5,664
|
16,241
|
|
|
1979
|
36.33
|
935
|
2,228
|
1,790
|
3,567
|
1,182
|
58
|
1,835
|
3,009
|
9,760
|
4,844
|
14,604
|
|
|
1980
|
41.24
|
963
|
2,258
|
1,773
|
3,443
|
1,320
|
67
|
1,557
|
2,983
|
9,824
|
4,539
|
14,363
|
|
|
1981
|
45.46
|
1,008
|
2,373
|
1,806
|
3,392
|
1,439
|
69
|
1,414
|
2,905
|
10,087
|
4,318
|
14,406
|
|
|
1982
|
48.18
|
1,063
|
2,512
|
1,832
|
3,299
|
1,461
|
79
|
1,307
|
2,831
|
10,247
|
4,138
|
14,384
|
|
|
1983
|
49.65
|
1,155
|
2,763
|
1,984
|
3,432
|
1,559
|
116
|
1,257
|
2,900
|
11,009
|
4,157
|
15,166
|
|
|
1984
|
51.35
|
1,284
|
3,070
|
2,197
|
3,574
|
1,628
|
198
|
1,305
|
2,945
|
11,950
|
4,250
|
16,200
|
|
|
1985
|
53.17
|
1,384
|
3,214
|
2,351
|
3,619
|
1,567
|
301
|
1,315
|
2,819
|
12,435
|
4,134
|
16,569
|
|
|
1986
|
53.99
|
1,540
|
3,573
|
2,690
|
3,784
|
1,570
|
387
|
1,353
|
2,739
|
13,544
|
4,092
|
17,636
|
|
|
1987
|
55.93
|
1,608
|
3,720
|
2,893
|
3,856
|
1,512
|
463
|
1,368
|
2,582
|
14,052
|
3,950
|
18,002
|
|
|
1988
|
58.16
|
1,642
|
3,831
|
3,126
|
3,959
|
1,503
|
523
|
1,400
|
2,491
|
14,584
|
3,891
|
18,475
|
|
|
1989
|
60.96
|
1,682
|
3,987
|
3,359
|
4,069
|
1,536
|
600
|
1,446
|
2,427
|
15,234
|
3,872
|
19,106
|
|
|
1990
|
64.17
|
1,871
|
4,146
|
3,733
|
4,352
|
1,509
|
634
|
1,539
|
2,387
|
16,244
|
3,926
|
20,170
|
|
|
1991
|
66.76
|
2,514
|
4,687
|
4,443
|
4,951
|
1,589
|
693
|
1,751
|
2,453
|
18,876
|
4,204
|
23,079
|
|
|
1992
|
68.70
|
4,590
|
5,677
|
5,207
|
5,517
|
1,636
|
709
|
1,896
|
2,460
|
23,337
|
4,357
|
27,694
|
|
|
1993
|
70.64
|
5,534
|
6,320
|
5,895
|
5,929
|
1,710
|
726
|
2,083
|
2,490
|
26,114
|
4,572
|
30,686
|
|
|
1994
|
72.42
|
5,754
|
6,219
|
6,443
|
6,260
|
1,759
|
743
|
2,163
|
2,504
|
27,177
|
4,667
|
31,844
|
|
|
1995
|
74.47
|
6,254
|
6,414
|
6,923
|
6,574
|
1,822
|
759
|
2,147
|
2,552
|
28,746
|
4,699
|
33,445
|
|
|
1996
|
76.65
|
6,454
|
6,529
|
7,324
|
6,912
|
1,862
|
770
|
2,144
|
2,580
|
29,850
|
4,724
|
34,574
|
|
|
1997
|
78.35
|
6,280
|
6,421
|
7,102
|
6,905
|
1,921
|
783
|
2,024
|
2,611
|
29,412
|
4,635
|
34,047
|
|
|
1998
|
79.39
|
6,253
|
6,487
|
7,433
|
7,277
|
2,000
|
800
|
1,943
|
2,690
|
30,251
|
4,633
|
34,884
|
|
|
1999
|
81.17
|
5,957
|
6,322
|
7,619
|
7,438
|
2,045
|
805
|
1,852
|
2,718
|
30,187
|
4,570
|
34,756
|
|
|
2000
|
83.98
|
5,702
|
6,097
|
7,626
|
7,493
|
2,044
|
804
|
1,750
|
2,750
|
29,766
|
4,500
|
34,266
|
|
|
2001
|
86.28
|
5,915
|
6,205
|
7,900
|
7,861
|
2,130
|
827
|
1,704
|
2,844
|
30,837
|
4,548
|
35,386
|
|
|
2002
|
87.46
|
6,121
|
6,270
|
8,059
|
8,154
|
2,182
|
843
|
1,638
|
2,881
|
31,630
|
4,520
|
36,150
|
|
|
2003
|
89.41
|
6,359
|
6,391
|
8,101
|
8,424
|
2,219
|
863
|
1,575
|
2,909
|
32,358
|
4,483
|
36,841
|
|
|
2004
|
91.74
|
6,580
|
6,490
|
8,049
|
8,658
|
2,239
|
882
|
1,489
|
2,896
|
32,897
|
4,386
|
37,283
|
|
|
2005
|
94.97
|
6,832
|
6,625
|
8,028
|
8,884
|
2,262
|
917
|
1,430
|
2,926
|
33,548
|
4,355
|
37,904
|
|
|
2006
|
98.14
|
7,080
|
6,782
|
7,908
|
9,113
|
2,278
|
941
|
1,439
|
2,950
|
34,101
|
4,390
|
38,491
|
|
|
Projected:
|
|||||||||||||
|
2007
|
100.00
|
7,424
|
7,216
|
7,980
|
9,627
|
2,356
|
980
|
1,425
|
2,981
|
35,582
|
4,405
|
39,987
|
|
|
2008
|
102.37
|
7,621
|
7,535
|
8,012
|
10,009
|
2,412
|
994
|
1,433
|
2,984
|
36,585
|
4,417
|
41,002
|
|
|
2009
|
105.11
|
7,791
|
7,760
|
7,920
|
10,317
|
2,454
|
1,013
|
1,443
|
2,981
|
37,256
|
4,424
|
41,680
|
|
|
2010
|
108.05
|
7,989
|
8,011
|
7,843
|
10,640
|
2,508
|
1,041
|
1,465
|
2,994
|
38,031
|
4,459
|
42,490
|
|
|
2011
|
111.08
|
8,177
|
8,256
|
7,783
|
10,925
|
2,605
|
1,064
|
1,500
|
2,993
|
38,810
|
4,493
|
43,303
|
|
|
2012
|
114.19
|
8,311
|
8,464
|
7,737
|
11,174
|
2,734
|
1,094
|
1,553
|
2,997
|
39,513
|
4,549
|
44,063
|
|
|
2013
|
117.39
|
8,319
|
8,615
|
7,691
|
11,416
|
2,855
|
1,120
|
1,618
|
3,001
|
40,015
|
4,619
|
44,635
|
|
|
2014
|
120.67
|
8,268
|
8,678
|
7,636
|
11,601
|
2,977
|
1,140
|
1,690
|
3,004
|
40,300
|
4,694
|
44,994
|
|
|
2015
|
124.05
|
8,274
|
8,716
|
7,638
|
11,733
|
3,103
|
1,160
|
1,765
|
3,013
|
40,624
|
4,778
|
45,403
|
|
|
2016
|
127.52
|
8,289
|
8,760
|
7,670
|
11,807
|
3,235
|
1,179
|
1,847
|
3,024
|
40,941
|
4,871
|
45,812
|
|
|
2017
|
131.09
|
8,323
|
8,800
|
7,723
|
11,844
|
3,363
|
1,215
|
1,925
|
3,052
|
41,268
|
4,978
|
46,246
|
|
|
2018
|
134.76
|
8,364
|
8,854
|
7,782
|
11,869
|
3,500
|
1,249
|
2,001
|
3,095
|
41,618
|
5,096
|
46,714
|
|
|
2019
|
138.54
|
8,403
|
8,897
|
7,824
|
11,882
|
3,641
|
1,282
|
2,087
|
3,134
|
41,930
|
5,221
|
47,152
|
|
|
2020
|
142.42
|
8,452
|
8,932
|
7,862
|
11,899
|
3,782
|
1,318
|
2,183
|
3,176
|
42,245
|
5,359
|
47,605
|
|
|
2021
|
146.41
|
8,497
|
8,962
|
7,905
|
11,878
|
3,909
|
1,371
|
2,248
|
3,259
|
42,524
|
5,506
|
48,030
|
|
|
2022
|
150.50
|
8,545
|
8,991
|
7,993
|
11,814
|
4,023
|
1,442
|
2,288
|
3,378
|
42,808
|
5,666
|
48,474
|
|
|
2023
|
154.72
|
8,614
|
9,004
|
8,121
|
11,741
|
4,142
|
1,507
|
2,341
|
3,493
|
43,129
|
5,834
|
48,962
|
|
|
2024
|
159.05
|
8,687
|
9,007
|
8,263
|
11,660
|
4,258
|
1,572
|
2,397
|
3,610
|
43,446
|
6,006
|
49,453
|
|
|
2025
|
163.50
|
8,753
|
8,986
|
8,401
|
11,558
|
4,363
|
1,634
|
2,452
|
3,730
|
43,695
|
6,182
|
49,877
|
|
|
2026
|
168.08
|
8,789
|
8,953
|
8,520
|
11,450
|
4,446
|
1,698
|
2,502
|
3,862
|
43,855
|
6,364
|
50,219
|
|
|
2027
|
172.79
|
8,797
|
8,915
|
8,602
|
11,344
|
4,507
|
1,760
|
2,546
|
4,002
|
43,926
|
6,548
|
50,474
|
|
|
2028
|
177.63
|
8,807
|
8,894
|
8,668
|
11,260
|
4,554
|
1,825
|
2,583
|
4,148
|
44,007
|
6,731
|
50,738
|
|
|
2029
|
182.60
|
8,815
|
8,886
|
8,711
|
11,211
|
4,581
|
1,891
|
2,611
|
4,300
|
44,096
|
6,910
|
51,006
|
|
|
2030
|
187.71
|
8,812
|
8,887
|
8,732
|
11,199
|
4,574
|
1,957
|
2,627
|
4,451
|
44,161
|
7,078
|
51,239
|
|
|
2031
|
192.97
|
8,809
|
8,899
|
8,747
|
11,219
|
4,544
|
2,023
|
2,629
|
4,607
|
44,241
|
7,237
|
51,478
|
|
1 The adjusted CPI is the CPI-W indexed to calendar year 2007. Projections of the adjusted CPI are based on the intermediate economic assumptions of the 2007 OASDI Trustees Report.
2 Payment amounts include 13 months of payments since payments due on January 1, 1978 and January 1, 1979 were both paid in calendar year 1978.
Note: Totals do not necessarily equal the sums of rounded components. Historical split among age groups is estimated on a calendar year of age basis.
Although detailed projections of SSI State supplementary payments are not prepared, historical information on the amounts of such supplements administered by SSA is presented in table IV.C4. These amounts are consistent with those presented in the Annual Statistical Supplement to the Social Security Bulletin and are shown only for the two broad recipient categories.
|
Calendar year
|
Aged
|
Blind or
disabled |
Total
|
|---|---|---|---|
|
1974
|
$631
|
$632
|
$1,264
|
|
1975
|
674
|
729
|
1,403
|
|
1976
|
635
|
753
|
1,388
|
|
1977
|
627
|
804
|
1,431
|
|
1978
|
636
|
855
|
1,491
|
|
1979
|
661
|
928
|
1,590
|
|
1980
|
757
|
1,091
|
1,848
|
|
1981
|
731
|
1,108
|
1,839
|
|
1982
|
694
|
1,104
|
1,798
|
|
1983
|
645
|
1,066
|
1,711
|
|
1984
|
645
|
1,148
|
1,792
|
|
1985
|
694
|
1,278
|
1,973
|
|
1986
|
759
|
1,484
|
2,243
|
|
1987
|
849
|
1,714
|
2,563
|
|
1988
|
873
|
1,798
|
2,671
|
|
1989
|
954
|
2,001
|
2,955
|
|
1990
|
1,038
|
2,201
|
3,239
|
|
1991
|
999
|
2,232
|
3,231
|
|
1992
|
1,023
|
2,412
|
3,435
|
|
1993
|
934
|
2,336
|
3,270
|
|
1994
|
876
|
2,240
|
3,116
|
|
1995
|
864
|
2,253
|
3,118
|
|
1996
|
833
|
2,155
|
2,988
|
|
1997
|
824
|
2,090
|
2,913
|
|
1998
|
838
|
2,165
|
3,003
|
|
1999
|
921
|
2,380
|
3,301
|
|
2000
|
943
|
2,439
|
3,381
|
|
2001
|
956
|
2,505
|
3,460
|
|
2002
|
1,051
|
2,768
|
3,820
|
|
2003
|
1,098
|
2,906
|
4,005
|
|
2004
|
1,133
|
3,045
|
4,178
|
|
2005
|
1,128
|
3,050
|
4,178
|
|
2006 1
|
1,147
|
3,006
|
4,153
|
| 1Split between recipient categories is a preliminary estimate. |
Note: Totals do not necessarily equal the sums of rounded components.
Historical information on State-administered State supplementary payments was previously included in this report, but is no longer included since complete data for all States is generally not available. Information on selected characteristics of State assistance programs for SSI recipients can be found in the Social Security Administration publication, State Assistance Programs for SSI Recipients.4
1Public Law 95-216, the Social Security Amendments of 1977, enacted December 20, 1977, added a statutory requirement that SSI payments, which are normally due on the first of the month, be delivered early when the normal delivery date falls on a Saturday, Sunday or Federal holiday. When the first of the month falls on a weekend or Federal holiday, all payments due on that day are paid in the previous month. Payments presented on a cash-flow basis are tabulated according to the month in which they are actually paid.
2Fiscal years 1977 and later cover the 12-month period ending September 30. For example, fiscal year 2007 payments include payments made from October 1, 2006 through September 30, 2007.
3Generally, for fiscal years 1979 and later, the number of months of payments included in the fiscal year is:
4 Publication No. 13-11975, prepared by the Office of Research, Evaluation, and Statistics, is available on the internet at http://www.socialsecurity.gov/policy/docs/progdesc/ssi_st_asst.
|
|
|
|
|
| SSA Home | Privacy Policy | Website Policies & Other Important Information | Site Map | Actuarial Publications | May 30, 2007 | |