2004 OASDI Trustees Report


2004 OASDI Trustees Report |
|
|
|
|
|
|
IV. ACTUARIAL ESTIMATES
Three types of financial measures are useful in assessing the actuarial status of the Social Security trust funds under the financing approach specified in current law: (1) annual cash-flow measures, including income and cost rates, and balances, (2) trust fund ratios, and (3) summary measures like actuarial balances and unfunded obligations. The first long-range estimates presented are the series of projected annual balances (or net cash flow), which are the differences between the projected annual income rates and annual cost rates. In assessing the financial condition of the program, particular attention should be paid to the level of the annual balances at the end of the long-range period and the time at which the annual balances may change from positive to negative values. The next measure discussed is the pattern of projected trust fund ratios. The trust fund ratio represents the proportion of a year's projected cost that can be paid with the funds available at the beginning of the year. Particular attention should be paid to the level and year of maximum trust fund ratio, to the year of exhaustion of the funds, and to stability of the trust fund ratio in cases where the ratio remains positive at the end of the long-range period. The final measures discussed in this section summarize the total income and cost over valuation periods that extend through 75 years, and to the infinite horizon. These measures indicate whether projected income will be adequate for the period as a whole. Estimates for the infinite future were included for the first time in last year's report. The first such measure, actuarial balance, indicates the size of any shortfall as a percentage of the taxable payroll over the period. The second, open group unfunded obligation, indicates the size of any shortfall in present-value discounted dollars. This section also includes a comparison of workers to beneficiaries, a generational decomposition of the infinite future unfunded obligation, the long-range test of close actuarial balance, and the reasons for change in the actuarial balance from the last report.
If the 75-year actuarial balance is zero (or positive) then the trust fund ratio at the end of the period, by definition, will be at 100 percent (or greater) and financing for the program is considered to be adequate for the 75-year period as a whole. (Financial adequacy, or solvency, for each year is determined by whether the trust fund is zero or positive throughout the year.) Whether or not financial adequacy is stable in the sense that it is likely to continue for subsequent 75-year periods in succeeding reports is also important when considering the actuarial status of the program. One indication of this stability, or sustainable solvency, is the behavior of the trust fund ratio at the end of the projection period. If trust fund ratios for the last several years of the long-range period are positive and constant or rising, then it is likely that subsequent Trustees Reports will also show projections of financial adequacy (assuming no changes in demographic and economic assumptions, or the law). The actuarial balance and the open group unfunded obligation for the infinite future provide additional measures of the financial status of the program for the very long range.
Basic to the consideration of the long-range actuarial status of the trust funds are the concepts of income rate and cost rate, each of which is expressed as a percentage of taxable payroll. Other measures of the cash flow of the program are shown in appendix F. The annual income rate is the ratio of income from payroll tax contributions and the taxation of benefits to the OASDI taxable payroll for the year. The OASDI taxable payroll consists of the total earnings which are subject to OASDI taxes, with some relatively small adjustments.1 As such, it excludes net investment income and reimbursements from the General Fund of the Treasury for the costs associated with special monthly payments to certain uninsured persons who attained age 72 before 1968 and who have fewer than 3 quarters of coverage.
The annual cost rate is the ratio of the cost of the program to the taxable payroll for the year. The cost is defined to include scheduled benefit payments, special monthly payments to certain uninsured persons who have 3 or more quarters of coverage (and whose payments are therefore not reimbursable from the General Fund of the Treasury), administrative expenses, net transfers from the trust funds to the Railroad Retirement program under the financial-interchange provisions, and payments for vocational rehabilitation services for disabled beneficiaries. For any year, the income rate minus the cost rate is referred to as the balance for the year. (In this context, the term balance does not represent the assets of the trust funds, which are sometimes referred to as the balance in the trust funds.)
Table IV.B1 presents a comparison of the estimated annual income rates and cost rates by trust fund and alternative. Detailed long-range projections of trust fund operations, in nominal dollar amounts, are shown in table VI.F9.
The projections for OASI under the intermediate assumptions show the income rate increasing slowly and steadily due to the gradually increasing effect of the taxation of benefits. The pattern of the cost rate is much different. It is projected to remain fairly stable for the next several years. However, from about 2010 to 2030 the cost rate increases rapidly as the baby-boom generation reaches retirement age. Thereafter, the cost rate rises steadily, but slowly, reflecting projected reductions in death rates and continued relatively low birth rates, reaching 16.73 percent of taxable payroll for 2078. By comparison, the income rate reaches 11.51 percent of taxable payroll for 2078.
Projected income rates under the low cost and high cost sets of assumptions are very similar to those projected for the intermediate assumptions as they are largely a reflection of the tax rates specified in the law. OASI cost rates for the low cost and high cost assumptions differ significantly from those projected for the intermediate assumptions, but follow generally similar patterns. For the low cost assumptions, the cost rate declines somewhat for the first 5 years, and then rises, reaching the current level around 2014 and a peak of 13.17 percent of payroll for 2036. The cost rate then declines gradually, reaching a level of 12.20 percent of payroll for 2078 (at which point the income rate reaches 13.38 percent). For the high cost assumptions, the cost rate rises generally throughout the 75-year period. It rises at a relatively fast pace between 2010 and 2030 because of the aging of the baby-boom generation. During the third 25-year subperiod, the projected cost rate continues rising and reaches 23.75 percent of payroll for 2078.
The pattern of the projected OASI annual balance is important in the analysis of the financial condition of the program. Under the intermediate assumptions the annual balance is positive for 14 years (through 2017) and is negative thereafter. This annual deficit rises rapidly, reaching over 2 percent of taxable payroll by 2025, and continues rising thereafter, to a level of 5.22 percent of taxable payroll for 2078.
Under the low cost assumptions the projected OASI annual balance is positive for 18 years (through 2021) and thereafter is negative. The annual deficit under the low cost assumptions rises to a peak of 1.88 percent of taxable payroll for 2036, but declines over the next 15 to 20 years, as the effect of the baby-boom generation diminishes and the assumed higher fertility rates increase the size of the work force. The deficit under the low cost assumptions continues to decline, but at a relatively slow pace over the period 2051 through 2078. Under the high cost assumptions, however, the OASI balance is projected to be positive for only 12 years (through 2015) and to be negative thereafter, with a deficit of 1.64 percent for 2020, 7.53 percent for 2050, and 11.84 percent of payroll for 2078.
|
Calendar
year |
OASI
|
|
DI
|
|
Combined
|
|||||||
|---|---|---|---|---|---|---|---|---|---|---|---|---|
|
Income
rate 1 |
Cost
rate
|
Balance 2
|
Income
rate 1 |
Cost
rate
|
Balance 2
|
Income
rate 1 |
Cost
rate
|
Balance 2
|
||||
|
Historical data:
|
||||||||||||
| |
1990
|
11.32
|
9.66
|
1.66
|
|
1.17
|
1.09
|
0.09
|
|
12.49
|
10.74
|
1.75
|
| |
1991
|
11.44
|
10.15
|
1.29
|
|
1.21
|
1.18
|
.03
|
|
12.65
|
11.33
|
1.32
|
| |
1992
|
11.43
|
10.27
|
1.16
|
|
1.21
|
1.27
|
-.06
|
|
12.64
|
11.54
|
1.10
|
| |
1993
|
11.40
|
10.37
|
1.03
|
|
1.21
|
1.35
|
-.14
|
|
12.61
|
11.73
|
.88
|
| |
1994
|
10.70
|
10.22
|
.48
|
|
1.89
|
1.40
|
.49
|
|
12.59
|
11.62
|
.97
|
| |
1995
|
10.70
|
10.22
|
.48
|
|
1.88
|
1.44
|
.44
|
|
12.59
|
11.67
|
.92
|
| |
1996
|
10.73
|
10.06
|
.68
|
|
1.89
|
1.48
|
.41
|
|
12.62
|
11.53
|
1.09
|
| |
1997
|
10.93
|
9.83
|
1.09
|
|
1.71
|
1.44
|
.28
|
|
12.64
|
11.27
|
1.37
|
| |
1998
|
10.96
|
9.45
|
1.51
|
|
1.72
|
1.42
|
.30
|
|
12.68
|
10.87
|
1.80
|
| |
1999
|
10.99
|
9.09
|
1.90
|
|
1.72
|
1.42
|
.30
|
|
12.71
|
10.51
|
2.20
|
| |
2000
|
10.89
|
8.98
|
1.92
|
|
1.80
|
1.42
|
.37
|
|
12.69
|
10.40
|
2.29
|
| |
2001
|
10.89
|
9.08
|
1.81
|
|
1.82
|
1.48
|
.34
|
|
12.71
|
10.56
|
2.15
|
| |
2002
|
10.91
|
9.31
|
1.61
|
|
1.82
|
1.61
|
.22
|
|
12.74
|
10.91
|
1.82
|
| |
2003
|
10.89
|
9.36
|
1.53
|
|
1.82
|
1.68
|
.14
|
|
12.71
|
11.04
|
1.67
|
|
Intermediate:
|
||||||||||||
| |
2004
|
10.88
|
9.32
|
1.56
|
|
1.82
|
1.74
|
.08
|
|
12.71
|
11.07
|
1.64
|
| |
2005
|
10.90
|
9.11
|
1.79
|
|
1.82
|
1.76
|
.06
|
|
12.73
|
10.87
|
1.86
|
| |
2006
|
10.91
|
8.99
|
1.92
|
|
1.83
|
1.78
|
.05
|
|
12.73
|
10.77
|
1.97
|
| |
2007
|
10.92
|
8.94
|
1.99
|
|
1.83
|
1.81
|
.02
|
|
12.75
|
10.75
|
2.00
|
| |
2008
|
10.96
|
8.95
|
2.01
|
|
1.83
|
1.85
|
-.01
|
|
12.79
|
10.80
|
1.99
|
| |
2009
|
10.95
|
9.03
|
1.91
|
|
1.83
|
1.91
|
-.08
|
|
12.78
|
10.95
|
1.83
|
| |
2010
|
10.97
|
9.16
|
1.80
|
|
1.83
|
1.92
|
-.08
|
|
12.80
|
11.08
|
1.72
|
| |
2011
|
11.01
|
9.32
|
1.70
|
|
1.84
|
1.93
|
-.09
|
|
12.85
|
11.25
|
1.61
|
| |
2012
|
11.04
|
9.53
|
1.51
|
|
1.84
|
1.97
|
-.13
|
|
12.88
|
11.50
|
1.39
|
| |
2013
|
11.06
|
9.76
|
1.30
|
|
1.85
|
2.00
|
-.15
|
|
12.91
|
11.76
|
1.15
|
| |
|
|
|
|
|
|
|
|
|
|
|
|
| |
2015
|
11.10
|
10.29
|
.81
|
|
1.85
|
2.01
|
-.17
|
|
12.95
|
12.30
|
.64
|
| |
2020
|
11.19
|
11.85
|
-.66
|
|
1.85
|
2.08
|
-.23
|
|
13.04
|
13.93
|
-.89
|
| |
2025
|
11.28
|
13.30
|
-2.03
|
|
1.86
|
2.26
|
-.40
|
|
13.13
|
15.56
|
-2.43
|
| |
2030
|
11.35
|
14.51
|
-3.16
|
|
1.86
|
2.32
|
-.46
|
|
13.21
|
16.83
|
-3.62
|
| |
2035
|
11.40
|
15.22
|
-3.82
|
|
1.86
|
2.34
|
-.47
|
|
13.26
|
17.56
|
-4.30
|
| |
2040
|
11.42
|
15.40
|
-3.98
|
|
1.86
|
2.36
|
-.50
|
|
13.28
|
17.76
|
-4.48
|
| |
2045
|
11.42
|
15.37
|
-3.95
|
|
1.87
|
2.45
|
-.58
|
|
13.29
|
17.82
|
-4.53
|
| |
2050
|
11.43
|
15.40
|
-3.98
|
|
1.87
|
2.50
|
-.63
|
|
13.29
|
17.90
|
-4.61
|
| |
2055
|
11.44
|
15.59
|
-4.15
|
|
1.87
|
2.53
|
-.67
|
|
13.31
|
18.12
|
-4.81
|
| |
2060
|
11.46
|
15.87
|
-4.41
|
|
1.87
|
2.52
|
-.65
|
|
13.33
|
18.39
|
-5.06
|
| |
2065
|
11.48
|
16.15
|
-4.68
|
|
1.87
|
2.53
|
-.66
|
|
13.35
|
18.68
|
-5.34
|
| |
2070
|
11.49
|
16.41
|
-4.91
|
|
1.87
|
2.53
|
-.66
|
|
13.36
|
18.93
|
-5.57
|
| |
2075
|
11.51
|
16.61
|
-5.10
|
|
1.87
|
2.55
|
-.68
|
|
13.38
|
19.16
|
-5.78
|
| |
2080
|
11.52
|
16.82
|
-5.30
|
|
1.87
|
2.57
|
-.70
|
|
13.39
|
19.39
|
-6.00
|
|
Year in which cost first exceeds tax income
|
2018
|
|
|
2008
|
|
|
2018
|
|||||
|
Low Cost:
|
||||||||||||
| |
2004
|
10.88
|
9.27
|
1.61
|
|
1.82
|
1.71
|
.11
|
|
12.70
|
10.98
|
1.72
|
| |
2005
|
10.90
|
9.03
|
1.87
|
|
1.82
|
1.70
|
.12
|
|
12.72
|
10.74
|
1.99
|
| |
2006
|
10.90
|
8.85
|
2.05
|
|
1.82
|
1.69
|
.13
|
|
12.73
|
10.54
|
2.19
|
| |
2007
|
10.92
|
8.73
|
2.18
|
|
1.83
|
1.69
|
.13
|
|
12.74
|
10.43
|
2.32
|
| |
2008
|
10.95
|
8.67
|
2.27
|
|
1.83
|
1.70
|
.13
|
|
12.77
|
10.37
|
2.40
|
| |
2009
|
10.93
|
8.67
|
2.26
|
|
1.83
|
1.73
|
.10
|
|
12.76
|
10.41
|
2.35
|
| |
2010
|
10.95
|
8.72
|
2.23
|
|
1.83
|
1.71
|
.12
|
|
12.78
|
10.43
|
2.34
|
| |
2011
|
10.99
|
8.79
|
2.20
|
|
1.83
|
1.69
|
.14
|
|
12.82
|
10.48
|
2.34
|
| |
2012
|
11.01
|
8.94
|
2.07
|
|
1.84
|
1.70
|
.14
|
|
12.85
|
10.64
|
2.21
|
| |
2013
|
11.03
|
9.13
|
1.91
|
|
1.84
|
1.70
|
.14
|
|
12.87
|
10.83
|
2.05
|
| |
||||||||||||
| |
2015
|
11.06
|
9.56
|
1.50
|
|
1.84
|
1.69
|
.15
|
|
12.90
|
11.25
|
1.65
|
| |
2020
|
11.14
|
10.86
|
.28
|
|
1.84
|
1.68
|
.16
|
|
12.98
|
12.54
|
.44
|
| |
2025
|
11.21
|
12.00
|
-.80
|
|
1.84
|
1.76
|
.08
|
|
13.05
|
13.76
|
-.71
|
| |
2030
|
11.26
|
12.82
|
-1.57
|
|
1.85
|
1.77
|
.08
|
|
13.10
|
14.59
|
-1.49
|
| |
2035
|
11.29
|
13.17
|
-1.88
|
|
1.85
|
1.75
|
.09
|
|
13.13
|
14.92
|
-1.79
|
| |
2040
|
11.28
|
13.01
|
-1.72
|
|
1.85
|
1.75
|
.09
|
|
13.13
|
14.76
|
-1.63
|
| |
2045
|
11.27
|
12.71
|
-1.43
|
|
1.85
|
1.79
|
.05
|
|
13.12
|
14.50
|
-1.38
|
| |
2050
|
11.27
|
12.50
|
-1.23
|
|
1.85
|
1.81
|
.04
|
|
13.12
|
14.30
|
-1.19
|
| |
2055
|
11.27
|
12.43
|
-1.16
|
|
1.85
|
1.81
|
.04
|
|
13.12
|
14.24
|
-1.13
|
| |
2060
|
11.27
|
12.42
|
-1.15
|
|
1.85
|
1.79
|
.06
|
|
13.12
|
14.21
|
-1.09
|
| |
2065
|
11.27
|
12.37
|
-1.10
|
|
1.85
|
1.78
|
.06
|
|
13.12
|
14.15
|
-1.03
|
| |
2070
|
11.27
|
12.28
|
-1.01
|
|
1.85
|
1.78
|
.06
|
|
13.12
|
14.06
|
-.95
|
| |
2075
|
11.27
|
12.20
|
-.94
|
|
1.85
|
1.80
|
.05
|
|
13.11
|
14.01
|
-.89
|
| |
2080
|
11.27
|
12.21
|
-.94
|
|
1.85
|
1.82
|
.03
|
|
13.12
|
14.03
|
-.91
|
|
Year in which cost first exceeds tax income
|
2022
|
|
|
|
|
2022
|
||||||
|
High Cost:
|
||||||||||||
| |
2004
|
10.89
|
9.47
|
1.42
|
|
1.82
|
1.83
|
-.01
|
|
12.71
|
11.30
|
1.42
|
| |
2005
|
10.91
|
9.33
|
1.58
|
|
1.83
|
1.91
|
-.08
|
|
12.73
|
11.24
|
1.50
|
| |
2006
|
10.92
|
9.30
|
1.62
|
|
1.83
|
1.99
|
-.16
|
|
12.75
|
11.29
|
1.46
|
| |
2007
|
10.94
|
9.34
|
1.60
|
|
1.83
|
2.08
|
-.25
|
|
12.77
|
11.42
|
1.35
|
| |
2008
|
10.98
|
9.43
|
1.54
|
|
1.84
|
2.17
|
-.34
|
|
12.81
|
11.61
|
1.21
|
| |
2009
|
10.96
|
9.51
|
1.45
|
|
1.84
|
2.27
|
-.44
|
|
12.80
|
11.79
|
1.02
|
| |
2010
|
10.99
|
9.73
|
1.26
|
|
1.84
|
2.31
|
-.47
|
|
12.83
|
12.04
|
.79
|
| |
2011
|
11.04
|
9.97
|
1.07
|
|
1.85
|
2.35
|
-.50
|
|
12.89
|
12.32
|
.57
|
| |
2012
|
11.07
|
10.22
|
.85
|
|
1.85
|
2.40
|
-.55
|
|
12.92
|
12.62
|
.30
|
| |
2013
|
11.10
|
10.48
|
.62
|
|
1.86
|
2.44
|
-.59
|
|
12.95
|
12.92
|
.03
|
| |
|
|
|
|
|
|
|
|
|
|
|
|
| |
2015
|
11.14
|
11.08
|
.06
|
|
1.86
|
2.50
|
-.64
|
|
13.00
|
13.58
|
-.58
|
| |
2020
|
11.25
|
12.89
|
-1.64
|
|
1.87
|
2.64
|
-.77
|
|
13.11
|
15.53
|
-2.42
|
| |
2025
|
11.35
|
14.69
|
-3.33
|
|
1.87
|
2.88
|
-1.00
|
|
13.23
|
17.56
|
-4.34
|
| |
2030
|
11.45
|
16.33
|
-4.88
|
|
1.88
|
2.97
|
-1.10
|
|
13.33
|
19.31
|
-5.97
|
| |
2035
|
11.53
|
17.55
|
-6.02
|
|
1.88
|
3.01
|
-1.13
|
|
13.41
|
20.56
|
-7.15
|
| |
2040
|
11.58
|
18.23
|
-6.66
|
|
1.88
|
3.07
|
-1.19
|
|
13.46
|
21.31
|
-7.85
|
| |
2045
|
11.61
|
18.68
|
-7.08
|
|
1.89
|
3.22
|
-1.34
|
|
13.49
|
21.90
|
-8.41
|
| |
2050
|
11.64
|
19.17
|
-7.53
|
|
1.89
|
3.32
|
-1.43
|
|
13.53
|
22.49
|
-8.97
|
| |
2055
|
11.68
|
19.84
|
-8.16
|
|
1.89
|
3.42
|
-1.52
|
|
13.57
|
23.26
|
-9.69
|
| |
2060
|
11.73
|
20.66
|
-8.93
|
|
1.89
|
3.43
|
-1.54
|
|
13.62
|
24.09
|
-10.47
|
| |
2065
|
11.78
|
21.57
|
-9.79
|
|
1.89
|
3.46
|
-1.57
|
|
13.67
|
25.03
|
-11.36
|
| |
2070
|
11.83
|
22.47
|
-10.64
|
|
1.89
|
3.45
|
-1.56
|
|
13.72
|
25.93
|
-12.20
|
| |
2075
|
11.88
|
23.30
|
-11.42
|
|
1.89
|
3.47
|
-1.58
|
|
13.77
|
26.77
|
-13.00
|
| |
2080
|
11.92
|
24.03
|
-12.11
|
|
1.90
|
3.48
|
-1.59
|
|
13.81
|
27.52
|
-13.70
|
|
Year in which cost first exceeds tax income
|
2016
|
|
|
2004
|
|
|
2013
|
|||||
| 1Historical income rates are modified to include adjustments to the lump-sum payments received in 1983 from the General Fund of the Treasury for the cost of noncontributory wage credits for military service in 1940-56. 2The years for which the annual balances are projected under the intermediate assumptions to become permanently negative are 2018, 2008, and 2018 for the OASI, DI, and the combined funds, respectively. Under the high cost assumptions the corresponding years are 2016, 2004, and 2014. Under the low cost assumptions, annual balances for the OASI and the combined funds are projected to become permanently negative in 2022. Under the low cost projection the annual balance for the DI fund is projected to be positive throughout the 75-year projection period. 3Tax income is projected to exceed cost throughout the projection period. |
Notes:
1. The income rate excludes interest income and certain transfers from the General Fund of the Treasury.
2. Some historical values are subject to change due to revisions of taxable payroll.
3. Totals do not necessarily equal the sums of rounded components.
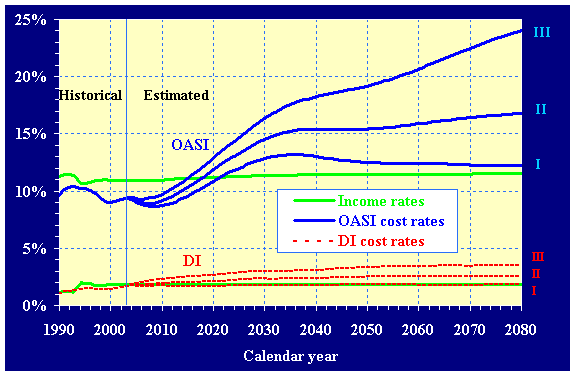
Under the intermediate assumptions, the cost rate for DI generally increases over the long-range period from 1.74 percent of taxable payroll for 2004, reaching 2.56 for 2078. The income rate increases only very slightly from 1.82 percent of taxable payroll for 2004 to 1.87 percent for 2078. The annual balance turns negative in 2008, and the annual deficit reaches 0.69 percent for 2078.
Under the low cost assumptions, the DI cost rate increases much less, reaching 1.81 percent for 2078, with a positive annual balance throughout the period. For the high cost assumptions, DI cost rises much more, reaching 3.48 percent for 2078, with an annual deficit beginning in 2004 and reaching 1.58 percent for 2078.
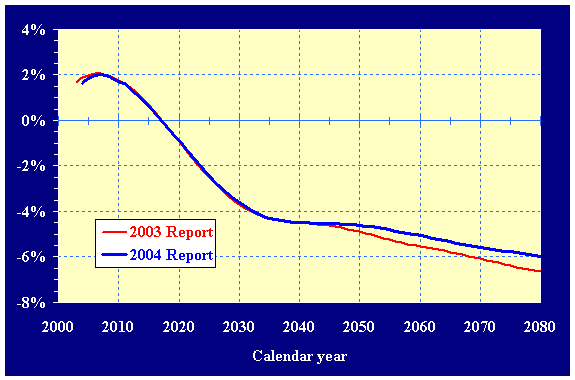
Figure IV.B1 shows in graphical form the patterns of the OASI and DI annual income rates and cost rates. The income rates shown here are only for alternative II in order to simplify the graphical presentation because, as shown in table IV.B1, the variation in the income rates by alternative is very small. Income rates increase generally, but at a slow rate for each of the alternatives over the long-range period. Both increases in the income rate and variation among the alternatives result from the relatively small component of income from taxation of benefits. Increases in income from taxation of benefits reflect increases in the total amount of benefits paid and the fact that an increasing share of individual benefits will be subject to taxation, because benefit taxation threshold amounts are not indexed.
The patterns of the annual balances for OASI and DI are suggested by figure IV.B1. For each alternative, the magnitude of each of the positive balances in the early years, as a percent of taxable payroll, is represented by the distance between the appropriate cost-rate curve and the income-rate curve above it. The magnitude of each of the deficits in subsequent years is represented by the distance between the appropriate cost-rate curve and the income-rate curve below it.
In the future, the cost of OASI, DI and the combined OASDI programs as a percent of taxable payroll will not necessarily be within the range encompassed by alternatives I and III. Nonetheless, because alternatives I and III define a reasonably wide range of demographic and economic conditions, the resulting estimates delineate a reasonable range for consideration of potential future program costs.
The cost of the OASDI program has been discussed in this section in relation to taxable payroll, which is a program-related concept that is very useful in analyzing the financial status of the OASDI program. The cost can also be discussed in relation to broader economic concepts, such as the gross domestic product (GDP). OASDI outlays generally rise from about 4.3 percent of GDP currently to about 6.6 percent of GDP by the end of the 75-year projection period under alternative II. Discussion of both the cost and the taxable payroll of the OASDI program in relation to GDP is presented in appendix VI.F.2.
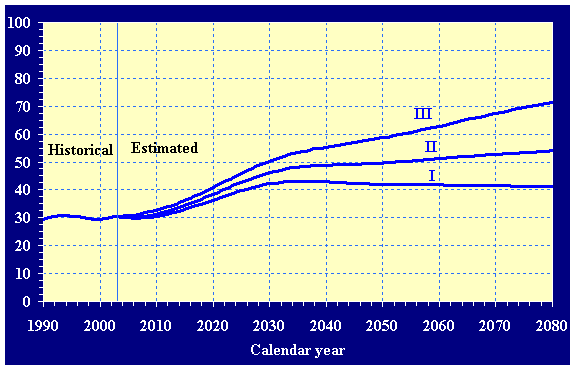
The primary reason that the estimated OASDI cost rate increases rapidly after 2010 is that the number of beneficiaries is projected to increase more rapidly than the number of covered workers. This occurs because the relatively large number of persons born during the baby-boom will reach retirement age, and begin to receive benefits, while the relatively small number of persons born during the subsequent period of low fertility rates will comprise the labor force. A comparison of the numbers of covered workers and beneficiaries is shown in table IV.B2.
|
Calendar year
|
Beneficiaries 2 (in thousands)
|
Covered
workers per OASDI beneficiary |
Beneficiaries
per 100 covered workers |
||||
|---|---|---|---|---|---|---|---|
|
OASI
|
DI
|
OASDI
|
|||||
|
Historical data:
|
|||||||
| |
1945
|
46,390
|
1,106
|
--
|
1,106
|
41.9
|
2
|
| |
1950
|
48,280
|
2,930
|
--
|
2,930
|
16.5
|
6
|
| |
1955
|
65,200
|
7,563
|
--
|
7,563
|
8.6
|
12
|
| |
1960
|
72,530
|
13,740
|
522
|
14,262
|
5.1
|
20
|
| |
1965
|
80,680
|
18,509
|
1,648
|
20,157
|
4.0
|
25
|
| |
1970
|
93,090
|
22,618
|
2,568
|
25,186
|
3.7
|
27
|
| |
1975
|
100,200
|
26,998
|
4,125
|
31,123
|
3.2
|
31
|
| |
1980
|
113,649
|
30,384
|
4,734
|
35,118
|
3.2
|
31
|
| |
1985
|
120,565
|
32,776
|
3,874
|
36,650
|
3.3
|
30
|
| |
|
|
|
|
|
|
|
| |
1990
|
133,672
|
35,266
|
4,204
|
39,470
|
3.4
|
30
|
| |
1991
|
132,969
|
35,785
|
4,388
|
40,172
|
3.3
|
30
|
| |
1992
|
133,890
|
36,314
|
4,716
|
41,029
|
3.3
|
31
|
| |
1993
|
136,117
|
36,758
|
5,083
|
41,840
|
3.3
|
31
|
| |
1994
|
138,197
|
37,082
|
5,435
|
42,516
|
3.3
|
31
|
| |
1995
|
141,027
|
37,376
|
5,731
|
43,108
|
3.3
|
31
|
| |
1996
|
143,415
|
37,521
|
5,977
|
43,498
|
3.3
|
30
|
| |
1997
|
146,135
|
37,705
|
6,087
|
43,793
|
3.3
|
30
|
| |
1998
|
148,896
|
37,826
|
6,250
|
44,076
|
3.4
|
30
|
| |
1999
|
151,333
|
37,934
|
6,433
|
44,367
|
3.4
|
29
|
| |
2000
|
153,691
|
38,560
|
6,606
|
45,166
|
3.4
|
29
|
| |
2001
|
153,716
|
38,888
|
6,780
|
45,668
|
3.4
|
30
|
| |
2002
|
153,837
|
39,116
|
7,060
|
46,176
|
3.3
|
30
|
| |
2003
|
154,309
|
39,314
|
7,438
|
46,752
|
3.3
|
30
|
|
Intermediate:
|
|||||||
| |
2005
|
158,999
|
39,891
|
8,022
|
47,914
|
3.3
|
30
|
| |
2010
|
167,746
|
43,199
|
9,285
|
52,484
|
3.2
|
31
|
| |
2015
|
173,031
|
49,481
|
10,048
|
59,529
|
2.9
|
34
|
| |
2020
|
177,070
|
57,294
|
10,693
|
67,987
|
2.6
|
38
|
| |
2025
|
179,546
|
64,826
|
11,802
|
76,629
|
2.3
|
43
|
| |
2030
|
181,863
|
71,454
|
12,355
|
83,809
|
2.2
|
46
|
| |
2035
|
184,518
|
76,034
|
12,733
|
88,768
|
2.1
|
48
|
| |
2040
|
187,459
|
78,376
|
13,150
|
91,526
|
2.0
|
49
|
| |
2045
|
190,373
|
79,900
|
13,806
|
93,706
|
2.0
|
49
|
| |
2050
|
192,929
|
81,477
|
14,243
|
95,720
|
2.0
|
50
|
| |
2055
|
195,291
|
83,684
|
14,625
|
98,309
|
2.0
|
50
|
| |
2060
|
197,529
|
86,226
|
14,759
|
100,985
|
2.0
|
51
|
| |
2065
|
199,711
|
88,813
|
14,983
|
103,796
|
1.9
|
52
|
| |
2070
|
201,976
|
91,240
|
15,164
|
106,404
|
1.9
|
53
|
| |
2075
|
204,169
|
93,406
|
15,451
|
108,857
|
1.9
|
53
|
| |
2080
|
206,243
|
95,600
|
15,710
|
111,310
|
1.9
|
54
|
|
Low Cost:
|
|||||||
| |
2005
|
159,593
|
39,889
|
7,896
|
47,785
|
3.3
|
30
|
| |
2010
|
170,481
|
43,141
|
8,682
|
51,823
|
3.3
|
30
|
| |
2015
|
176,307
|
49,262
|
8,963
|
58,224
|
3.0
|
33
|
| |
2020
|
181,507
|
56,726
|
9,240
|
65,965
|
2.8
|
36
|
| |
2025
|
185,527
|
63,780
|
9,892
|
73,673
|
2.5
|
40
|
| |
2030
|
189,758
|
69,761
|
10,183
|
79,944
|
2.4
|
42
|
| |
2035
|
194,874
|
73,658
|
10,454
|
84,112
|
2.3
|
43
|
| |
2040
|
200,855
|
75,316
|
10,824
|
86,140
|
2.3
|
43
|
| |
2045
|
207,283
|
76,365
|
11,420
|
87,785
|
2.4
|
42
|
| |
2050
|
213,736
|
77,708
|
11,862
|
89,570
|
2.4
|
42
|
| |
2055
|
220,284
|
79,830
|
12,300
|
92,131
|
2.4
|
42
|
| |
2060
|
227,113
|
82,310
|
12,593
|
94,903
|
2.4
|
42
|
| |
2065
|
234,537
|
84,766
|
13,013
|
97,778
|
2.4
|
42
|
| |
2070
|
242,360
|
87,060
|
13,470
|
100,530
|
2.4
|
41
|
| |
2075
|
250,376
|
89,448
|
14,053
|
103,500
|
2.4
|
41
|
| |
2080
|
258,426
|
92,346
|
14,616
|
106,962
|
2.4
|
41
|
|
High Cost:
|
|||||||
| |
2005
|
156,978
|
39,892
|
8,313
|
48,205
|
3.3
|
31
|
| |
2010
|
164,948
|
43,246
|
10,584
|
53,831
|
3.1
|
33
|
| |
2015
|
170,495
|
49,773
|
11,861
|
61,634
|
2.8
|
36
|
| |
2020
|
173,906
|
57,992
|
12,961
|
70,953
|
2.5
|
41
|
| |
2025
|
175,495
|
66,137
|
14,363
|
80,500
|
2.2
|
46
|
| |
2030
|
176,606
|
73,694
|
14,995
|
88,689
|
2.0
|
50
|
| |
2035
|
177,542
|
79,402
|
15,353
|
94,755
|
1.9
|
53
|
| |
2040
|
178,249
|
82,845
|
15,729
|
98,574
|
1.8
|
55
|
| |
2045
|
178,366
|
85,289
|
16,399
|
101,688
|
1.8
|
57
|
| |
2050
|
178,089
|
87,628
|
16,791
|
104,419
|
1.7
|
59
|
| |
2055
|
177,185
|
90,392
|
17,085
|
107,477
|
1.6
|
61
|
| |
2060
|
176,061
|
93,467
|
17,018
|
110,485
|
1.6
|
63
|
| |
2065
|
174,508
|
96,643
|
16,987
|
113,630
|
1.5
|
65
|
| |
2070
|
172,776
|
99,574
|
16,793
|
116,366
|
1.5
|
67
|
| |
2075
|
170,826
|
101,979
|
16,681
|
118,660
|
1.4
|
69
|
| |
2080
|
168,877
|
103,932
|
16,552
|
120,484
|
1.4
|
71
|
| 1Workers who are paid at some time during the year for employment on which OASDI taxes are due. 2Beneficiaries with monthly benefits in current-payment status as of June 30. |
Notes:
1. The number of beneficiaries does not include certain uninsured persons, most of whom both attained age 72 before 1968 and have fewer than 3 quarters of coverage, in which cases the costs are reimbursed by the General Fund of the Treasury.
2. Historical covered worker data are subject to revision.
3. Totals do not necessarily equal the sums of rounded components.
The impact of the demographic shifts under the three alternatives on the OASDI cost rates is readily seen by considering the projected number of beneficiaries per 100 workers. As compared to the 2003 level of 30 beneficiaries per 100 covered workers, this ratio is estimated to rise significantly by 2080 to 41 under the low cost assumptions, 54 under the intermediate assumptions, and 71 under the high cost assumptions. The significance of these numbers can be seen by comparing figure IV.B1 to figure IV.B2.
For each alternative, the shape of the curve in figure IV.B2, which shows beneficiaries per 100 covered workers, is strikingly similar to that of the corresponding cost-rate curve in figure IV.B1, thereby emphasizing the extent to which the cost of the OASDI program as a percentage of taxable payroll is determined by the age distribution of the population. Because the cost rate is basically the product of the number of beneficiaries and their average benefit, divided by the product of the number of covered workers and their average taxable earnings (and because average benefits rise at about the same rate as average earnings), it is to be expected that the pattern of the annual cost rates is similar to that of the annual ratios of beneficiaries to workers.
Table IV.B2 also shows that the number of covered workers per beneficiary, which was about 3.3 in 2003, is estimated to decline in the future. Based on the intermediate assumptions, the ratio declines to 2.1 by 2031, and 1.9 workers per beneficiary by 2062. Based on the low cost assumptions, for which high fertility rates and small reductions in death rates are assumed, the ratio declines to 2.3 by 2032, and then rises back to a level of 2.4 by 2044. Based on the high cost assumptions, for which low fertility rates and large reductions in death rates are assumed, the decline is much greater, reaching 1.8 by 2037, and 1.4 workers per beneficiary by 2074.
Trust fund ratios are useful indicators of the adequacy of the financial resources of the Social Security program at any point in time. For any year in which the projected trust fund ratio is positive (i.e., the trust fund holds assets at the beginning of the year), but is not positive for the following year the trust fund is projected to become exhausted during the year. Under present law, the OASI and DI Trust Funds do not currently have the authority to borrow. Therefore, exhaustion of the assets in either fund during a year would mean there are no longer sufficient assets in the fund to cover the full amount of benefits scheduled for the year under present law.
The trust fund ratio also serves an additional important purpose in assessing the actuarial status of the program. When the financing is adequate for the timely payment of full benefits throughout the long-range period, the stability of the trust fund ratio toward the end of the period indicates the likelihood that this projected adequacy will continue for subsequent Trustees Reports. If the trust fund ratio toward the end of the period is level (or increasing), then projected adequacy for the long-range period is likely to continue for subsequent reports.
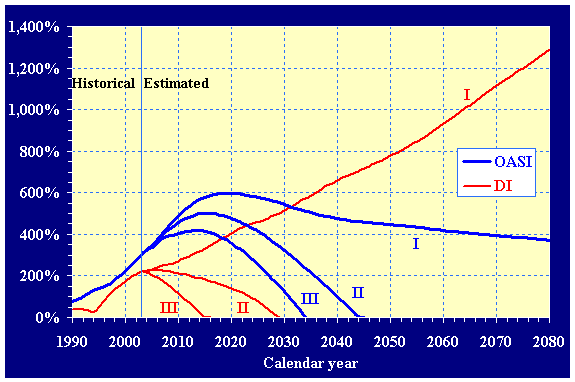
Table IV.B3 shows, by alternative, the estimated trust fund ratios (without regard to advance tax transfers that would be effected after the end of the 10-year, short-range period) for the separate and combined OASI and DI Trust Funds. Also shown in this table is the year in which a fund is estimated to become exhausted, reflecting the effect of the provision for advance tax transfers. The patterns of the OASI and DI trust fund ratios, over the 75-year period, are shown graphically in figure IV.B3 for all three sets of assumptions. A graphical presentation of the combined OASDI ratios is shown in figure II.D7.
Based on the intermediate assumptions, the OASI trust fund ratio rises steadily from 322 percent at the beginning of 2004, reaching a peak of 500 percent at the beginning of 2015. This increase in the OASI trust fund ratio results from the fact that the annual income rate (which excludes interest) exceeds annual outgo for several years (see table IV.B1). Thereafter, the OASI trust fund ratio declines steadily, with the OASI Trust Fund becoming exhausted in 2044. The DI trust fund ratio follows a pattern that is similar but unfolds more rapidly. The DI trust fund ratio is estimated to rise from 223 percent at the beginning of 2004 to a peak of 226 percent for 2006, and to decline thereafter until becoming exhausted in 2029.
The trust fund ratio for the combined OASI and DI Trust Funds rises from 306 percent for 2004 to a peak of 448 percent at the beginning of 2015. Thereafter, the ratio declines, with the combined funds becoming exhausted in 2042. Based on the intermediate estimates in last year's report, the peak fund ratio for the combined funds was estimated to be 471 percent for 2016 and the year of exhaustion was estimated to be 2042.
The trust fund ratio for the OASDI program first declines in 2016, about 2 years before annual expenditures begin to exceed noninterest income. This occurs because the increase in trust fund assets during 2015, which reflects interest income and a small excess of noninterest income over cost, occurs at a slower rate than does the increase in the annual cost of the program between 2015 and 2016.
After 2015 the dollar amount of assets is projected to continue to rise through the beginning of 2028 because interest income more than offsets the shortfall in noninterest income. Beginning in 2018, the OASDI program is projected to experience increasingly large cash-flow shortfalls that will require the trust funds to redeem special public-debt obligations of the General Fund of the Treasury. This will differ from the experience of recent years when the trust funds have been net lenders to the General Fund of the Treasury. The change in the cash flow between the trust funds and the general fund is expected to have important public policy and economic implications that go well beyond the operation of the OASDI program itself.
Based on the low cost assumptions, the trust fund ratio for the DI program increases throughout the long-range projection period, reaching the extremely high level of 1,270 percent for 2079. At the end of the long-range period, the DI trust fund ratio is rising by 19 percentage points per year. Thus, subsequent reports are likely to contain projections of adequate long-range financing of the DI program under a similar optimistic set of assumptions. For the OASI program, the trust fund ratio rises to a peak of 598 percent for 2019, dropping thereafter to a level of 375 percent by 2079. At the end of the period the OASI trust fund ratio is declining by 3 percentage points per year. The long-term outlook for the DI program is improved more than for the OASI program largely because lower assumed disability incidence rates have a substantial effect on the DI program but little net effect on the OASI program. For the OASDI program, the trust fund ratio peaks at 572 percent for 2021, and then generally falls to 491 percent for 2079, and stays at that level. Thus, due to the size of the trust fund ratios and their near stability, subsequent Trustees Reports are likely to contain projections of adequate long-range financing of the OASI and combined OASI and DI program under the low cost assumptions. A stable trust fund ratio at the end of the valuation period indicates that the actuarial balance for Trustees Reports in subsequent years can be expected to remain about the same as long as assumptions are realized.
In contrast, under the high cost assumptions, the OASI trust fund ratio is estimated to peak at 418 percent for 2014, thereafter declining to fund exhaustion by the end of 2034. The DI trust fund ratio is estimated to peak at 215 percent for 2004, thereafter declining to fund exhaustion by the end of 2015. The combined OASDI trust fund ratio is estimated to rise to a peak of 349 percent for 2012, declining thereafter to fund exhaustion by the end of 2031.
Thus, because large ultimate cost rates are projected under all but the low cost assumptions, it is likely that income will eventually need to be increased, and/or program costs will need to be reduced in order to prevent the trust funds from becoming exhausted.
Even under the high cost assumptions, however, the combined OASI and DI funds on hand plus their estimated future income would be able to cover their combined cost for 27 years into the future (until 2031). Under the intermediate assumptions the combined starting funds plus estimated future income would be able to cover cost for about 38 years into the future (until 2042). The program would be able to cover cost for the foreseeable future under the more optimistic low cost assumptions. In the 2003 report, the combined trust funds were projected to become exhausted in 2031 under the high cost assumptions and in 2042 under the intermediate assumptions.
.
| 1The trust fund is estimated to be exhausted by the beginning of this year. The last line of the table shows the specific year of trust fund exhaustion. 2The fund is not estimated to be exhausted within the projection period. |
Note: See definition of trust fund ratio. The combined ratios shown for years after the DI fund is estimated to be exhausted are theoretical and are shown for informational purposes only.
A graphic illustration of the trust fund ratios for the separate OASI and DI Trust Funds is shown in figure IV.B3 for each of the alternative sets of assumptions. A graphic illustration of the trust fund ratios for the combined trust funds is shown in figure II.D7.
Summarized values for the full 75-year period are useful in analyzing the long-range adequacy of financing for the program over the period as a whole under present law and under proposed modifications to the law. In order to focus on the full 75-year period as well as on broad patterns through the period, tables IV.B4 and IV.B5 summarize, on a present-value basis, the projected annual figures shown in table IV.B1 for various periods within the overall 75-year projection period.
Table IV.B4 shows rates summarized on a present-value basis for each of the 25-year subperiods, excluding both the assets of the trust funds on hand at the beginning of the period and the cost of accumulating a target trust fund balance by the end of the period. These rates are useful for comparing the total cash flows of tax income and cost, within each period, and the progression of these flows across the three subperiods.
For the OASDI program, a positive balance is projected for the first 25-year subperiod under both the low cost and intermediate assumptions. A deficit is projected for the first 25-year subperiod under the high cost assumptions. Deficits are projected for the second and third subperiods under all three alternatives.
|
Subperiod
|
OASI
|
|
DI
|
|
Combined
|
|||||||
|---|---|---|---|---|---|---|---|---|---|---|---|---|
|
Income
rate |
Cost
rate |
Balance
|
Income
rate |
Cost
rate |
Balance
|
Income
rate |
Cost
rate |
Balance
|
||||
|
Intermediate:
|
||||||||||||
| |
2004-28
|
11.08
|
10.79
|
0.28
|
|
1.84
|
2.02
|
-0.18
|
|
12.92
|
12.81
|
0.11
|
| |
2029-53
|
11.40
|
15.20
|
-3.81
|
|
1.86
|
2.39
|
-.53
|
|
13.26
|
17.60
|
-4.34
|
| |
2054-78
|
11.47
|
16.13
|
-4.66
|
|
1.87
|
2.53
|
-.67
|
|
13.34
|
18.67
|
-5.33
|
|
Low Cost:
|
||||||||||||
| |
2004-28
|
11.04
|
10.05
|
.99
|
|
1.83
|
1.71
|
.12
|
|
12.88
|
11.77
|
1.11
|
| |
2029-53
|
11.27
|
12.85
|
-1.59
|
|
1.85
|
1.77
|
.07
|
|
13.11
|
14.63
|
-1.51
|
| |
2054-78
|
11.26
|
12.34
|
-1.08
|
|
1.85
|
1.79
|
.05
|
|
13.11
|
14.14
|
-1.03
|
|
High Cost:
|
||||||||||||
| |
2004-28
|
11.12
|
11.65
|
-.53
|
|
1.85
|
2.47
|
-.62
|
|
12.97
|
14.12
|
-1.15
|
| |
2029-53
|
11.55
|
18.04
|
-6.49
|
|
1.88
|
3.12
|
-1.24
|
|
13.43
|
21.16
|
-7.73
|
| |
2054-78
|
11.77
|
21.58
|
-9.81
|
|
1.89
|
3.45
|
-1.55
|
|
13.66
|
25.03
|
-11.37
|
| 1Income rates do not include beginning trust fund balances and cost rates do not include the cost of accumulating target trust fund balances. |
Note: Totals do not necessarily equal the sums of rounded components.
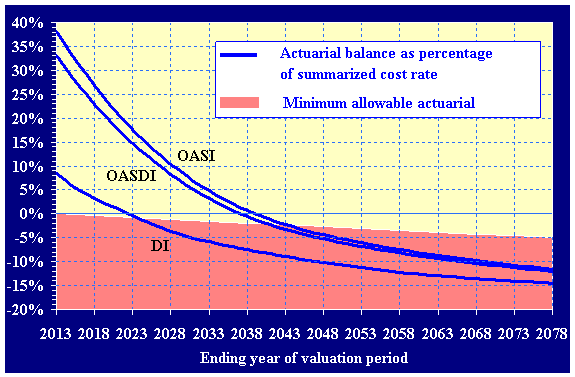
Table IV.B5 shows summarized rates for valuation periods of the first 25, the first 50, and the entire 75 years of the long-range projection period, including the funds on hand at the start of the period and the cost of accumulating a target trust fund balance equal to 100 percent of annual cost by the end of the period. The actuarial balance for each of these three valuation periods is equal to the difference between the summarized income rate and the summarized cost rate for the corresponding period. An actuarial balance of zero for any period would indicate that estimated cost for the period could be met, on average, with a remaining trust fund balance at the end of the period equal to 100 percent of the following year's cost. A negative actuarial balance indicates that, over the period, the present value of income to the program plus the existing trust fund falls short of the present value of the cost of the program plus the cost of reaching a target trust fund balance of 1 year's cost by the end of the period. Combined with a falling trust fund ratio, this signals the possibility of continuing cash-flow deficits, implying that the current-law level of financing is not sustainable.
|
Valuation
period |
OASI
|
|
DI
|
|
Combined
|
||||||||
|---|---|---|---|---|---|---|---|---|---|---|---|---|---|
|
Income
rate |
Cost
rate |
Actuarial
balance |
Income
rate |
Cost
rate |
Actuarial
balance |
Income
rate |
Cost
rate |
Actuarial
balance |
|||||
|
Intermediate:
|
|||||||||||||
| |
25 years:
|
|
|
|
|
|
|
|
|
|
|
|
|
| |
|
2004-28
|
12.45
|
11.28
|
1.17
|
|
2.02
|
2.10
|
-0.08
|
|
14.47
|
13.38
|
1.10
|
| |
50 years:
|
|
|
|
|
|
|
|
|
|
|
|
|
| |
|
2004-53
|
12.02
|
12.80
|
-.78
|
|
1.95
|
2.20
|
-.25
|
|
13.98
|
15.00
|
-1.03
|
| |
75 years:
|
|
|
|
|
|
|
|
|
|
|
|
|
| |
|
2004-78
|
11.90
|
13.46
|
-1.56
|
|
1.94
|
2.27
|
-.33
|
|
13.84
|
15.73
|
-1.89
|
|
Low Cost:
|
|||||||||||||
| |
25 years:
|
|
|
|
|
|
|
|
|
|
|
|
|
| |
|
2004-28
|
12.41
|
10.48
|
1.93
|
|
2.01
|
1.77
|
.24
|
|
14.42
|
12.25
|
2.17
|
| |
50 years:
|
|
|
|
|
|
|
|
|
|
|
|
|
| |
|
2004-53
|
11.95
|
11.37
|
.58
|
|
1.94
|
1.76
|
.18
|
|
13.89
|
13.13
|
.76
|
| |
75 years:
|
|
|
|
|
|
|
|
|
|
|
|
|
| |
|
2004-78
|
11.79
|
11.54
|
.25
|
|
1.92
|
1.76
|
.16
|
|
13.72
|
13.30
|
.41
|
|
High Cost:
|
|||||||||||||
| |
25 years:
|
|
|
|
|
|
|
|
|
|
|
|
|
| |
|
2004-28
|
12.49
|
12.21
|
.28
|
|
2.03
|
2.58
|
-.55
|
|
14.52
|
14.78
|
-.26
|
| |
50 years:
|
|
|
|
|
|
|
|
|
|
|
|
|
| |
|
2004-53
|
12.10
|
14.57
|
-2.47
|
|
1.97
|
2.79
|
-.82
|
|
14.07
|
17.36
|
-3.29
|
| |
75 years:
|
|
|
|
|
|
|
|
|
|
|
|
|
| |
|
2004-78
|
12.03
|
16.03
|
-4.00
|
|
1.95
|
2.92
|
-.97
|
|
13.98
|
18.94
|
-4.96
|
| 1Income rates include beginning trust fund balances and cost rates include the cost of reaching a target trust fund level of 1 year's cost at the end of the period. |
Note: Totals do not necessarily equal the sums of rounded components.
The values in table IV.B5 show that the combined OASDI program is expected to operate with a positive actuarial balance over the 25-year valuation period under the low cost and intermediate assumptions. For the 25-year valuation period the summarized values indicate actuarial balances of 2.17 percent of taxable payroll under the low cost assumptions, 1.10 percent under the intermediate assumptions, and -0.26 percent under the high cost assumptions. Thus, the program is more than adequately financed for the 25-year valuation period under all but the high cost projections. For the 50-year valuation period the OASDI program would have a positive actuarial balance of 0.76 percent under the low cost assumptions, but would have deficits of 1.03 percent under the intermediate assumptions and 3.29 percent under the high cost assumptions. Thus, the program is more than adequately financed for the 50-year valuation period under only the low cost set of assumptions.
For the entire 75-year valuation period, the combined OASDI program would again have actuarial deficits except under the low cost set of assumptions. The actuarial balance for this long-range valuation period is projected to be 0.41 percent of taxable payroll under the low cost assumptions, -1.89 percent under the intermediate assumptions, and -4.96 percent under the high cost assumptions.
Assuming the Trustees' intermediate assumptions are realized, the deficit of 1.89 percent of payroll indicates that financial adequacy of the program for the next 75 years could be restored if the Social Security payroll tax were immediately and permanently increased from its current level of 12.4 percent (combined employee-employer shares) to 14.29 percent. Alternatively, all current and future benefits could be reduced by about 13 percent (or there could be some combination of tax increases and benefit reductions). Changes of this magnitude would be sufficient to eliminate the actuarial deficit over the 75-year projection period. However, because of the projected increase in the average age of the population, projected annual deficits begin in 2018 and increase to levels nearly 6 percent of taxable payroll by the end of the 75-year period.
The large annual deficits at the end of the projection period indicate that the annual cost will very likely continue to exceed tax revenues after 2078 under the intermediate assumptions. As a result, ensuring the sustainability of the system would eventually require larger changes than those needed to restore actuarial balance for the 75-year period. For the infinite future, the actuarial deficit is estimated to be 3.5 percent of taxable payroll under the intermediate assumptions. This means that financial adequacy of the OASDI program could be restored permanently if the combined payroll tax rate were immediately and permanently raised from 12.4 percent to about 15.9 percent, or if all current and future benefits were immediately reduced by 22 percent.
As may be concluded from tables IV.B4 and IV.B5, the financial condition of the DI program is substantially weaker than that of the OASI program for the first 25 years. Summarized over the full 75-year period, however, long-range deficits for the OASI and DI programs under intermediate assumptions are more similar, relative to the level of program costs.
Table IV.B6 presents the components and the calculation of the long-range (75-year) actuarial balance under the intermediate assumptions. The present value of future cost less future tax income over the long-range period, minus the amount of trust fund assets at the beginning of the projection period, amounts to $3.7 trillion. This amount is referred to as the 75-year "open group unfunded obligation." The actuarial deficit (i.e., the negative of the actuarial balance) combines this unfunded obligation with the present value of the "ending target trust fund," and expresses the total as a percentage of the present value of the taxable payroll for the period. The present value of future tax income minus cost, plus starting trust fund assets, minus the present value of the ending target trust fund amounts to -$4.0 trillion. Expressed as a percentage of taxable payroll for the period, this is the actuarial balance of -1.89 percent.
|
Item
|
OASI
|
DI
|
Combined
|
||
|---|---|---|---|---|---|
|
Present value as of January 1, 2004 (in billions):
|
|
|
|
||
| |
|
a. Payroll tax revenue
|
$22,359
|
$3,797
|
$26,156
|
| |
|
b. Taxation of benefits revenue
|
1,426
|
117
|
1,543
|
| |
c. Tax income (a + b)
|
23,785
|
3,913
|
27,699
|
|
| |
d. Cost
|
28,183
|
4,745
|
32,928
|
|
| |
e. Cost minus tax income (d - c)
|
4,397
|
832
|
5,229
|
|
| |
f. Trust fund assets at start of period
|
1,355
|
175
|
1,531
|
|
| |
g. Open group unfunded obligation (e - f)
|
3,042
|
656
|
3,699
|
|
| |
h. Ending target trust fund1
|
248
|
38
|
286
|
|
| |
i. Income minus cost, plus assets at start of period, minus ending target trust fund
(c - d + f - h = - g - h) |
-3,290
|
-694
|
-3,985
|
|
| |
j. Taxable payroll
|
211,182
|
211,182
|
211,182
|
|
|
Percent of taxable payroll:
|
|
|
|
||
| |
Actuarial balance (100 × i ÷ j)
|
-1.56
|
-.33
|
-1.89
|
|
| 1The calculation of the actuarial balance includes the cost of accumulating a target trust fund balance equal to 100 percent of annual cost by the end of the period. |
Note: Totals do not necessarily equal the sums of rounded components
As shown in the previous section, a negative actuarial balance (or an actuarial deficit) provides one measure of the unfunded obligation of the program over a period of time. Two additional measures of OASDI unfunded obligations under the intermediate assumptions are presented below.
Consistent with practice since 1965, this report focuses on the 75-year period (from 2004 to 2078 for this report) for the evaluation of the long-run financial status of the OASDI program on an open group basis (i.e., including taxes and cost for past, current and future participants through the year 2078). Table IV.B7, in its second line, shows that the present value of the open group unfunded obligation for the program over that period is $3.7 trillion. The open group measure indicates the adequacy of financing over the period as a whole for a program financed on a pay-as-you-go basis. On this basis, payroll taxes of some future participants are included, through the year 2078, but some or all of their future benefits, for years after 2078, are excluded.
Table IV.B7 also presents the 75-year unfunded obligation as percentages of future OASDI taxable payroll and gross domestic product (GDP) through 2078. The 75-year unfunded obligation as a percentage of taxable payroll is less than the actuarial deficit, because it excludes the ending target trust fund value (see table IV.B6).
However, there are limitations involved in using summarized measures for a valuation period of only 75 years. First, overemphasis of summary measures (such as the actuarial balance and open group unfunded obligation) that are limited to the 75-year period can lead to incorrect perceptions and policy that fails to address sustainability for the more distant future. This can be addressed by considering the trend in trust fund ratios toward the end of the period.
A second limitation is that continued, and possibly increasing annual shortfalls after the period are not reflected in the 75-year summarized measures. In order to provide a fuller description of long-run unfunded obligations of the OASDI program, this section presents estimates of obligations that extend to the infinite horizon. The extension assumes that the current-law OASDI program and the demographic and economic trends used for the 75-year projection continue indefinitely. The values in table IV.B7 indicate that extending the calculations beyond 2078 adds $6.7 trillion to the estimated unfunded obligation, making the infinite future open group unfunded obligation $10.4 trillion. The $6.7 trillion increment reflects a significant financing gap for OASDI after 2078.
In last year's report the unfunded obligation over the infinite horizon was reported as $10.5 trillion in present value as of January 1, 2003. The change to the later valuation date for this report, January 1, 2004, tends to increase the measured deficit, by about $0.6 trillion. However, the effects of changes in data and methods more than offset this increase. See section IV.B.8 for details.
As noted in the previous section, the $10.4 trillion infinite future open group unfunded obligation may also be expressed as a percentage of the taxable payroll over that period. This actuarial deficit for the infinite future is 3.5 percent of taxable payroll under the intermediate assumptions, down from an estimated 3.8 percent of payroll in last year's report. This unfunded obligation can also be expressed as a percentage of GDP over the infinite future and is 1.2 percent on that basis. These relative measures of the unfunded obligation over the infinite future express its magnitude in relation to the resources that are potentially available to finance the shortfall.
| |
Present
value |
|
Expressed as a percentage
of future payroll and GDP |
|
|
Taxable
payroll |
GDP
|
|||
|
Unfunded obligation for 1935 through the infinite horizon 1
|
$10.4
|
|
3.5
|
1.2
|
|
Unfunded obligation for 1935 through 2078 2
|
3.7
|
|
1.8
|
.7
|
| 1Present value of future cost less future taxes, reduced by the amount of trust fund assets at the beginning of 2004. Expressed as percentage of payroll and GDP for the future period 2004 through infinite horizon. 2Present value of future cost less future taxes through 2078, reduced by the amount of trust fund assets at the beginning of 2004. Expressed as percentage of payroll and GDP for the future period 2004 through 2078. |
Notes:
1. The present values of future taxable payroll for 2004-2078 and for 2004 through the infinite horizon are $211.2 trillion and $295.5 trillion, respectively.
2. The present values of GDP for 2004-2078 and for 2004 through the infinite horizon are $567.3 trillion and $843.8 trillion, respectively.
The future unfunded obligation of the OASDI program may also be viewed from a generational perspective. This perspective is generally associated with assessment of the financial condition of a program that is intended or required to be financed on a fully-advance-funded basis. However, analysis from this perspective can also provide insights into the implications of pay-as-you-go financing, the basis that has been used for the OASDI program.
The first line of table IV.B8 shows that the present value of future cost less future taxes over the next 100 years for all current participants equals $12.7 trillion. For this purpose, current participants are defined as individuals who are age 15 or older at the beginning of 2004. Subtracting the current value of the trust fund (the accumulated value of past OASDI taxes less cost) gives a closed group (excluding only future participants) unfunded obligation of $11.2 trillion. This value represents the shortfall of lifetime contributions for all past and current participants relative to the lifetime costs associated with their generations. For a fully-advance-funded program this value would be equal to zero.
For the Social Security benefits to be adequately financed for the infinite future, the contributions or benefits of current and future participants in the system must be adjusted to fully offset the shortfall due to past and current participants. Future participants, as a whole, are projected to pay, in present value, taxes that are approximately $0.8 trillion more than the cost of providing benefits they are scheduled to receive over the infinite future. Thus, the remaining long run financing gap that program reforms must ultimately close is $10.4 trillion in present value. This can be achieved by raising additional revenue or reducing benefits (or some combination) for current and future participants so that the present value of the additional revenue or reduced benefits for the infinite future equals $10.4 trillion.
| |
Present
value |
|
Expressed as a percentage
of future payroll and GDP |
|
|
Taxable
payroll |
GDP
|
|||
|
Present value of future cost less future taxes for current participants
|
$12.7
|
|
4.3
|
1.5
|
|
Less current trust fund
(tax accumulations minus expenditures to date for past and current participants) |
1.5
|
|
.5
|
.2
|
|
Equals unfunded obligation for past and current participants 1
|
11.2
|
|
3.8
|
1.3
|
|
Plus present value of cost less taxes for future participants
for the infinite future |
-.8
|
|
-.3
|
-.1
|
|
Equals unfunded obligation for all participants through the infinite
horizon |
10.4
|
|
3.5
|
1.2
|
| 1This concept is also referred to as the closed group unfunded obligation. |
Notes:
1. The present value of future taxable payroll for 2004 through the infinite horizon is $295.5 trillion.
2. The present value of GDP for 2004 through the infinite horizon is $843.8 trillion.
3. Totals do not necessarily equal the sums of rounded components.
The long-range test of close actuarial balance applies to a set of 66 separate valuation periods beginning with the first 10-year period, and including the periods of the first 11 years, the first 12 years, etc., up through the full 75-year projection period. Under the long-range test, the summarized income rate and cost rate are calculated for each of these valuation periods. The long-range test is met if, for each of the 66 valuation periods, the actuarial balance is not less than zero or is negative by, at most, a specified percentage of the summarized cost rate for the same time period. The percentage allowed for a negative actuarial balance is 5 percent for the full 75-year period. For shorter periods, the allowable percentage begins with zero for the first 10 years and increases uniformly for longer periods, until it reaches the maximum percentage of 5 percent allowed for the 75-year period. The criterion for meeting the test is less stringent for the longer periods in recognition of the greater uncertainty associated with estimates for more distant years.
When a negative actuarial balance in excess of the allowable percentage of the summarized cost rate is projected for one or more of the 66 separate valuation periods, the program fails the long-range test of close actuarial balance. Being out of close actuarial balance indicates that the program is expected to experience financial problems in the future and that ways of improving the financial status of the program should be considered. The sooner the actuarial balance is less than the minimum allowable balance, expressed as a percentage of the summarized cost rate, the more urgent is the need for corrective action. It is recognized that necessary changes in program financing or benefit provisions should not be put off until the last possible moment if future beneficiaries and workers are to effectively plan for their retirement.
Table IV.B9 presents a comparison of the estimated actuarial balances with the minimum allowable balance (or maximum allowable deficit) under the long-range test, each expressed as a percentage of the summarized cost rate, based on the intermediate estimates. Values are shown for only 14 of the valuation periods: those of length 10 years, 15 years, and continuing in 5-year increments through 75 years. However, each of the 66 periods--those of length 10 years, 11 years, and continuing in 1-year increments through 75 years--is considered for the test. These minimum allowable balances are calculated to show the limit for each valuation period resulting from the graduated tolerance scale. The patterns in the estimated balances as a percentage of the summarized cost rates, as well as that for the minimum allowable balance, are presented graphically in figure IV.B4 for the OASI, DI and combined OASDI programs. Values shown for the 25-year, 50-year, and 75-year valuation periods correspond to those presented in table IV.B5.
For the OASI program, the estimated actuarial balance as a percentage of the summarized cost rate exceeds the minimum allowable for valuation periods of length 10 years through 40 years, under the intermediate estimates. For valuation periods of length greater than 40 years, the estimated actuarial balance is less than the minimum allowable. For the full 75-year long-range period the estimated actuarial balance reaches -11.57 percent of the summarized cost rate, for a shortfall of 6.57 percent, from the minimum allowable balance of -5.0 percent of the summarized cost rate. Thus, although the OASI program satisfies the short-range test of financial adequacy (as discussed earlier), it is not in long-range close actuarial balance.
For the DI program, the estimated actuarial balance as a percentage of the summarized cost rate exceeds the minimum allowable balance for valuation periods of length 10 through 20 years under the intermediate estimates. For valuation periods of length greater than 20 years, the estimated actuarial balance is less than the minimum allowable. For the full 75-year long-range period the estimated actuarial balance reaches -14.52 percent of the summarized cost rate, for a shortfall of 9.52 percent, from the minimum allowable balance of -5.0 percent of the summarized cost rate. Thus, the DI program, although meeting the short-range test of financial adequacy, is not in long-range close actuarial balance.
Financing for the DI program is much less adequate than for the OASI program during the first 25 years even though long-range actuarial deficits are more comparable over the entire 75-year period. This occurs because much more of the increase in the long-range cost due to the aging of the large baby-boom generation occurs earlier for the DI program than for the OASI program. As a result, tax rates that are relatively more adequate for the OASI program during the first 25 years become relatively less adequate later in the long-range period.
For the OASDI program, the estimated actuarial balance as a percentage of the summarized cost rate exceeds the minimum allowable balance for valuation periods of length 10 years through 37 years. For valuation periods of length greater than 37 years, the estimated actuarial balance is below the minimum allowable balance. The size of the shortfall from the minimum allowable balance rises gradually, reaching 7.00 percent of the summarized cost rate for the full 75-year long-range valuation period. Thus, although the OASDI program satisfies the short-range test of financial adequacy, it is out of long-range close actuarial balance.
The OASI and DI programs, both separate and combined, were also found to be out of close actuarial balance in last year's report. The estimated deficits for the OASI, DI, and combined OASDI programs in this report are similar to those shown in last year's report.
Note: Totals do not necessarily equal the sums of rounded components.
Summarized income and cost rates, along with their components, are presented in table IV.B10 for 25-year, 50-year, and 75-year valuation periods. Income rates reflect the scheduled payroll tax rates and the projected income from the taxation of benefits expressed as a percentage of taxable payroll. The current combined payroll tax rate of 12.4 is scheduled to remain unchanged in the future. In contrast, the projected income from taxation of benefits, expressed as a percent of taxable payroll, is expected to increase continually throughout the long-range period. This is because increasing income from taxation of benefits reflects not only rising benefit and income levels, but also the fact that benefit-taxation threshold amounts are not indexed. Summarized income rates also include the starting trust fund balance. Summarized cost rates include the cost of reaching a target trust fund of 100 percent of annual cost at the end of the period in addition to the cost included in the annual cost rates.
Annual income rates and their components are available on the internet at www.socialsecurity.gov/OACT/TR/TR04/lrIndex.html.
It may be noted that the payroll tax income expressed as a percentage of taxable payroll is slightly smaller than the actual tax rates in effect for each period. This results from the fact that all OASDI income and cost amounts presented in this report are computed on a cash basis, i.e., amounts are attributed to the year in which they are actually received by, or expended (payable) from, the fund, while taxable payroll is attributed to the year in which earnings are paid. Because earnings are paid to workers before the corresponding payroll taxes are credited to the funds, payroll tax income for a particular year reflects a combination of the taxable payrolls from that year and from prior years, when payroll was smaller. Dividing payroll tax income by taxable payroll for a particular year, or period of years, will thus generally result in an income rate that is slightly less than the applicable tax rate for the period.
.
Note: Totals do not necessarily equal the sums of rounded components.
The estimated effects of various changes from last year's report to this report on the long-range actuarial balance under the intermediate assumptions are listed (by category) in table IV.B11.
|
Item
|
OASI
|
DI
|
Combined
|
||
|---|---|---|---|---|---|
|
Shown in last year's report:
|
|||||
| |
Income rate
|
11.85
|
1.93
|
13.78
|
|
| |
Cost rate
|
13.41
|
2.29
|
15.70
|
|
| |
Actuarial balance
|
-1.56
|
-.35
|
-1.92
|
|
|
Changes in actuarial balance due to changes in:
|
|||||
| |
|
Legislation / Regulation
|
.00
|
.00
|
.00
|
| |
|
Valuation period 1
|
-.06
|
-.01
|
-.07
|
| |
|
Demographic data and assumptions
|
+.02
|
.00
|
+.02
|
| |
|
Economic data and assumptions
|
-.03
|
-.01
|
-.04
|
| |
|
Disability data and assumptions
|
.00
|
+.03
|
+.03
|
| |
|
Programmatic data and methods
|
+.07
|
+.02
|
+.09
|
| |
Total change in actuarial balance
|
.00
|
+.03
|
+.03
|
|
|
Shown in this report:
|
|||||
| |
Actuarial balance
|
-1.56
|
-.33
|
-1.89
|
|
| |
Income rate
|
11.90
|
1.94
|
13.84
|
|
| |
Cost rate
|
13.46
|
2.27
|
15.73
|
|
| 1In changing from the valuation period of last year's report, which was 2003-77, to the valuation period of this report, 2004-78, the relatively large negative annual balance for 2078 is included. This results in a larger long-range actuarial deficit. The fund balance at the end of 2003, i.e., at the beginning of the projection period, is included in the 75-year actuarial balance. |
Note: Totals do not necessarily equal the sums of rounded components.
Since the last report, one legislative change that affects the financing of the Social Security program, the Medicare Prescription Drug, Improvement, and Modernization Act of 2003, was enacted in time for inclusion in this report (see section III.B). This Act includes Federal subsidies for employers who provide drug coverage for their employees. The subsidy will lower the employers net cost for employee compensation, which is expected to be partially offset by a small estimated increase in wages subject to OASDI payroll taxes. The effect of this change is estimated to increase the long-range OASDI actuarial balance by a negligible amount (less than 0.005 percent of taxable payroll).
In changing from the valuation period of last year's report, which was 2003-77, to the valuation period of this report, 2004-78, the relatively large negative annual balance for 2078 is included. This results in a larger long-range actuarial deficit. (Note that the fund balance at the end of 2003, i.e., at the beginning of the projection period, is included in the 75-year actuarial balance.)
Ultimate demographic assumptions are unchanged from last year's report. However, recently available population undercount estimates for 2000 from the Census Bureau are incorporated into the starting population. Including these undercount estimates results in a decrease in the Social Security Area population for 2000 of about 3 million people and a substantial change in the age-sex distribution of the population. In particular, the number of women was reduced substantially. This change results in higher covered worker rates for females than estimated in last year's report. Additionally, fertility rates during the first 25 years of the projection period were revised downward based on newly available birth data from the National Center for Health Statistics (NCHS) for 2000 through 2002. The new undercount estimates result in an improvement in the long-range actuarial balance; whereas the revised fertility rates worsen the balance. Overall, the updates to the demographic data result in an increase (improvement) in the long-range actuarial balance of about 0.02 percent of taxable payroll.
The ultimate assumed rate of change in the CPI (2.8 percent) is changed from that used in last year's report (3.0 percent) in order to reflect an expectation of somewhat lower price inflation. Lowering the ultimate assumed rate of inflation results in a reduction in the long-range actuarial balance. In addition, the projected real interest rate on trust fund investments during the first 10 years of the projection period is lower this year, consistent with recent data. This change also has a negative effect on the actuarial balance. However, several changes in starting values for the economic assumptions and in the transition to ultimate economic assumptions combine to partially offset these negative effects on the long-range actuarial balance. The net effect of all these economic changes is a reduction in the long-range actuarial balance of 0.04 percent of taxable payroll.
Two disability assumptions were revised from those in last year's report. First, in last year's report the number of individuals awarded disabled-worker benefits was increased in order to reflect an improvement in the administrative procedures to identify individuals who may have attained OASDI insured status after becoming entitled to SSI benefits. Subsequently, projections of the number of additional disability beneficiaries from this improvement in the administrative procedures have been revised downward based on data available since the last report. As a result, the projected increase in the number of these additional disability beneficiaries was lowered to about 4,500 per year or roughly half the number used in the 2003 report. Second, based on an analysis of data for years since 1985, ultimate female disability recovery rates were raised to be closer to male ultimate rates. These changes improve the long-range actuarial balance by about 0.03 percent of payroll.
Several methodological improvements and updates of program-specific data were made for projections in the 2004 report. All of these changes to programmatic data and methods result in a combined increase in the long-range OASDI actuarial balance of about 0.09 percent of payroll including interaction. First, changes were made to the projections of income from taxation of benefits. The changes improve consistency with the short-range estimates recently provided by the Office of Tax Analysis (OTA) at the Department of the Treasury. Recent data and projections from OTA have indicated significant increases in this revenue source. While the ultimate projected relationship between benefits and tax revenues remains unchanged, the effect of the new numbers is to increase the long-range actuarial balance by about 0.03 percent of payroll. Second, new beneficiary samples were developed and improvements were made in the projection of average newly awarded worker benefit levels. The largest single change in methods for the 2004 report was for the projection of benefit levels for high earners represented in the sample. The sample earnings histories are projected into the future to simulate earnings of subsequent generations. A number of adjustments are needed in this process. Improvements were made in the method used to adjust for the relatively higher taxable maximum earnings level in recent years due to ad hoc increases in the past. Together these changes to the projection of average benefit levels improve the long-range actuarial balance by about 0.16 percent of payroll. The third significant change in methodology modified the effect of other immigrants (those who are not admitted to the U.S. for legal permanent residence) on projected fully insured rates. This change results in higher projected fully-insured rates and decreases the long-range actuarial balance by about 0.08 percent of payroll. Several other smaller changes to methodologies had largely offsetting effects on the long-range actuarial balance.
If no changes in assumptions or methods were made for this report and actual experience had met expectations since the last report, the OASDI long-range actuarial deficit would, nonetheless, have increased by 0.07 percent of taxable payroll from the level estimated for last year's report due to the change in the valuation period (see table IV.B11). The changes made in data, assumptions, and methods for this report, together, more than offset the increase in the deficit due to the new valuation period. This is indicated by the total 0.03 percent decrease in the deficit, which, after rounding, reduces the deficit from 1.92 percent to 1.89 percent of payroll.
The effects of changes made in this report can also be illustrated by comparing the annual (cash-flow) balances for this and the prior year's report. Figure IV.B5 provides this comparison for the combined OASDI program over the long range.
The projected annual deficits in this report are close to those of last year's report through about 2045. After 2045, however, the annual deficits in this year's report are significantly smaller. The annual deficit for 2077 is 5.86 percent of taxable payroll in this year's report compared to 6.50 percent for 2077 in last year's report. Higher female covered worker rates and other associated effects of the revision of the census undercount improved the 2077 annual deficit by roughly 0.25 percent of payroll. Having about the same effect on the 2077 annual deficit is the improvement in the projection of benefit levels for high earners represented in the long-range sample of newly awarded worker beneficiaries. Much of the remaining improvement in the 2077 annual deficit resulted from an improvement in the method for projecting increases in labor force participation rates at older ages, as the longevity and health status at these ages improve.
1Adjustments are made to include deemed wage credits based on military service for 1983-2001, and to reflect the lower effective tax rates (as compared to the combined employee-employer rate) which apply to multiple-employer "excess wages," and which did apply, before 1984, to net earnings from self-employment and, before 1988, to income from tips.
|
|
|
|
|
|
| |
Privacy Policy | Website Policies & Other Important Information | Site Map | Actuarial Publications | 3/23/2004 |