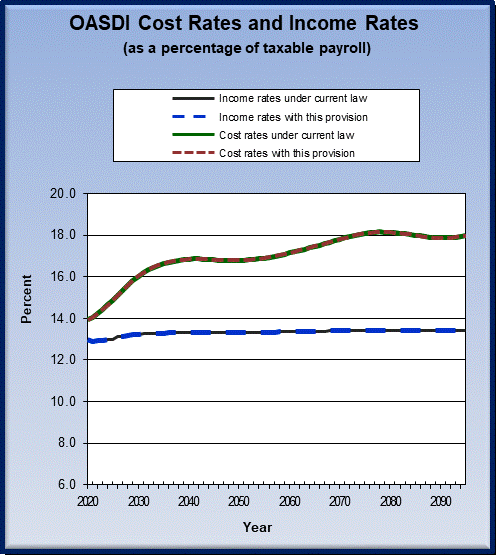
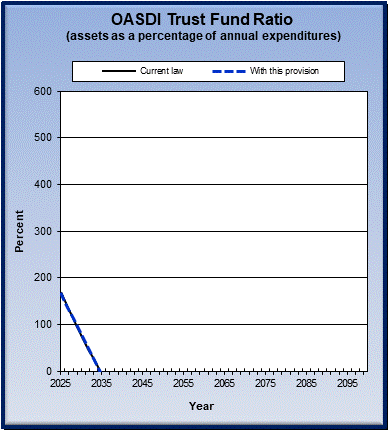
Summary Measures and Graphs
Description of Proposed Provision:
B7.9: Beginning for newly eligible retired workers and spouses in 2032, all claimants who are married would receive a specified joint-and-survivor annuity benefit (i.e., surviving spouses would receive 75 percent of the decedents' benefits, in addition to their own) that would be payable if both were still alive. Initial benefits would be actuarially adjusted to keep the expected value of benefits equivalent to what would otherwise be current law.
Estimates based on the intermediate assumptions
of the 2025 Trustees Report
| Summary Measures | |||||||
|---|---|---|---|---|---|---|---|
| Current law [percent of payroll] |
Change from current law [percent of payroll] |
Shortfall eliminated | |||||
| Long-range actuarial balance |
Annual balance in 75th year |
Long-range actuarial balance |
Annual balance in 75th year |
Long-range actuarial balance |
Annual balance in 75th year |
||
| -3.82 | -4.84 | -0.01 | -0.30 | -0% | -6% | ||

|

|