Testimony of Stephen C. Goss, Chief Actuary,
Social Security Administration
“The Foreseen Trend in the Cost of Disability Insurance Benefits”
Before The Senate Finance Committee
July 24, 2014
Chairman Wyden, Ranking Member Hatch, and members of the committee, thank you very much for the invitation to speak to you today on this very important subject. We are all focused on the actuarial status of the Social Security Disability Insurance program, because the reserves are projected to become depleted late in 2016. Without legislative action, benefits scheduled in the law will not be payable in full on a timely basis once these reserves are depleted. Therefore, I will present to you today the reasons, which we have long anticipated and understood, for the recent rise in DI cost and the shortfall we face.
Background
Many analysts have raised questions about the “sustainability” of the recent period of rapid growth in the numbers of DI beneficiaries and the cost of their benefits. I am glad to report that this period of rapid growth: (1) was foreseen, (2) can be explained, and (3) is now at its predicted end.
The figure below shows that the cost of DI benefits declined from just under 0.6 percent of GDP in 1980 to just over 0.4 percent of GDP in 1990, and then increased to nearly 0.9 percent of GDP by 2010. These changes are almost entirely explained by changes in the population and the economy.
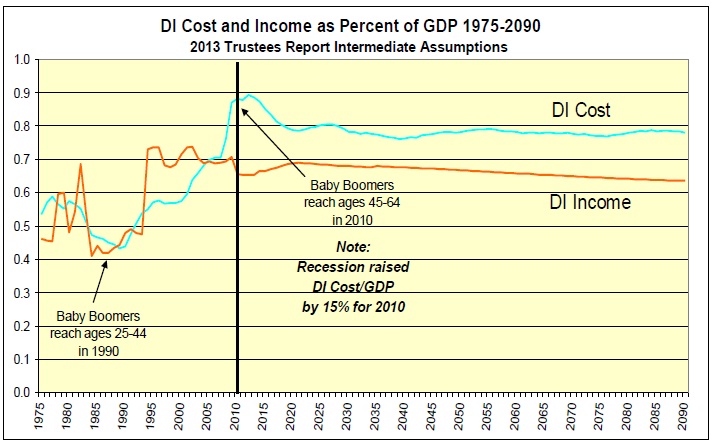
Between 1970 and 1990, there was a dramatic change in the age distribution of the working-age population, as the baby boomers (born 1946-1965) entered young adulthood. This caused employment and GDP to rise much more than DI cost, as the baby boomers were still under age 45 by 1990. However, from 1990 to 2010 the baby boomers moved from young adults under age 45 to older working ages 45-64. Because they were replaced at younger adult ages by low-birthrate generations born after 1965, the share of working-age adults who were in disability-prone ages (45-64) grew rapidly from 1990 to 2010. The great recession of 2008 resulted in lower GDP, making DI cost relative to GDP rise even more by 2010. After our economy fully recovers, we project DI cost will stabilize at just under 0.8 percent of GDP.
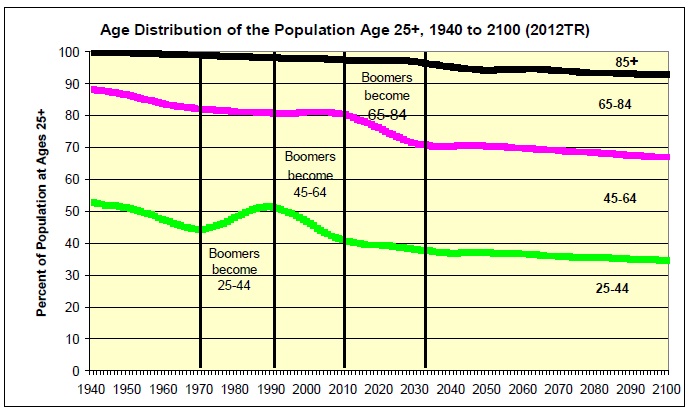
Over the next 20 years, through about 2035, the share of the working age population that is aged 45-64 (disability-prone ages) will shrink rapidly, putting a halt to the rise in DI cost. This population shift has also been foreseen for decades.
The rise in DI cost as percent of GDP between 1990 and 2010, due to the aging of the baby boomers and the lower birth rates following them, is a prelude to the increase in retirement cost our society faces over the next 20 years. The drop in birth rates after 1965 makes the rising retirement cost as a percent of GDP just as predictable as the rise in disability cost. What is most important to note about these changes in the population is that they are permanent shifts in the age distribution that are now complete for DI and will be complete in 20 years for OASI.
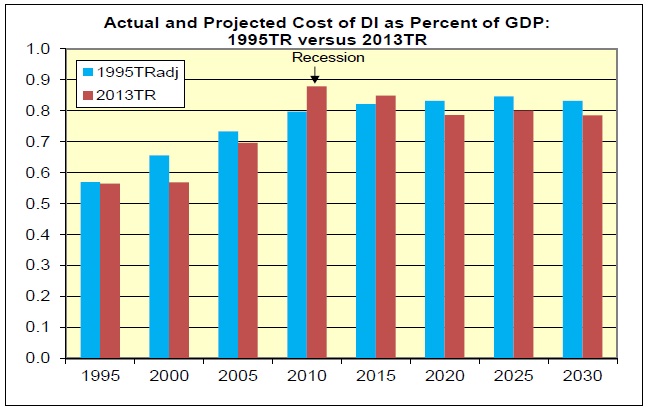
In the 1995 Trustees Report, we projected that the cost of DI benefits would rise from 0.6 percent of GDP in 1995 to 0.9 percent by 2025. Since 1995, historical GDP has been revised upward (by 5 percent for 1994 for example). Adjusting for this change in estimated GDP since 1995 through the levels estimated for 2013, we see the 1995 Trustees Report projected DI cost represents 0.85 percent of GDP by 2025. Except for the effects of the unanticipated recession that started in 2008 (with full recovery expected by about 2020), actual DI cost as a percent of GDP has been and is now projected to be lower than expected in 1995.
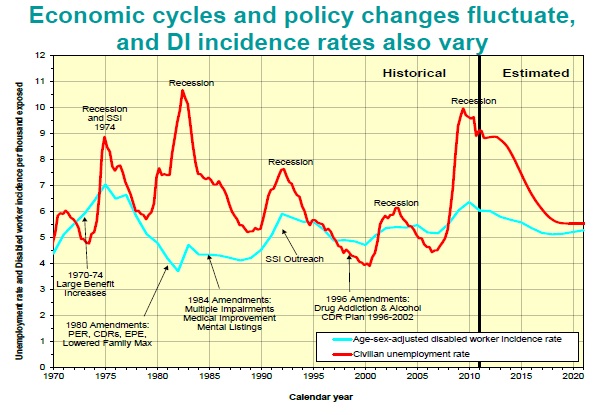
The implications of past economic cycles and various changes in the law on DI cost can be seen by their effects on disabled worker “incidence rates,” which are the percent of insured workers who become newly disabled in a year. The figure below compares the incidence rate (adjusted for changes in the age distribution of the population) to the civilian unemployment rate.
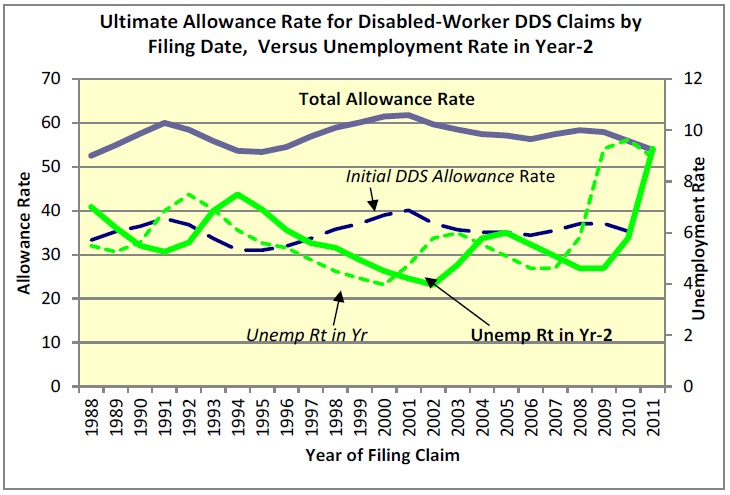
During recessions, applications for DI benefits rise, but the percent of applications that are approved for benefits generally declines because the standard for qualifying for DI benefits is based on the ability to do work that exists in the economy, whether or not job openings are plentiful at the time. The figure below shows how initial allowance rates by the state Disability Determination Services (DDS), and total allowance rates, including those allowed at appeal, respond to increases and decreases in disability applications (claims) as unemployment rises and falls. Allowance rates change counter to the civilian unemployment rate with about a 2-year lag, as many applicants do not apply immediately following job loss while they are seeking employment or receiving unemployment compensation.
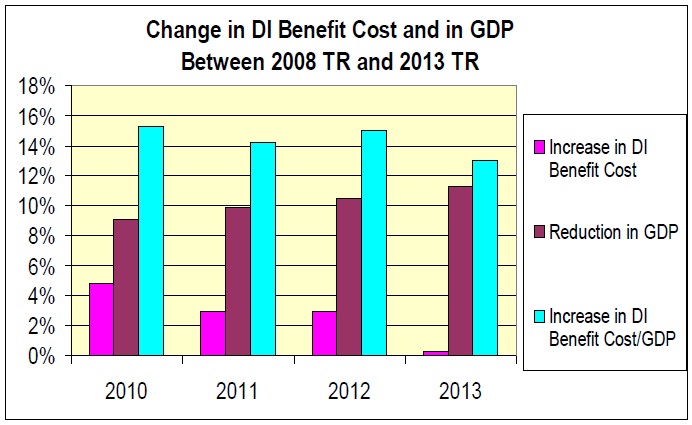
The effect of the recent recession is particularly noteworthy because it illustrates that the change in DI cost as percent of GDP in an economic downturn is affected far more by a drop in GDP than by a rise in DI cost. Compared to our projections in the 2008 Trustees Report where no recession was anticipated, DI cost turned out to be less than 3 percent above the level expected, but GDP turned out to be more than 10 percent lower than expected.
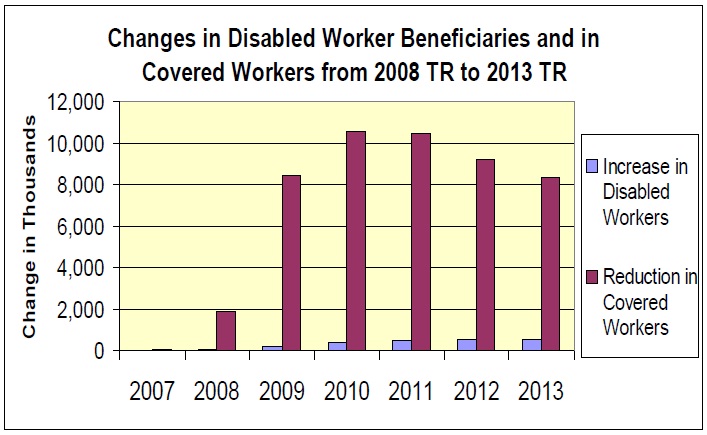
The difference between the unanticipated reduction in employment and the increase in DI beneficiaries is even more dramatic. For 2010, the number of workers with earnings in covered employment was more than 10 million lower than projected in the 2008 Trustees Report. On the other hand, the increase in the number of disabled worker beneficiaries was only about 0.3 million more than projected.
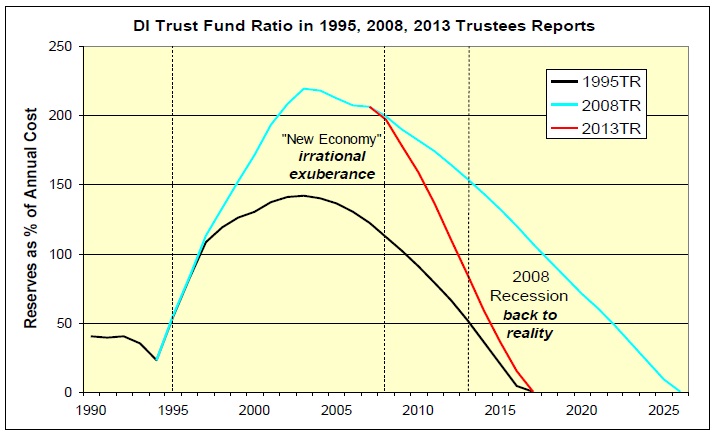
Over longer periods, however, the unanticipated effects of specific economic cycles tend to offset one another. In 1995, the Trustees projected that the DI Trust Fund reserves would deplete in 2016. The figure below shows that this projection was quite accurate, even though the Trustees anticipated neither the period of extraordinary and unsustainable economic growth and the positive trust fund buildup experienced between 1995 and 2005, nor the recession of 2008, which essentially offset the positive effects between 1995 and 2005.
Why Did the Number of Disabled Worker Beneficiaries Increase from 1980 to 2010?
The change in DI cost is closely related to changes in the numbers of disabled worker beneficiaries. This makes sense because average benefit levels are designed to roughly keep pace with the average wage level, but have actually fallen short of that. Between 1980 and 2010, the total annual DI benefit cost per disabled worker rose from $5,445 to $15,139, an increase of roughly 3.5 percent per year on average. During the same period, the national average wage index (AWI) grew substantially faster at an average rate of 4.1 percent per year.
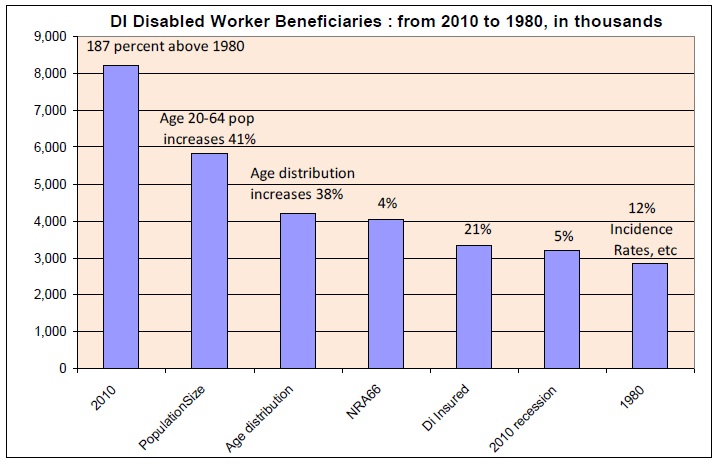
Between 1980 and 2010, the number of disabled worker beneficiaries nearly tripled from 2.9 million to 8.2 million worker beneficiaries. This 187 percent increase is explainable largely by the overall growth in the working age population (disabled worker benefits are payable only until the normal retirement age, now 66), the change in the age distribution of this population, changes in employment, insured status and disability incidence rates for women, and the recent severe recession.
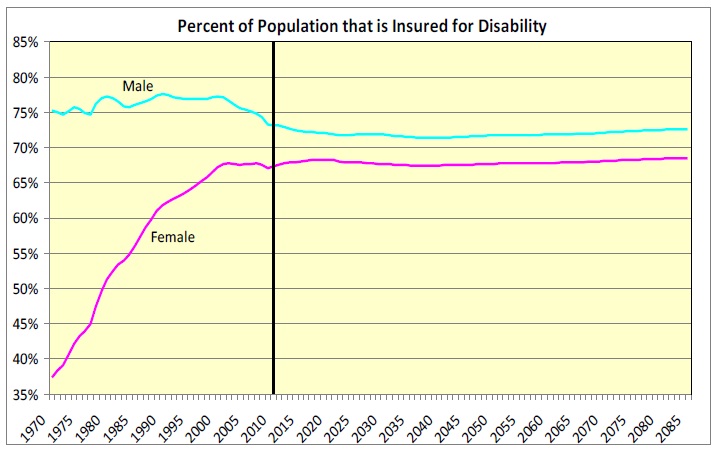
The increase in the percent of working age women who have worked consistently enough to be disability insured is remarkable, nearly doubling since 1970.
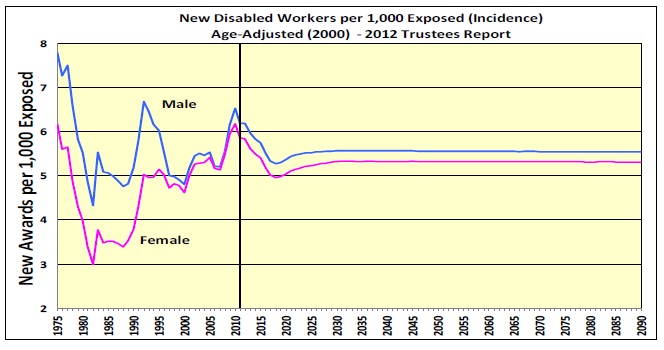
In addition, disability incidence rates increased for women, as their likelihood of being insured increased. Incidence rates are now close to the level experienced for men.
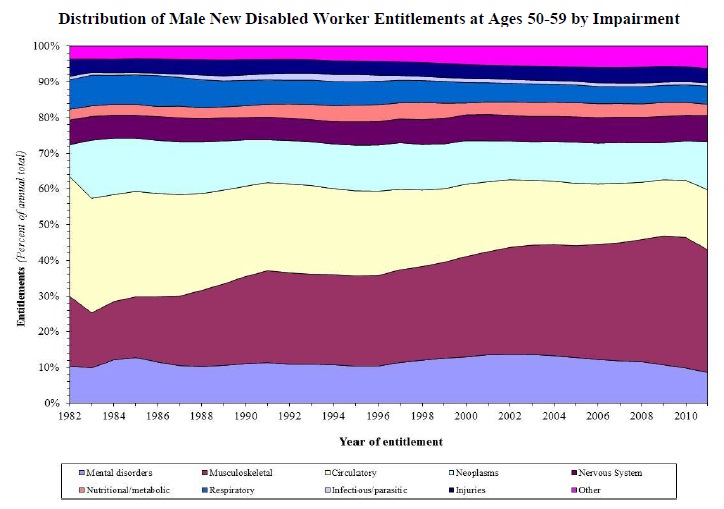
Considerable attention has been focused on disability adjudication standards. Many have raised questions about the distribution of newly entitled disabled workers by impairment diagnosis. This is a particularly important question for women who have experienced such large increases in the likelihood of being insured and the likelihood of becoming disabled. We have looked at the historical trend in this distribution by age group.
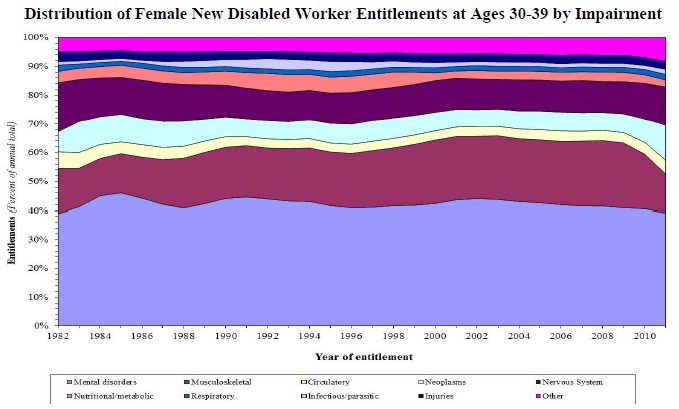
For younger women, the distribution has stayed remarkably consistent over the past three decades. The distribution is similar for men.
For older women and men becoming newly entitled for disabled worker benefits, the distribution has also remained consistent over time with two exceptions. We show the trend for males below because the effects of the exceptions are more apparent than for women. The share of new beneficiaries with musculoskeletal impairments has increased substantially, while the share with circulatory impairments has declined. However, the combined share for these two diagnosis groups has remained about the same.
Disabled Worker Beneficiary Prevalence Rates
There are many ways of looking at the growth in the number of disabled worker beneficiaries. Care should be exercised in selecting which years and which concepts are most helpful in explaining change over time. In addition to changes in numbers of beneficiaries, we can look at changes in “prevalence rates.” Prevalence rates tell us the percent of the insured population that is receiving benefits currently. Care must be taken with prevalence rates as changes in the age distribution of the insured population can have a profound effect on the overall “gross” prevalence rate. This is particularly the case for gross prevalence rates between 1990 and 2010, when the working age population was getting older with the aging of the baby boomers.
Disabled worker prevalence rates can also be considered more narrowly by viewing these rates separately by gender and age groups. Of course, this approach omits from consideration the effects of increased population size, changes in the age distribution of the population, and changes in the percent of the population that is insured. Even in this specific analysis, care is required to avoid any misunderstanding of changes over time.
The figure below shows that male disabled worker prevalence rates at ages 35-39 and 50-54 increased significantly after 2007 as the recession began to reduce employment and cause some additional numbers of individuals to apply for benefits.
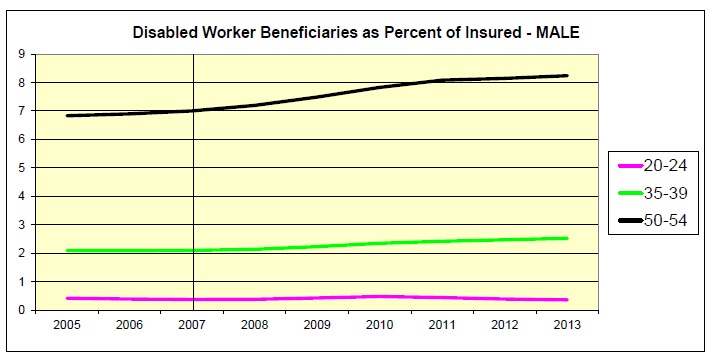
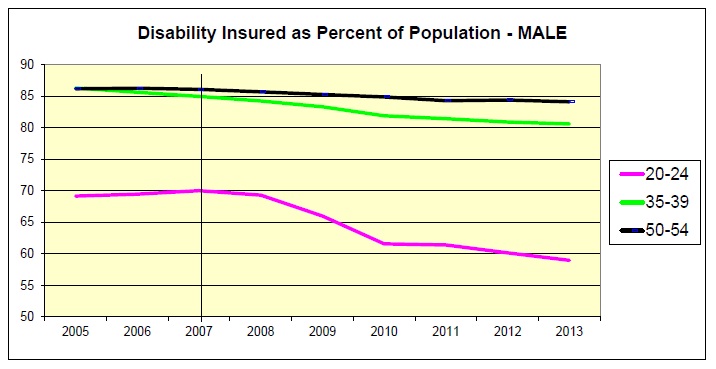
However, the prevalence rates increased not only because more workers applied and started to receive benefits, but also because the number of individuals who maintained disability-insured status was reduced by the recession. As seen below, the reduced employment rates in the recent recession reduced the percent of the population that has had sufficient recent earnings to maintain insured status for disability. This reduction in the number of insured individuals directly increases the prevalence rate. Therefore, increases in prevalence rates in hard economic times result not only from more individuals applying for benefits, but also from fewer workers maintaining their insured status.
Adjustments to Financing or Cost Needed Soon
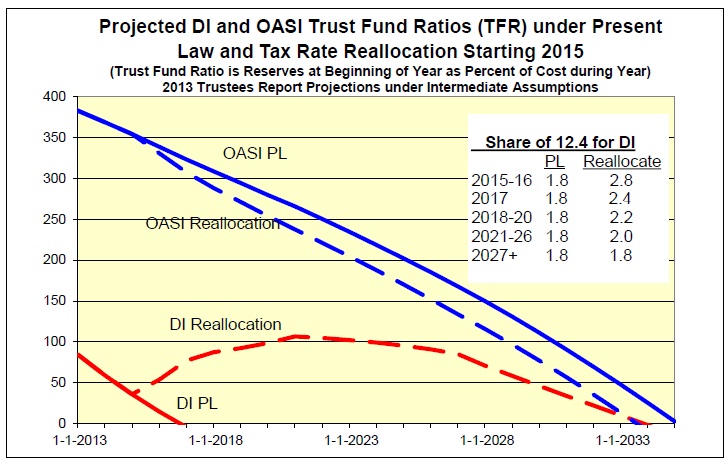
Because the DI Trust Fund reserves are now projected to become depleted late in 2016, with continuing tax income sufficient to cover only 80 percent of the scheduled benefits at that time, change is needed soon. Numerous possibilities are available for adjusting revenue or benefit levels for the DI program, and for the Social Security OASDI program as a whole.
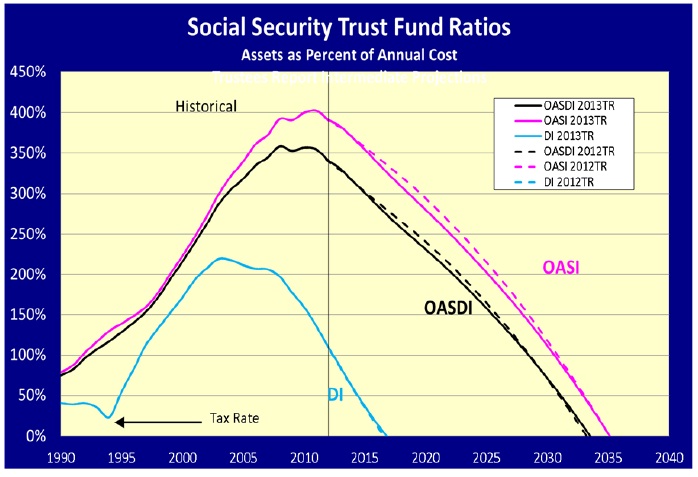
The projected shortfall requires that either scheduled revenues be increased by 25 percent, or cost be reduced by 20 percent, or some combination of these approaches. Because the trust finds cannot by law borrow, adjustments before reserve depletion are essential if abrupt cuts in benefits are to be avoided.
Given the immediacy of the need, one option to avoid sudden cuts in DI benefits is to enact a temporary tax-rate reallocation between the OASI and DI Trust Funds. Such reallocations have been enacted numerous times in the past, most recently in 1994 when the DI Trust Fund was just 8 months away from reserve depletion. The following figure illustrates just one possible tax rate reallocation that the Congress may consider. This approach would cause a temporary reallocation of a part of the OASI tax rate to the DI program, sufficient to equalize the expected reserve depletion dates for the two Trust Funds.
Conclusion
The increased cost of the DI program has been foreseen for decades, as it is largely the product
of demographic changes that have been well known and understood. The 1995 Trustees Report
provided ample warning that the tax rate reallocation of 1994 was only a temporary extension of
the year of reserve depletion for the DI Trust Fund. We are now in need of adjustments once
again to either permanently increase revenue or decrease cost for the DI program to assure
scheduled benefits will be fully payable on a timely basis in the future. Due to the relatively
strong status of the OASI Trust Fund, a tax rate reallocation can be enacted at relatively small
cost to the OASI reserves and projected date of reserve depletion. However, even with this
possibility, the overall Social Security program would still face a shortfall with reserve depletion
for the combined trust funds projected for 2033. Adjustments will be needed before that time to
avert sudden reductions in the amounts of benefits that are payable under the law.
The Office of the Chief Actuary at the Social Security Administration stands ready to assist in any way in developing the proposal that will eventually be enacted by the Congress to maintain the actuarial status of these funds. We have developed estimates for many proposals that would improve the actuarial status of the trust funds. Our estimates for both comprehensive proposals and individual provisions developed by members of Congress and other policy makers are available at http://www.socialsecurity.gov/OACT/.
Again, thank you very much for the opportunity to share this information with you. I am happy to answer any questions you may have.