Testimony by Stephen C. Goss, Chief Actuary, Social Security Administration
before the House Committee on Ways and Means, Subcommittee on Social Security
September 21, 2016
Chairman Johnson, Ranking Member Becerra, and members of the subcommittee, thank you very much for the opportunity to speak to you today about the solvency challenge facing Social Security, with a focus on the differences between estimates from the Trustees Reports and those from the Congressional Budget Office. Trustees Reports have been produced and submitted to the Congress every year starting in 1941, the year after monthly benefits were first paid from a Social Security trust fund.
Since testifying to you just three months ago on the issuance of the 2016 Trustees Reports, the actuaries, demographers, and economists in our office have continued to work with the Board of Trustees, the Social Security Advisory Board, your and other Congressional staffs, the Administration, our auditors, and numerous academics and other interested parties in developing the next Trustees Report and numerous proposals to modify this program. It is a real honor and a great responsibility for us to provide the very best possible projections and estimates for the consideration of all policymakers and, in turn, the American people who both finance and benefit from the program.
The Social Security Act requires that the Trustees annually report on the expected financial operations of the Social Security trust funds over the next 5 years. The law further requires reporting on the “actuarial status” of the Social Security trust funds, as it does for the Medicare trust funds. Assessment of the long-range actuarial status of these programs requires projections extending well beyond 5 years, and thus involves very different methods and assumptions than those appropriate for a short-term projection. Our experienced staff of 45 actuaries and demographers, plus 8 economists and statisticians, has unparalleled experience and expertise for this task. Actuarial valuation is a highly interdisciplinary exercise. The broad capabilities of our team, plus the access we have to technical panels, the staffs of the Trustees, and others federal agencies, give us the ability to explore and evaluate the many demographic, economic, and other factors critical to evaluating the Social Security program.
Since the inception of CBO, we have worked closely with directors and staff there in areas of common practice. Starting around 2002, CBO started development of a long-term model (CBOLT), and we worked closely with them at that time. To this day, we continue to provide extensive annual detail to CBO on specifics of our projections. This is just one part of the transparency we believe is critical to maintain credibility for our projections.
Process for the Trustees Reports
The annual Trustees Reports are signed by the members of the Board, including the Secretary of the Treasury, the Secretary of Health and Human Services, the Secretary of Labor, the Commissioner of Social Security, and generally, two public Trustees nominated by the President and confirmed by the Senate. The Board and their staff provide a diverse and balanced group of highly knowledgeable individuals. We in the Office of the Chief Actuary work with the Trustees by proposing and discussing assumptions, developing the actuarial methods, producing the actuarial projections, and drafting the report. As an assurance that the assumptions used for the report are reasonable, the Social Security Act further requires that the Chief Actuary provide an actuarial opinion with each report speaking to the reasonableness of the assumptions and appropriateness of the methods. I am pleased to tell you that there has never been a need for the actuarial opinion to state that any assumption or method is unreasonable.
The projections we produce for the Social Security area population are also utilized for the Medicare Trustees Report and for the extended projections in the President’s Budget. CBO used our population projections for their long-term estimates in 2004 through 2010. We also project Social Security cost and revenues for the President’s Budget under the economic assumptions developed by the Administration for that report.
Fundamental to the projections we produce for the annual Trustees Reports is the concept of incremental change. It should be rare that new experience or insight from one annual report to the next would make a substantial change in the actuarial status. Enactment of legislation is the obvious exception to this principle. Boards of Trustees in all administrations have well understood the importance of making changes only gradually and after compelling evidence has accumulated. We have seen many cases where a measure appears to be moving in a new and different direction, only for that change to be reversed after a short time. Long-term projections should not react quickly to annual data, and the consistency of Trustees’ projections is testament to the understanding of the current and past Boards of Trustees.
We have many levels of oversight. Our Social Security Advisory Board has continued the tradition of past Advisory Councils in commissioning Technical Panels every four years to evaluate our methods and assumptions and to make recommendations. Each panel is comprised of just a few individuals who must cover a very broad range of areas, and generally represent only one or two of several positions on a given area. We and the Trustees take the recommendations of the panels into consideration along with all other evidence we have at our disposal. Panels can at times become frustrated with our reluctance to adopt their recommendations and make abrupt changes, but often come to understand the value of incrementalism. As one recent example, Alicia Munnell, chairperson of the 2015 Technical Panel, stated that she was glad the Trustees had not followed the recommendation of the panel to increase the assumed rate of decline in mortality for the 2016 Trustees Report (http://crr.bc.edu/briefs/social-securitys-financial-outlook-the-2016-update-in-perspective/).
Actuarial Status from the 2016 Trustees Report
At the risk of redundancy, let me briefly present a small portion of the findings from the 2016 Trustees Report that we discussed at the Subcommittee’s hearing on June 22.
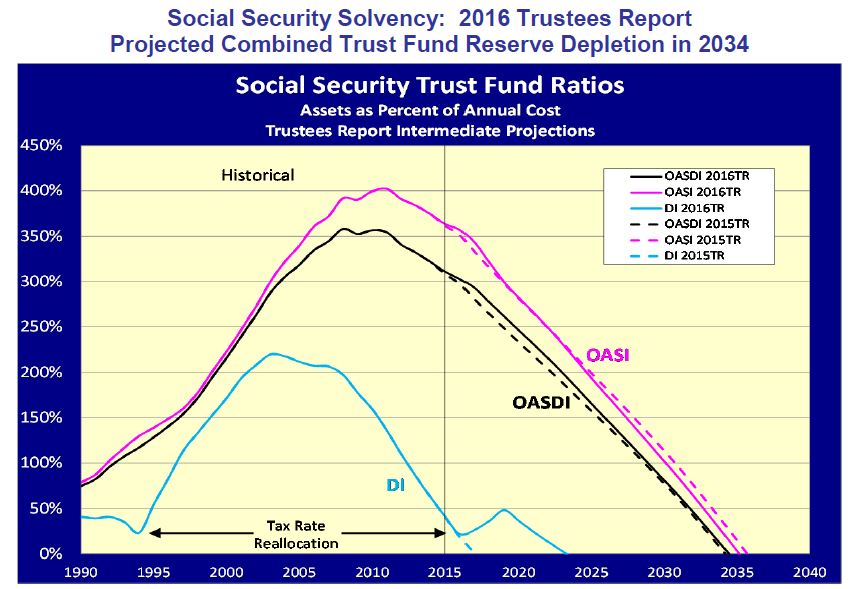
The figure above illustrates the projected dates of trust fund reserve depletion of the separate and combined Social Security trust funds. The Bipartisan Budget Act of 2015, which Congress passed last November, extended the date for DI reserve depletion by 6 years. Under the 2016 Trustees’ intermediate assumptions, DI reserve depletion is now projected for 2023. The projected years of reserve depletion for the OASI fund (2035) and for the combined OASI and DI funds (2034) were unaffected by the BBA and by the new valuation for the 2016 Trustees Report.
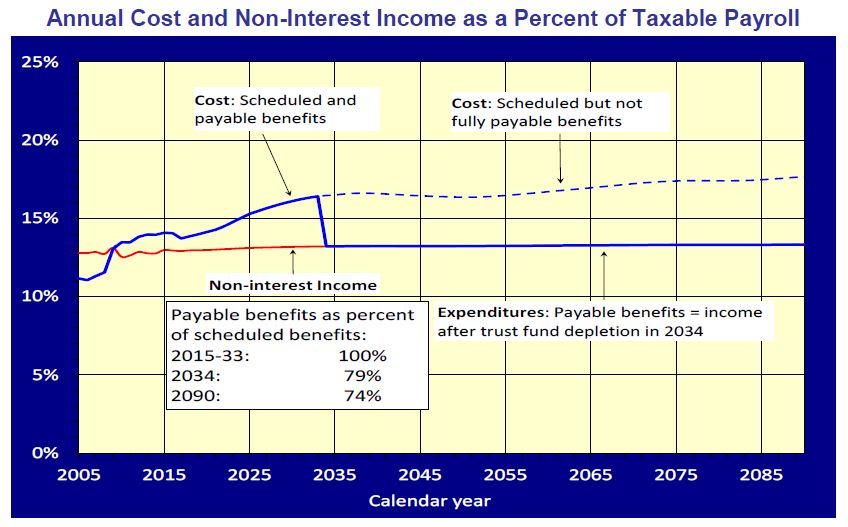
The annual cost for the Social Security program will begin to exceed total income, including interest, in 2020. Cost already exceeds non-interest income. At the time of projected reserve depletion in 2034, we project that continuing revenue to the program will equal 79 percent of program cost. In the absence of Congressional action, full scheduled benefits would no longer be payable on a timely basis at that time. By the end of the 75-year projection period, if the Congress has not yet acted, we project that continuing revenue will equal 74 percent of the amount needed to pay full scheduled benefits. Because the trust funds have no borrowing authority, expenditures would be limited to continuing revenue in the event that reserves became depleted.
Estimating the Size of the Solvency Challenge
The figure below illustrates the history of Trustees’ projections of the size of the “actuarial balance” for the Social Security program. When the actuarial balance is negative, it may be referred to as an actuarial deficit. The 75-year deficit, expressed as a percent of payroll, may be loosely interpreted as the increase in the payroll tax rate that could be enacted immediately in order to fully finance the program over the 75-year period.
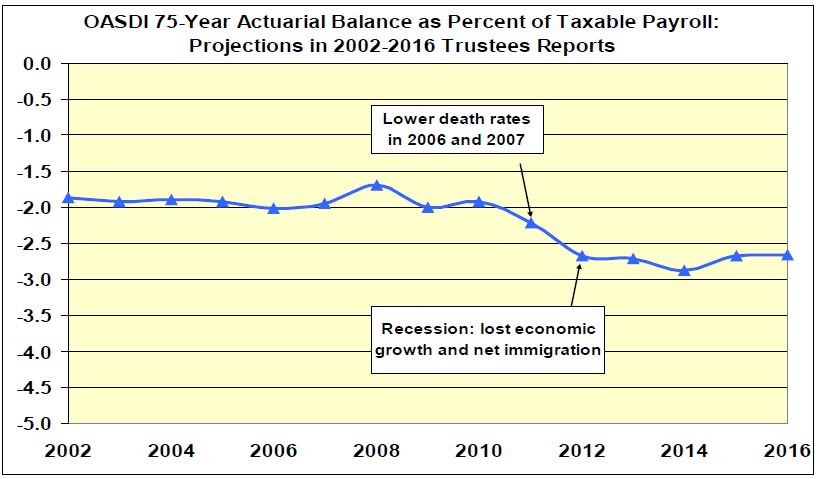
For years 2002 through 2010, the actuarial deficit remained consistently around 2 percent of payroll. In 2011 and 2012, the size of the deficit increased somewhat in response to faster-than-expected mortality declines in 2006 and 2007 and effects from the recession. These recession effects included (1) lower economic growth that was expected to permanently lower the level of GDP and earnings and (2) a temporary reduction in the level of net immigration into the country. It should be noted that even with these effects, the increase in the Trustees’ actuarial deficit from 2002 to 2016 was only about 0.7 percent of payroll, less than the change expected from just the passage of time. With each new valuation, the projection period advances one year, thus including one additional year (the 76th year from the prior valuation) that has a large projected annual shortfall. This change in valuation period increases the actuarial deficit by about 0.06 percent of payroll annually. Between 2002 and 2016, we would have increased the actuarial deficit by about 0.84 (14 times 0.06) percent of payroll, in the absence of any changes in assumptions, methods, or unexpected experience.
The figure below adds the 75-year actuarial balances for Social Security estimated by CBO in 2004 through 2016. CBO did not produce a new estimate for 2005, after their first long-term estimate in 2004. The value included is a rough estimate we calculated based on material CBO published for that year.
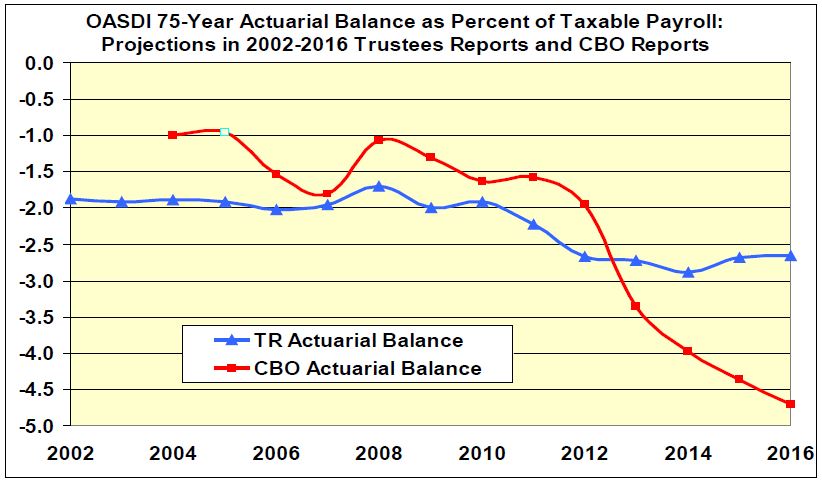
Initially, CBO projected lower benefits relative to tax revenue, and thus smaller deficits than in the Trustees Reports, even though CBO used the Trustees Report population projections in their entirety through 2010. Starting in 2013, CBO has used much more pessimistic demographic and economic assumptions, and the size of the actuarial deficit projected by CBO has been larger than that projected in the Trustees Report. Where CBO’s projected actuarial deficit in 2004 was only half of that in the Trustees Report, CBO’s projected deficit for 2016 was nearly double that in the Trustees Report.
It is worth noting that Social Security cost, income, and the projected shortfall under current law may also be looked at as a percent of Gross Domestic Product (GDP), and the Trustees Reports provide these values. These values are useful for comparing Social Security finances to other federal operations in the unified budget context. However, when considering "solvency" for Social Security, estimates as percent of taxable payroll are the most relevant and informative because the vast majority of revenue for the program derives from the payroll tax, and not from taxes more related to GDP. Because taxable payroll is about 35 percent as large as GDP, Social Security estimates expressed as a percent of GDP are measured to be about one third as large as when expressed as a percent of taxable payroll.
In addition to the summarized actuarial balance for the 75-year projection period, it is important to consider the size of annual shortfalls in the more distant years. These more distant shortfalls are critical in determining what changes to the program will be needed in order to pay scheduled benefits on a timely basis. The figure below compares the annual balance for the year 2080 projected for Trustees Reports and by CBO since 2002. It is worth noting that annual balances are unaffected by interest rates, which are largely irrelevant for a program financed on a pay-as-you-go basis.
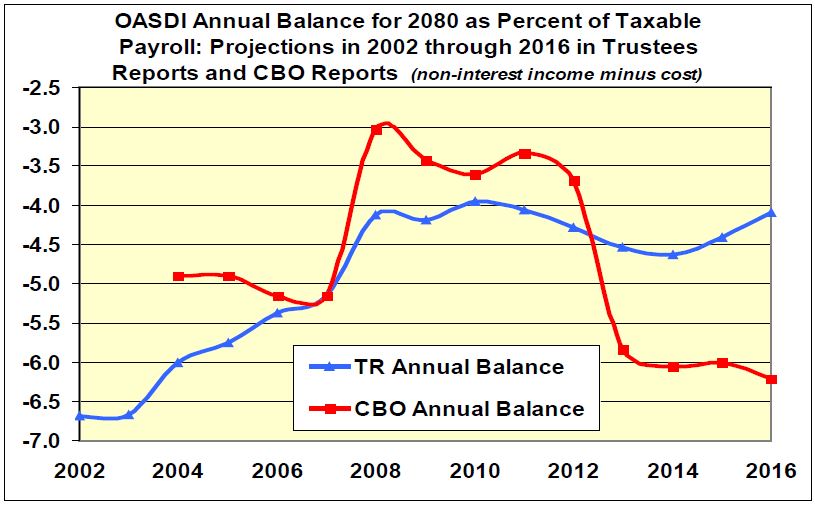
In Trustees Reports since 2002, projected annual deficits for 2080 that have generally decreased, reflecting evolving experience. Like the summarized actuarial deficits, annual deficits projected by CBO were smaller than those projected for the Trustees Reports through 2012, but have become progressively larger since 2013.
Explaining the Differences between Trustees Report and CBO Projections
Based on CBO’s published demographic and economic assumptions starting in 2004, we have used our sensitivity analyses to estimate how different projections for the Trustees Reports would have been if we had adopted CBO’s assumptions. The red bars in the figure below show the actual difference in the actuarial balance estimated by CBO compared to that estimated for the Trustees Report. The blue bars show the amount of the difference we are able to explain based on our assessment of known assumptions. We do not expect to produce a full explanation of the differences, as we are unclear on the way some assumptions have been implemented in CBO’s model. In addition, CBO’s model is structurally different from the model we use for the Trustees Reports. As mentioned above, early CBO projections produced much lower benefits and thus lower deficits. This difference is not included in the blue bar for the early CBO projections, because we do not have a definitive sense of the effect. We do know that the difference in benefits appears to have diminished, or has been offset by other methods changes, so that we have largely explained the differences in actuarial balance for 2009 through 2012.
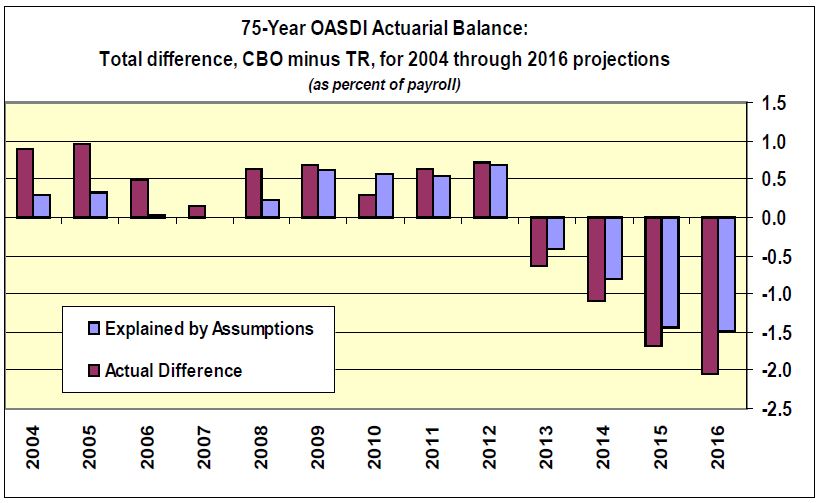
Starting in 2013, when actuarial deficits projected by CBO began to exceed those in the Trustees Reports by an increasing margin, we have not had as much success in explaining the differences. Therefore, we conclude that there have been changes in CBO’s model that we are unaware of, or implementation of assumptions different from our understanding, that are resulting in larger increases in CBO-estimated actuarial deficits.
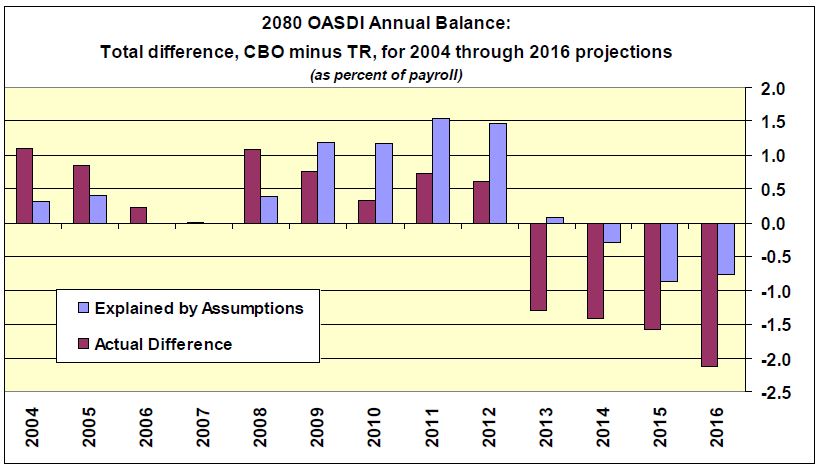
The differences between CBO’s projections and our projections for annual balances for 2080 are even more difficult to explain. The pattern is quite different from that for the 75-year actuarial balances. For the 2080 annual balance, we explain too much positive balance for CBO relative to Trustees Reports for years 2009 through 2012, but far less of the excess CBO annual deficits projected in 2013 through 2016. This suggests that there is a substantial methodological factor in CBO’s projections since 2009 that is more pessimistic than for our projections.
Differences We Can Explain
The increase in 75-year actuarial deficits projected by CBO starting in 2013 is striking. Three demographic assumptions and three economic assumptions explain most of this increase.
In 2013, CBO stopped using Trustees Report mortality assumptions and began making their own assumptions. For the 2013 through 2015 projections, CBO reports that they assumed a roughly 1.2 percent annual rate of decline in death rates for all ages. This is dramatically different from historical experience and from the Trustees Report assumptions. In 2016, CBO modified their mortality assumptions, coming much closer to Trustees Report effects on actuarial balance, but roughly offset this effect by lowering their assumed birth rate to a level of 1.9 children per woman, below the 2.0 assumed for the Trustees Report. CBO also increased their disability incidence assumptions in 2013 and their net immigration assumptions in 2011, with partially offsetting effects on the actuarial balance. In 2016, CBO lowered their disability incidence assumption back to the level in the Trustees Report. One additional demographic factor that influences Social Security cost, differential mortality across individuals by their level of lifetime earnings, appears to be reflected in both models with roughly equal effect.
However, three changes in economic assumptions had an even larger combined effect. CBO’s projected employment rates, and more specifically labor force participation rates, are far lower than recent experience and than the projections for the Trustees Reports. CBO has also assumed much more concentration of earnings for the top few percent of earners in their 2015 and 2016 projections. In addition, CBO has lowered the real interest rates assumed for trust fund reserve investments from over 3.0 percent through 2013 (higher than the Trustees Reports) to much lower rates starting in 2014. CBO’s assumed real interest rates are considerably lower than long-term past experience and Trustees Report assumptions.
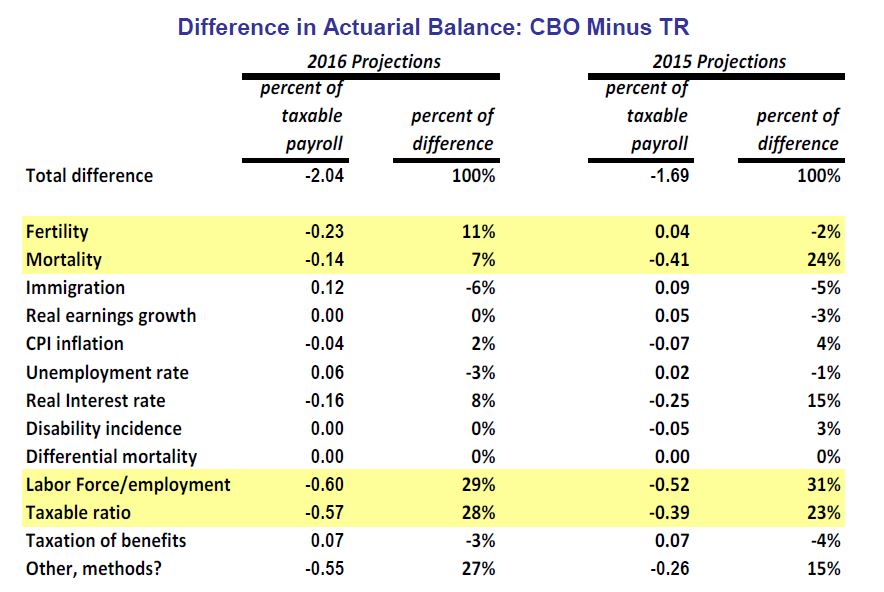
The table below identifies our estimates of the effects of differences in identifiable assumptions for the projections of actuarial balance presented in the 2015 and 2016 reports. For 2015, CBO’s projected actuarial balance was 1.69 percent of payroll more negative than the projection in the Trustees Report. For 2016, CBO’s projected actuarial balance was 2.04 percent of payroll more negative, nearly doubling the Trustees report actuarial deficit of 2.66 percent of payroll.
Four of the six differences in assumptions mentioned above are highlighted in the table below as particularly important determinants of the difference in estimated actuarial balance. These are fertility, mortality, labor force/employment, and the effect on the “taxable ratio” of increased concentration of earnings for the highest earners. In both the 2015 and 2016 projections, these four assumptions account for 75 percent of the actual difference between the CBO and Trustees Report projections of actuarial balance. The remaining difference is largely attributed to unexplained model differences.
Demographic Assumptions
One effective way to compare the implications of differences in demographic assumptions for the cost of Social Security is by considering the resulting age distribution of the population. A common proxy for the full age distribution is the “aged dependency ratio,” which is the ratio of the population age 65 and over to the population at ages 20 through 64. This ratio of beneficiary-age to working-age population is a good indicator of demographic effects on the cost of the program as a percent of the taxable payroll.
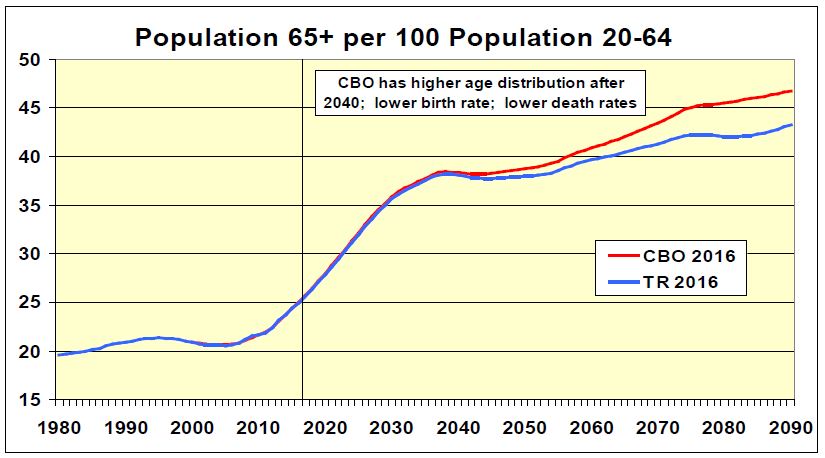
The figure above shows that for the 2016 projections, the combination of CBO’s fertility, mortality, and immigration assumptions yields a very similar age distribution through about 2040 compared to our projections. After 2040, however, CBO’s age distribution becomes much more weighted to individuals over age 65. This is consistent with lower birth rates and lower mortality.
The figure below illustrates the reduced total fertility rate (TFR) assumed by CBO starting with their 2016 projections. In particular, we note the dip in the TFR experienced in the recent recession, which CBO assumes will be permanent. This is in contrast to the prerecession period 1990 through 2008, when the TFR averaged above 2.0.
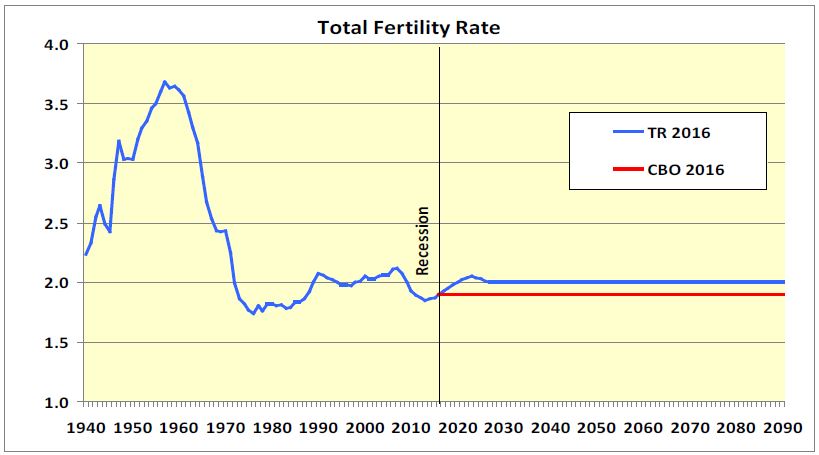
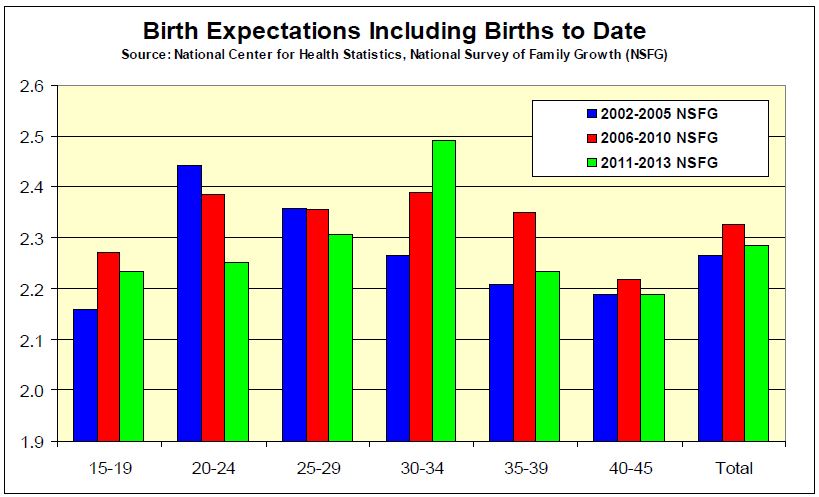
Surveys of women between ages 20 and 45 conducted periodically by the National Center for Health Statistics (NCHS) continue to indicate that women intend to have more than 2 children, on average, over their lifetime. This strongly suggests that the dip in birth rates during the recent recession may represent a temporary reduction, as opposed to a permanent reduction, in the TFR.
Mortality
Mortality assumptions have been the subject of enormous discussion and controversy. Over long periods of time, death rates have declined rapidly at certain times and slowly at other times. The Office of the Chief Actuary recently published an actuarial note (https://www.ssa.gov/OACT/NOTES/pdf_notes/note158.pdf) that provides a comprehensive look at competing views. For Trustees Reports, we have always taken a long-term view of mortality improvement, setting ultimate rates of reduction based on expected future conditions. Our approach considers medical advances and spending, behavioral aspects of our population, and the historical persistent fact that death rates have declined much faster at younger ages than at older ages. Our approach has stood the test of time: the projected improvement from 1980 to 2010 in unisex life expectancy at age 65 that was included in the 1982 Trustees Report (the baseline used for development of the 1983 Social Security Amendments) has been realized almost exactly. Going forward, we project a continued “age gradient” in mortality improvement, but with a somewhat diminished difference between younger and older ages.
In 2013, CBO for the first time diverged from our mortality projections. CBO assumed a very high rate of improvement overall and applied this rate for all ages. CBO’s approach produced slower mortality declines at younger ages and faster declines at older ages. Both of these changes increase the aged dependency ratio and the cost of the program as a percent of payroll.
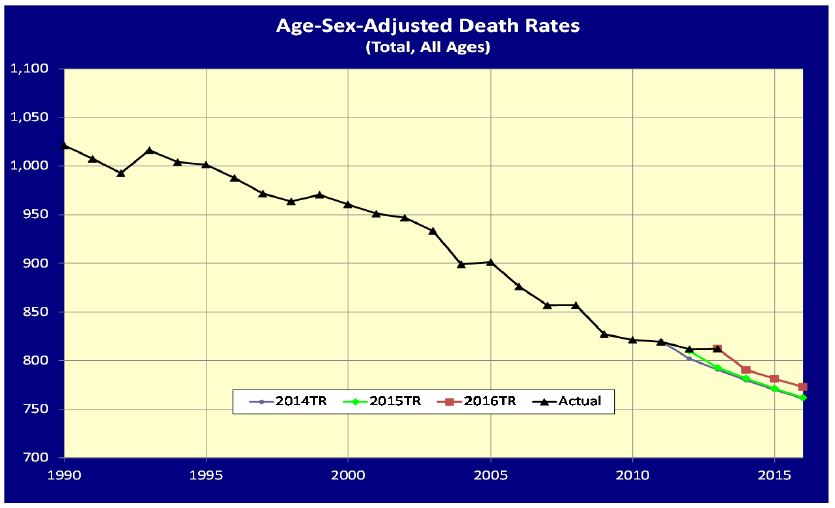
Since 2009, mortality rate improvement has slowed markedly, resulting in small changes in the 2015 and 2016 Trustees Report mortality rate projections, as seen in the figure below.
Recently, noted demographer Ronald Lee made a new projection of future mortality rates, using for the first time the Medicare data for ages 65 and over. The Medicare data are universally accepted as the most accurate death rate data available. Lee fitted death rates to historical experience from 1950 through 2011 using his “Lee and Carter” method, which essentially assumes that mortality will decline at the same rate in the future as it has in the past, for each age and sex. As Actuarial Note 158 indicated, using Lee’s new projection resulted in the same overall Social Security actuarial status over the 75-year projection period as does our mortality projection. Lee’s method extrapolates a faster overall rate of decline, effectively assuming that the positive experience seen over the last 50 years, including the effects of dramatic health spending growth and the startup of Medicare and Medicaid, will be replicated in the future. His method also assumes that there will be no deceleration in mortality improvement in the future. However, these presumptions are offset by his method’s maintaining the same large age gradient in mortality of the past for the future. Overall, we believe that a slight decelerating rate of improvement in mortality with a lessened age gradient is the most likely scenario for the future.
As seen in the figure below, CBO’s 2015 projections assumed a much faster rate of decline in mortality. (The same was true for their 2013 and 2014 projections.) However, recognizing the recent slowdown in mortality improvement, and the importance of the age gradient, CBO changed their mortality projection for 2016 to be close to what Ron Lee has produced. Again, while the new CBO projection has a faster overall rate of decline, it has a much larger age gradient than the projections for the Trustees Report. Overall, the 2016 difference in the CBO and Trustees aged dependency ratio and the cost of the program due to mortality assumptions is assumed to be much smaller than in 2015.
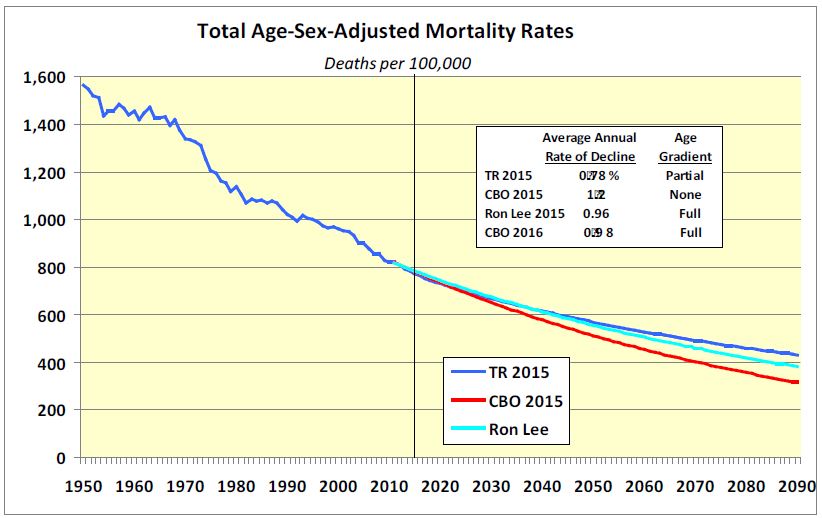
The 2015 Technical Panel appointed by the Social Security Advisory Board recommended that the Trustees retain the age gradient and the cause-specific mortality rates, but that we increase the average rate of decline to 1 percent. As mentioned above, after seeing the recent historical data, the chairperson of the panel stated that it is good that the Trustees did not follow the panel’s recommendation for faster mortality reduction in the future.
Economic Factors
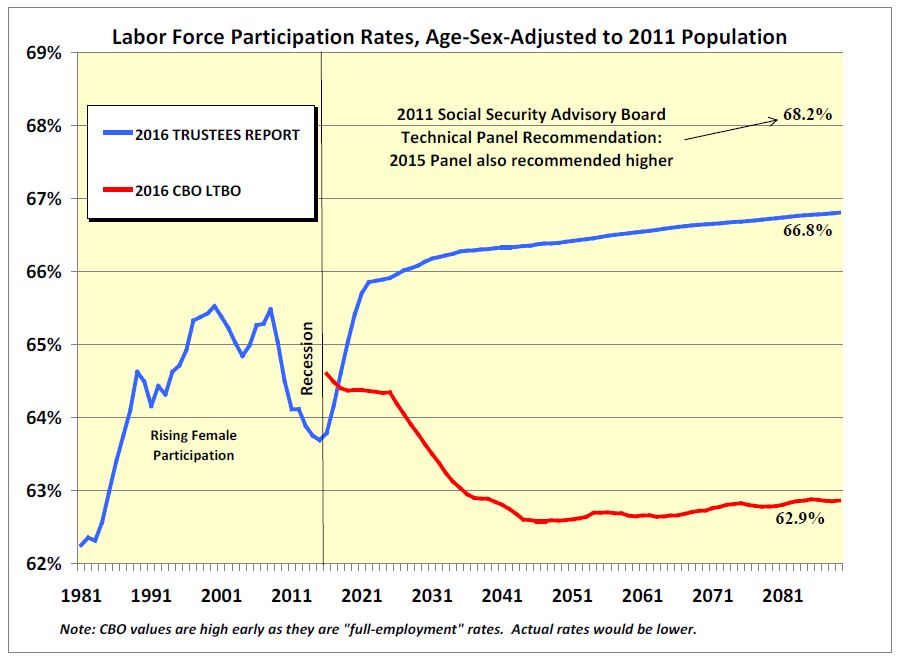
Projections of employment, and particularly labor force participation rates (LFPRs), are a source of substantial difference between CBO and the Trustees Reports. The recent extraordinary recession resulted in large reductions in employment and LFPRs, from which we have only begun to recover. The figure below shows historical and projected age-sex-adjusted LFPRs from the 2016 projections. CBO projections shown are for "full-employment" conditions as "actual" LFPR were not available from CBO at this time. By 2030, CBO values likely match their actual.
CBO projects little recovery from the recession with a steady decline in LFPRs to levels not experienced since the early 1980’s, before women fully participated in the labor force. The Trustees Report includes projections with LFPRs basically recovering to prerecession levels and then rising very gradually after 2020, reflecting the assumed increasing health, longevity, and ability to work by the population over age 65 in the future. We note that the 2011 Technical Panel recommended even higher ultimate LFPRs. The 2015 panel also recommended higher LFPRs than assumed for the Trustees Reports. We continue to believe that the more conservative assumptions used in the Trustees Report are the most reasonable assumption at this time.
The second economic factor that contributes to the CBO’s higher cost for Social Security is the difference in earnings growth between high earners and low earners. Since 1983, there has been a substantial increase in the concentration of earnings in the top few percent of workers.
Because annual earnings subject to the Social Security payroll tax for each worker are limited to $118,500 in 2016, the top 6 percent of earners do not pay any tax on their earnings above this level. The increasing concentration at the top has reduced the percent of all covered earnings that are taxable from over 89 percent in 1983 to about 83 percent in 2014.
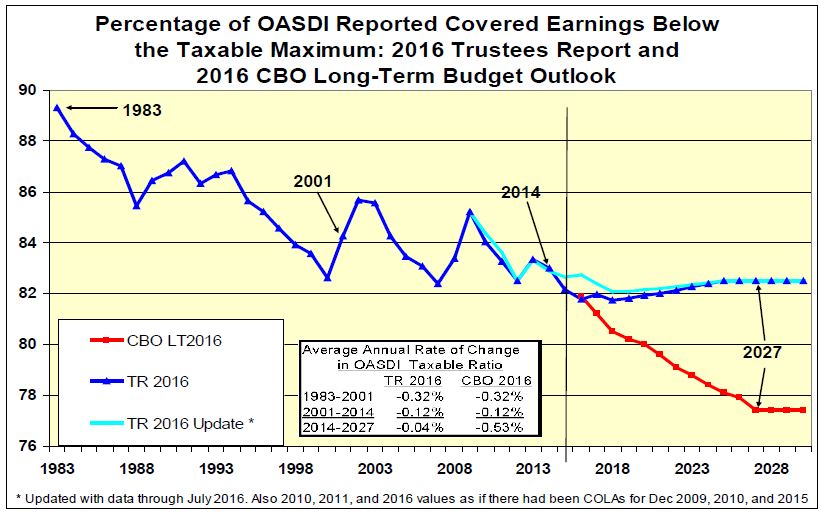
Fortunately, the rate of increase in such concentration has been decreasing. Between 2001 and 2014, the rate of decline in the percent of earnings taxable dropped to only one-third of the rate observed between 1983 and 2001. For the Trustees Report, we assume this deceleration will continue, with the rate of change in the taxable percentage declining between 2014 and 2027 at one-third the rate experienced from 2001 to 2014. However, CBO assumes a significant reacceleration in the concentration of earnings for the highest earners, with a rate of decline in the taxable percentage from 2014 to 2027 of almost double the rapid rate between 1983 and 2001, and over four times the rate experienced between 2001 and 2014. We do not expect that conditions over the next 11 years would result in this dramatic increase in the concentration of earnings for the highest earners.
Result: 2016 Trustees vs. CBO Cost Rate Projections
The result of the differences in demographic and economic assumptions described above, plus the unexplained differences likely related to model structure, is a sharp and immediate rise in the CBO projected Social Security cost as a percent of taxable payroll, well above the level projected in the Trustees Report.
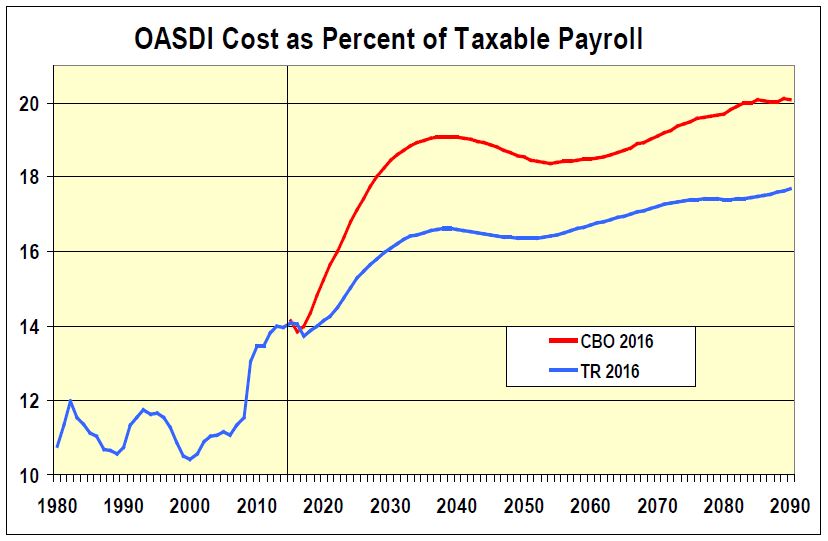
As seen above, the differences in demographic assumptions cause the CBO aged dependency ratio, and thus the cost as a percent of payroll, to exceed our projections after about 2040. The striking and increasing difference in the cost rate that occurs between 2016 and 2040 is largely the result of CBO’s drop in LFPRs and increase in the concentration of earnings for the highest earners.
It is worth noting that differences in mortality by earnings and benefit level appear to be reflected similarly in the CBO and Trustees Report projections. This is also true for disability incidence rate assumptions, which CBO reduced for their 2016 projections, matching the assumptions used for the Trustees Report.
Conclusion
An accurate estimate of Social Security’s solvency challenge will be critical for lawmakers in the upcoming discussions on how to best address the program’s financing shortfall. Since 1941, the Trustees Reports have provided the Congress, the Administration, and the American people carefully developed projections. These projections have proven to be reliable, consistent, transparent, and reflect the latest data and expectations incrementally. The Trustees Report projections have been subject to immense oversight, scrutiny, and care in preparation.
The 2016 Trustees Report projects an actuarial deficit of 2.66 percent of payroll. Lawmakers need to make changes by 2034 that provide: (1) 33 percent higher revenue, (2) 25 percent lower scheduled benefits, or (3) some combination of these changes. I and all in the Office of the Chief Actuary look forward to continued work with you and your staffs on developing options for consideration to best address that solvency challenge.
Please note that the 2016 and all prior year’s Trustees Reports are available at https://www.ssa.gov/oact/pubs.html, along with a wide variety of additional actuarial analysis related to the reports, and to changes policymakers have considered for making adjustments to the program.
Again, thank you for the opportunity to talk about the actuarial status of the Social Security program. I will be happy to answer any questions you may have.