Fast Facts & Figures About Social Security, 2026
- Did You
Know That… - General
Information
OASDI Program
SSI Program- Cross-Program
Beneficiaries - Social Security
Financing
Did You Know That…
74.9 million people received benefits from programs administered by the Social Security Administration (SSA) in 2025.
6.4 million people were newly awarded Social Security benefits in 2025.
55% of adult Social Security beneficiaries in 2025 were women.
56.2 was the average age of disabled-worker beneficiaries in 2025.
84% of Supplemental Security Income (SSI) recipients received payments because of disability or blindness in 2025.
General Information
| Program | Employee | Employer | Self-employed |
|---|---|---|---|
| Total | 7.65 | 7.65 | 15.30 |
| OASI | 5.30 | 5.30 | 10.60 |
| DI | 0.90 | 0.90 | 1.80 |
| HI | a 1.45 | 1.45 | a 2.90 |
| a. Earned income exceeding $200,000 for individual filers and $250,000 for married couples filing jointly is subject to an additional HI tax of 0.90%. | |||
| Type of earner | OASI | DI | HI |
|---|---|---|---|
| Average | 3,865 | 656 | 1,057 |
| Maximum | 9,779 | 1,661 | No limit |
| Self-employed maximum | 19,557 | 3,321 | No limit |
| Program | Amount |
|---|---|
| OASDI | 184,500 |
| HI | No limit |
Earnings required for work credits, 2026: $1,890 for one work credit (one quarter of coverage)
NOTE: A worker may earn a maximum of four credits a year. Doing so in 2026, therefore, requires $7,560 in earnings.
| Calendar year | Total | OASI | DI |
|---|---|---|---|
| 2024 | 5.02 | 4.49 | 0.53 |
| 2025 | 5.19 | 4.67 | 0.51 |
| NOTE: Figures are subject to change. | |||
Cost-of-living adjustment, 2026: 2.8%
| Year of birth | Full retirement age (FRA) |
|---|---|
| 1937 and earlier | 65 |
| 1938 | 65 and 2 months |
| 1939 | 65 and 4 months |
| 1940 | 65 and 6 months |
| 1941 | 65 and 8 months |
| 1942 | 65 and 10 months |
| 1943–1954 | 66 |
| 1955 | 66 and 2 months |
| 1956 | 66 and 4 months |
| 1957 | 66 and 6 months |
| 1958 | 66 and 8 months |
| 1959 | 66 and 10 months |
| 1960 and later | 67 |
Maximum monthly Social Security benefit: $4,152 for workers retiring at FRA in 2026
NOTE: Higher benefits are possible for those who work or delay benefit receipt after reaching FRA.
Benefit formula bend points (for workers with first eligibility in 2026):
Primary insurance amount (PIA) equals
90% of the first $1,286 of average indexed monthly earnings (AIME), plus
32% of AIME over $1,286 through $7,749, plus
15% of AIME over $7,749
| Year | Dollars | Increase from previous year (in percent) |
|---|---|---|
| 2024 | 69,846.57 | 4.8 |
| 2025 (estimated) | 72,025.07 | 3.1 |
| 2026 (estimated) | 75,246.70 | 4.5 |
| Age of retired person in 2026 | Annually | Monthly |
|---|---|---|
| Under FRA ($1 for $2 withholding rate) | 24,480 | 2,040 |
| FRA ($1 for $3 withholding rate) a | 65,160 | 5,430 |
| Above FRA | No limit | No limit |
| NOTE: Retired-worker beneficiaries younger than FRA have some of their benefit withheld if they have earnings above the exempt amounts. | ||
| a. The test applies only to earnings made in months prior to the month of attainment of FRA. | ||
| Program aspect | Individual | Couple |
|---|---|---|
| Federal benefit rate | 994 | 1,491 |
| Resource limit | 2,000 | 3,000 |
| Determinant | Monthly amount |
|---|---|
| Substantial gainful activity | |
| For nonblind persons | 1,690 |
| For blind persons | 2,830 |
| Trial work period | 1,210 |
| Calendar year and trust fund | Income | Outgo | Fund at end of year |
|---|---|---|---|
| 2025 (actual) | |||
| Total | 1,449.3 | 1,609.5 | 2,561.3 |
| OASI | 1,248.8 | 1,448.8 | 2,338.3 |
| DI | 200.5 | 160.7 | 223.0 |
| 2026 (estimated) | |||
| Total | 1,493.2 | 1,696.8 | 2,357.7 |
| OASI | 1,284.6 | 1,528.0 | 2,094.9 |
| DI | 208.6 | 168.8 | 262.8 |
| Family unit | Amount |
|---|---|
| Aged individual | 15,440 |
| Family of two, aged head | 19,460 |
| Family of four | 33,207 |
| SOURCE: U.S. Census Bureau, “Poverty Thresholds” (https://www.census.gov/data/tables/time-series/demo |
|
OASDI administrative expenses: Costs were 0.5% of contributions in calendar year 2025
| Type of filing | Number |
|---|---|
| OASI claims | 7.2 |
| DI claims | 2.2 |
| SSI applications | 1.5 |
OASDI Program
Earnings in Covered Employment, 1937–2025
People contribute to Social Security through payroll taxes or self-employment taxes, as required by the Federal Insurance Contributions Act (FICA) and the Self-Employment Contributions Act (SECA). The maximum taxable amount is updated annually on the basis of increases in the average wage. Of the 185 million workers with earnings in Social Security–covered employment in 2025, about 6% had earnings that equaled or exceeded the maximum amount subject to taxes, compared with 3% when the program began and a peak of 36% in 1965. About 83% of earnings in covered employment were taxable in 2025, compared with 92% in 1937.
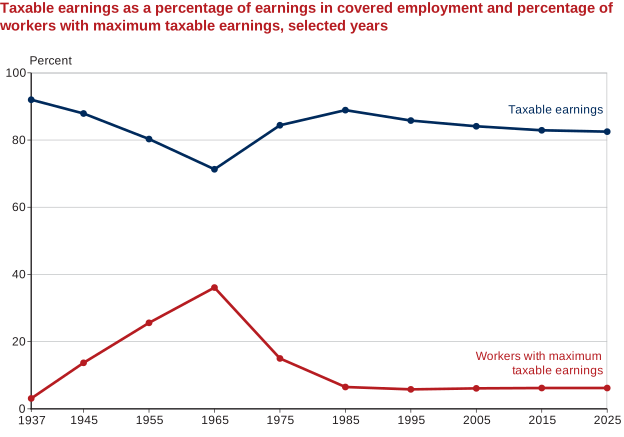
| Year | Taxable earnings | Workers with maximum taxable earnings |
|---|---|---|
| 1937 | 92.0 | 3.1 |
| 1945 | 87.9 | 13.7 |
| 1955 | 80.3 | 25.6 |
| 1965 | 71.3 | 36.1 |
| 1975 | 84.4 | 15.0 |
| 1985 | 88.9 | 6.5 |
| 1995 | 85.8 | 5.8 |
| 2005 | 84.1 | 6.1 |
| 2015 | 82.9 | 6.2 |
| 2025 | 82.5 | 6.2 |
Insured Status, 1970–2025
The percentage of persons aged 20 or older who are insured for benefits has changed very little in recent years. To be fully insured, a worker must have at least one work credit (quarter of coverage) for each year elapsed after age 21 (but no earlier than 1950) and before the year in which he or she attains age 62, becomes disabled, or dies. Once a worker has accumulated 40 quarters of coverage, they remain permanently fully insured. To be insured for disability, the worker must be fully insured and have at least 20 quarters of coverage during the last 40 calendar quarters. (Requirements for disability-insured status are somewhat different for persons younger than age 31.) Disability benefits are available up to FRA.
| Year | Population aged 20 or older | Population aged 20 to FRA a | |||
|---|---|---|---|---|---|
| Millions | Percentage permanently insured | Percentage fully insured | Millions | Percentage insured for disability | |
| 1970 | 135.1 | 50 | 77 | 113.9 | 63 |
| 1975 | 147.4 | 50 | 80 | 123.8 | 66 |
| 1980 | 161.8 | 53 | 83 | 135.2 | 70 |
| 1985 | 174.9 | 57 | 84 | 145.5 | 72 |
| 1990 | 186.0 | 63 | 86 | 153.7 | 75 |
| 1995 | 196.0 | 66 | 86 | 161.6 | 76 |
| 2000 | 206.9 | 68 | 87 | 171.3 | 78 |
| 2005 | 219.5 | 68 | 87 | 183.2 | 78 |
| 2010 | 230.9 | 69 | 87 | 192.2 | 76 |
| 2015 | 244.6 | 69 | 87 | 199.5 | 75 |
| 2020 | 254.7 | 69 | 88 | 201.8 | 76 |
| 2025 | 265.8 | 69 | 88 | 207.9 | 77 |
| SOURCE: SSA, Actuarial Services. | |||||
| NOTES: The population in the Social Security area includes residents of the 50 states and the District of Columbia adjusted for net census undercount; civilian residents of American Samoa, Guam, Northern Mariana Islands, Puerto Rico, and U.S. Virgin Islands; federal civilian employees and persons in the U.S. armed forces abroad and their dependents; noncitizens living abroad who are insured for Social Security benefits; and all other U.S. citizens abroad. | |||||
| Figures are subject to revision. | |||||
| a. Insured for disability excludes those who have reached FRA. | |||||
Insured Status by Sex, 1970 and 2025
Although men historically were more likely than women to be insured, the gender gap is shrinking. The proportion of men who are insured declined slightly from 1970 to 2025, with 90% fully insured and 79% insured for disability in 2025. By contrast, the proportion of women who are insured increased dramatically—from 63% to 87% fully insured and from 41% to 75% insured for disability.
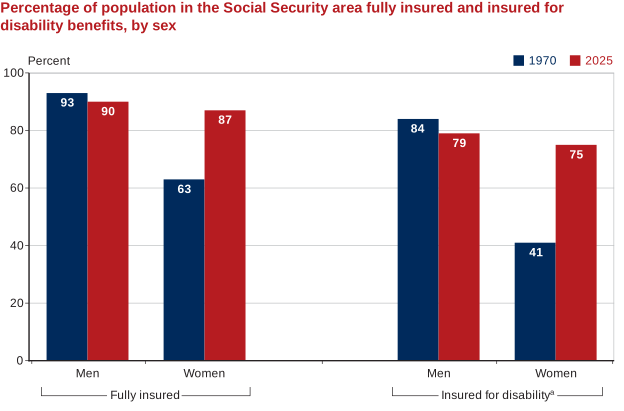
| Sex | 1970 | 2025 |
|---|---|---|
| Fully insured | ||
| Men | 93 | 90 |
| Women | 63 | 87 |
| Insured for disability a | ||
| Men | 84 | 79 |
| Women | 41 | 75 |
New Benefit Awards, 2025
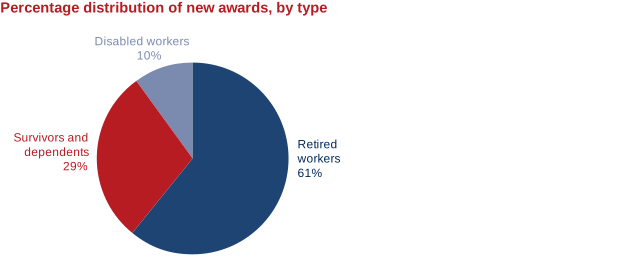
Benefits were awarded to 6.4 million persons; of those, 61% were retired workers and 10% were disabled workers. The remaining 29% were survivors or the spouses and children of retired or disabled workers. These awards represent not only new entrants to the benefit rolls but also persons already on the rolls who become entitled to a different benefit, particularly conversions of disabled-worker benefits to retired-worker benefits at FRA.
| Type | Number (thousands) | Percent |
|---|---|---|
| Total | 6,447 | 100 |
| Retired workers and dependents | 4,631 | 72 |
| Workers | 3,922 | 61 |
| Spouses and children | 709 | 11 |
| Disabled workers and dependents | 867 | 13 |
| Workers | 633 | 10 |
| Spouses and children | 234 | 4 |
| Survivors of deceased workers | 949 | 15 |
New Awards to Workers, 1985–2025
Awards to retired workers increased considerably over the past four decades, at a higher rate than that by which awards to disabled workers increased. The annualized rate of increase over the period from 1985 to 2025 is 2.1% for retired workers and 1.3% for disabled workers. The annual number of awards to retired workers rose from 1.7 million in 1985 to 3.9 million in 2025, while for disabled workers it increased from 377,000 in 1985 to 633,000 in 2025.
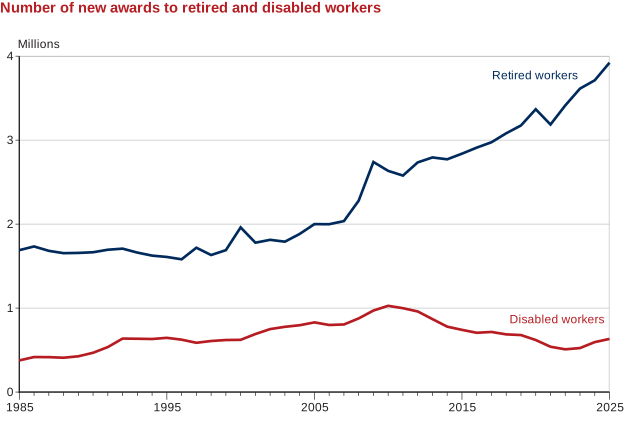
| Year | Retired workers | Disabled workers |
|---|---|---|
| 1985 | 1.690 | 0.377 |
| 1986 | 1.734 | 0.417 |
| 1987 | 1.682 | 0.416 |
| 1988 | 1.654 | 0.409 |
| 1989 | 1.657 | 0.426 |
| 1990 | 1.665 | 0.468 |
| 1991 | 1.695 | 0.536 |
| 1992 | 1.708 | 0.637 |
| 1993 | 1.661 | 0.635 |
| 1994 | 1.625 | 0.632 |
| 1995 | 1.609 | 0.646 |
| 1996 | 1.581 | 0.624 |
| 1997 | 1.719 | 0.587 |
| 1998 | 1.632 | 0.608 |
| 1999 | 1.690 | 0.620 |
| 2000 | 1.961 | 0.622 |
| 2001 | 1.779 | 0.691 |
| 2002 | 1.813 | 0.750 |
| 2003 | 1.791 | 0.777 |
| 2004 | 1.883 | 0.796 |
| 2005 | 2.000 | 0.830 |
| 2006 | 1.999 | 0.799 |
| 2007 | 2.036 | 0.805 |
| 2008 | 2.279 | 0.877 |
| 2009 | 2.740 | 0.971 |
| 2010 | 2.634 | 1.027 |
| 2011 | 2.578 | 0.999 |
| 2012 | 2.735 | 0.960 |
| 2013 | 2.794 | 0.869 |
| 2014 | 2.772 | 0.779 |
| 2015 | 2.839 | 0.741 |
| 2016 | 2.911 | 0.706 |
| 2017 | 2.975 | 0.716 |
| 2018 | 3.082 | 0.687 |
| 2019 | 3.175 | 0.679 |
| 2020 | 3.368 | 0.620 |
| 2021 | 3.186 | 0.540 |
| 2022 | 3.413 | 0.509 |
| 2023 | 3.614 | 0.524 |
| 2024 | 3.713 | 0.595 |
| 2025 | 3.922 | 0.633 |
Beneficiaries in Current-Payment Status, December 2025
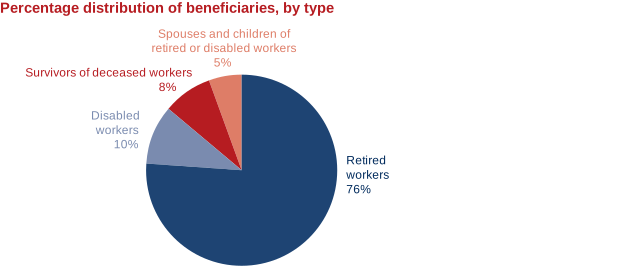
Seventy million beneficiaries were in current-payment status; that is, they were being paid a benefit. The majority of those beneficiaries (76%) were retired workers, while 10% were disabled workers. The remaining beneficiaries were survivors or the spouses and children of retired or disabled workers.
| Type | Number (thousands) | Percent |
|---|---|---|
| Total | 70,451 | 100 |
| Retired workers and dependents | 56,441 | 80 |
| Workers | 53,625 | 76 |
| Spouses and children | 2,817 | 4 |
| Disabled workers and dependents | 8,164 | 12 |
| Workers | 7,126 | 10 |
| Spouses and children | 1,038 | 1 |
| Survivors of deceased workers | 5,846 | 8 |
Average Monthly Benefits, 2025
Benefits payable to workers who retire at FRA and to disabled workers are equal to 100% of the PIA (subject to any applicable deductions). At FRA, widow(er)s' benefits are also payable at 100% of the insured worker's PIA. Nondisabled widow(er)s can receive reduced benefits at age 60. Disabled widow(er)s can receive reduced benefits at age 50. Spouses, children, and parents receive a smaller proportion of the worker's PIA than do widow(er)s.
| Beneficiary type | New awards | Benefits in current-payment status, December |
|---|---|---|
| Retired workers | 2,129 | 2,071 |
| Spouses | 715 | 984 |
| Children | 892 | 955 |
| Disabled workers | 1,816 | 1,633 |
| Spouses | 488 | 462 |
| Children | 512 | 530 |
| Survivors of deceased workers | ||
| Nondisabled widow(er)s | 1,442 | 1,921 |
| Disabled widow(er)s | 1,000 | 982 |
| Widowed mothers and fathers | 1,369 | 1,369 |
| Surviving children | 1,184 | 1,174 |
| Parents | 1,592 | 1,741 |
| SOURCE: SSA, Master Beneficiary Record, 100% data. | ||
Beneficiaries by Age, December 2025
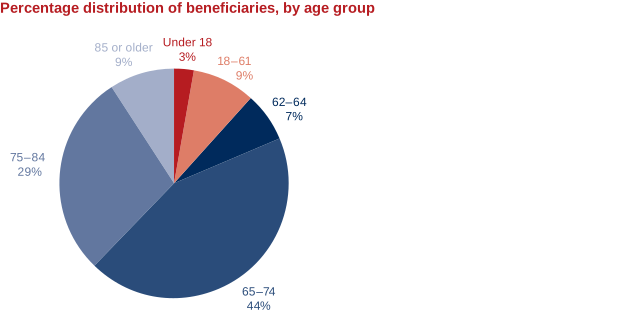
More than four-fifths of all OASDI beneficiaries in current-payment status were aged 62 or older, including 29% aged 75–84 and 9% aged 85 or older. About 9% were persons aged 18–61 receiving benefits as disabled workers, survivors, or dependents. Another 3% were children under age 18.
Age of Disabled and Retired Workers, 1960–2025
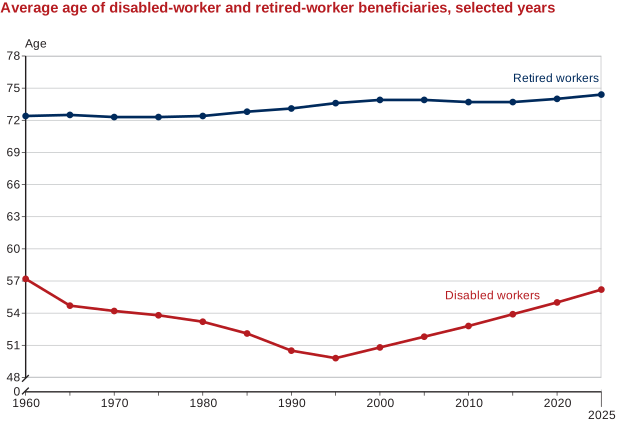
The average age of disabled-worker beneficiaries in current-payment status declined between 1960, when DI benefits first became available to persons younger than age 50, and 2025. In 1960, the average age of a disabled worker was 57.2 years. The rapid drop in average age in the following years reflects a growing number of awards to workers under 50. By 1995, the average age fell to a low of 49.8, but by 2025, it rose to 56.2. By contrast, the average age of retired workers has changed little over time, rising from 72.4 in 1960 to 74.4 in 2025.
| Year | Retired-worker beneficiaries | Disabled-worker beneficiaries |
|---|---|---|
| 1960 | 72.4 | 57.2 |
| 1965 | 72.5 | 54.7 |
| 1970 | 72.3 | 54.2 |
| 1975 | 72.3 | 53.8 |
| 1980 | 72.4 | 53.2 |
| 1985 | 72.8 | 52.1 |
| 1990 | 73.1 | 50.5 |
| 1995 | 73.6 | 49.8 |
| 2000 | 73.9 | 50.8 |
| 2005 | 73.9 | 51.8 |
| 2010 | 73.7 | 52.8 |
| 2015 | 73.7 | 53.9 |
| 2020 | 74.0 | 55.0 |
| 2025 | 74.4 | 56.2 |
Beneficiary Types by Sex, December 2025
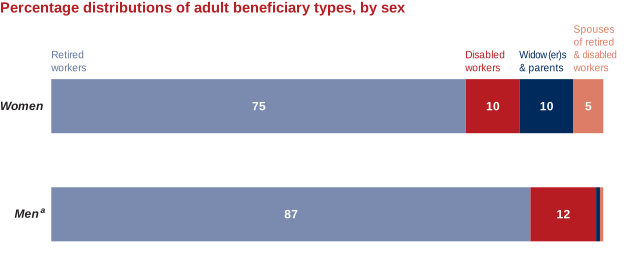
Of all adults receiving monthly Social Security benefits, 45% were men and 55% were women. Among the men, 87% received retired-worker benefits, while 75% of the women received retired-worker benefits. Additionally, 10% of the women received survivor benefits.
Average Monthly Benefits by Sex, December 2025
Among retired and disabled workers who collected benefits based on their own work records, men received a higher average monthly benefit than did women. For those with benefits based on another person's work record (spouses and survivors), women had higher average benefits.
| Type | Men | Women |
|---|---|---|
| Workers | ||
| Retired | 2,282 | 1,872 |
| Disabled | 1,787 | 1,479 |
| Spouses of— | ||
| Retired workers | 754 | 1,005 |
| Disabled workers | 434 | 465 |
| Survivors of deceased workers | ||
| Nondisabled widow(er)s | 1,670 | 1,935 |
| Disabled widow(er)s | 774 | 1,003 |
| Mothers and fathers | 1,211 | 1,383 |
| SOURCE: SSA, Master Beneficiary Record, 100% data. | ||
Women Beneficiaries, 1940–2025
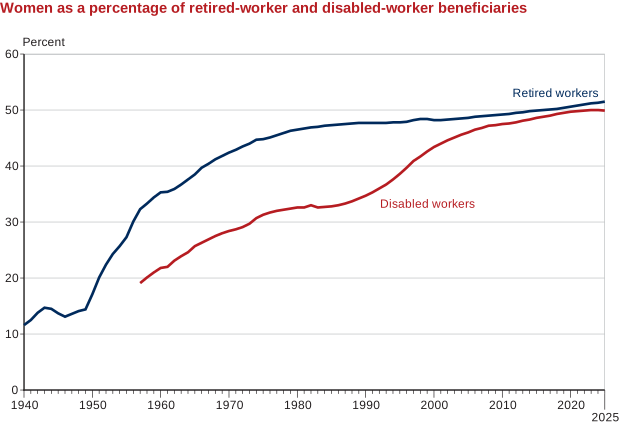
The proportion of women among retired-worker beneficiaries quadrupled between 1940 and 2025. The percentage climbed from 12% in 1940 to 51% in 2025. The proportion of women among disabled-worker beneficiaries more than doubled between 1957, when DI benefits first became payable, and 2025. The percentage rose steadily from 19% in 1957 to 35% in 1990 and 50% in 2025.
| Year | Retired-worker beneficiaries | Disabled-worker beneficiaries |
|---|---|---|
| 1940 | 11.6 | . . . |
| 1941 | 12.5 | . . . |
| 1942 | 13.8 | . . . |
| 1943 | 14.7 | . . . |
| 1944 | 14.5 | . . . |
| 1945 | 13.7 | . . . |
| 1946 | 13.1 | . . . |
| 1947 | 13.6 | . . . |
| 1948 | 14.1 | . . . |
| 1949 | 14.4 | . . . |
| 1950 | 17.1 | . . . |
| 1951 | 20.1 | . . . |
| 1952 | 22.4 | . . . |
| 1953 | 24.3 | . . . |
| 1954 | 25.7 | . . . |
| 1955 | 27.3 | . . . |
| 1956 | 30.1 | . . . |
| 1957 | 32.3 | 19.1 |
| 1958 | 33.3 | 20.1 |
| 1959 | 34.4 | 21.0 |
| 1960 | 35.3 | 21.8 |
| 1961 | 35.4 | 22.0 |
| 1962 | 35.9 | 23.1 |
| 1963 | 36.7 | 23.9 |
| 1964 | 37.6 | 24.6 |
| 1965 | 38.5 | 25.7 |
| 1966 | 39.7 | 26.3 |
| 1967 | 40.4 | 26.9 |
| 1968 | 41.2 | 27.5 |
| 1969 | 41.8 | 28.0 |
| 1970 | 42.4 | 28.4 |
| 1971 | 42.9 | 28.7 |
| 1972 | 43.5 | 29.1 |
| 1973 | 44.0 | 29.7 |
| 1974 | 44.7 | 30.7 |
| 1975 | 44.8 | 31.3 |
| 1976 | 45.1 | 31.7 |
| 1977 | 45.5 | 32.0 |
| 1978 | 45.9 | 32.2 |
| 1979 | 46.3 | 32.4 |
| 1980 | 46.5 | 32.6 |
| 1981 | -- | 32.6 |
| 1982 | 46.9 | 33.0 |
| 1983 | 47.0 | 32.6 |
| 1984 | 47.2 | 32.7 |
| 1985 | 47.3 | 32.8 |
| 1986 | 47.4 | 33.0 |
| 1987 | 47.5 | 33.3 |
| 1988 | 47.6 | 33.7 |
| 1989 | 47.7 | 34.2 |
| 1990 | 47.7 | 34.7 |
| 1991 | 47.7 | 35.3 |
| 1992 | 47.7 | 36.0 |
| 1993 | 47.7 | 36.7 |
| 1994 | 47.8 | 37.6 |
| 1995 | 47.8 | 38.6 |
| 1996 | 47.9 | 39.7 |
| 1997 | 48.2 | 40.9 |
| 1998 | 48.4 | 41.7 |
| 1999 | 48.4 | 42.6 |
| 2000 | 48.2 | 43.4 |
| 2001 | 48.2 | 44.0 |
| 2002 | 48.3 | 44.6 |
| 2003 | 48.4 | 45.1 |
| 2004 | 48.5 | 45.6 |
| 2005 | 48.6 | 46.0 |
| 2006 | 48.8 | 46.5 |
| 2007 | 48.9 | 46.8 |
| 2008 | 49.0 | 47.2 |
| 2009 | 49.1 | 47.3 |
| 2010 | 49.2 | 47.5 |
| 2011 | 49.3 | 47.6 |
| 2012 | 49.5 | 47.8 |
| 2013 | 49.6 | 48.1 |
| 2014 | 49.8 | 48.3 |
| 2015 | 49.9 | 48.6 |
| 2016 | 50.0 | 48.8 |
| 2017 | 50.1 | 49.0 |
| 2018 | 50.2 | 49.3 |
| 2019 | 50.4 | 49.5 |
| 2020 | 50.6 | 49.7 |
| 2021 | 50.8 | 49.8 |
| 2022 | 51.0 | 49.9 |
| 2023 | 51.2 | 50.0 |
| 2024 | 51.3 | 50.0 |
| 2025 | 51.5 | 49.9 |
| NOTE: . . . = not applicable; -- = not available. | ||
Women with Dual Entitlement, 1960–2025
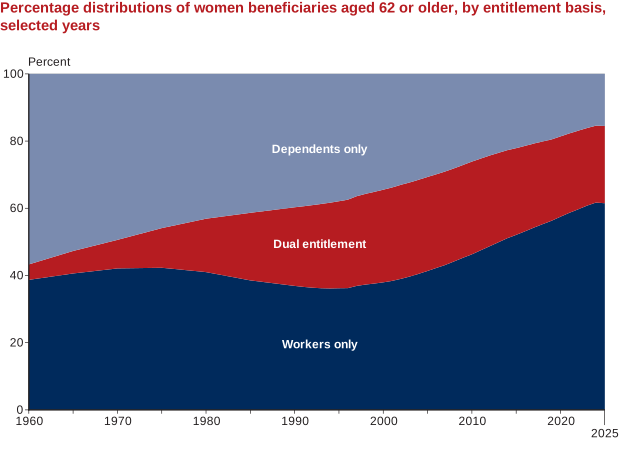
The proportion of women aged 62 or older who are receiving benefits as dependents (that is, on the basis of their spouses' earnings records only) declined from 57% in 1960 to 16% in 2025. At the same time, the proportion of women with dual entitlement (that is, paid on the basis of both their own earnings records and those of their spouses) increased from 5% in 1960 to 23% in 2025.
Child Beneficiaries, December 2025
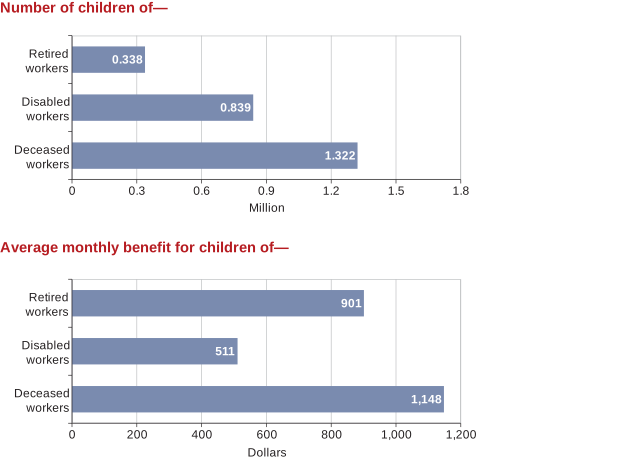
About 2.5 million children under age 18 and students aged 18–19 received OASDI benefits. Children of deceased workers had the highest average payments, in part because they are eligible to receive monthly benefits based on 75% of the worker's PIA, compared with 50% for children of retired or disabled workers. Overall, the average monthly benefit amount for children was $901.
| Type | Number (million) | Average monthly benefit (dollars) |
|---|---|---|
| Children of retired workers | 0.338 | 901 |
| Children of disabled workers | 0.839 | 511 |
| Children of deceased workers | 1.322 | 1,148 |
SSI Program
Recipients in Current-Payment Status, December 1974–2025
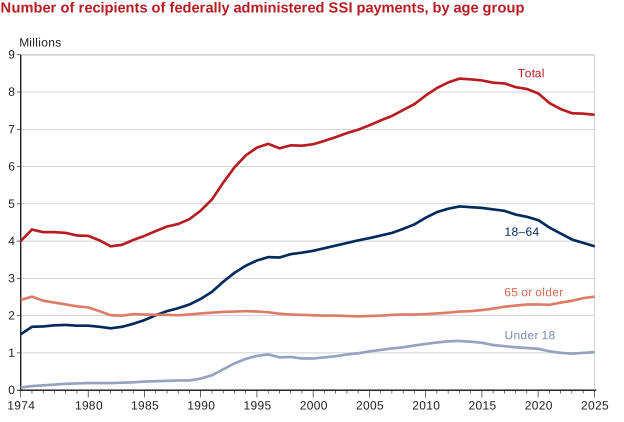
The Supplemental Security Income (SSI) program provides income support to needy persons aged 65 or older, blind or disabled adults, and blind or disabled children. Eligibility requirements and federal payment standards are nationally uniform. Payments under SSI began in January 1974, with 4 million people receiving federally administered payments by the end of that year. The total number of recipients remained fairly stable until the mid-1980s, when it began to rise, reaching a peak of nearly 8.4 million in 2013. Since then, participation has declined slightly. As of December 2025, the number of recipients was about 7.4 million: nearly 4 million aged 18–64, about 2.5 million aged 65 or older, and about 1 million under 18.
| Year | Total | Under 18 | 18–64 | 65 or older |
|---|---|---|---|---|
| 1974 | 4.00 | 0.07 | 1.50 | 2.42 |
| 1975 | 4.31 | 0.11 | 1.70 | 2.51 |
| 1976 | 4.24 | 0.13 | 1.71 | 2.40 |
| 1977 | 4.24 | 0.15 | 1.74 | 2.35 |
| 1978 | 4.22 | 0.17 | 1.75 | 2.30 |
| 1979 | 4.15 | 0.18 | 1.73 | 2.25 |
| 1980 | 4.14 | 0.19 | 1.73 | 2.22 |
| 1981 | 4.02 | 0.19 | 1.70 | 2.12 |
| 1982 | 3.86 | 0.19 | 1.66 | 2.01 |
| 1983 | 3.90 | 0.20 | 1.70 | 2.00 |
| 1984 | 4.03 | 0.21 | 1.78 | 2.04 |
| 1985 | 4.14 | 0.23 | 1.88 | 2.03 |
| 1986 | 4.27 | 0.24 | 2.01 | 2.02 |
| 1987 | 4.39 | 0.25 | 2.12 | 2.02 |
| 1988 | 4.46 | 0.26 | 2.20 | 2.01 |
| 1989 | 4.59 | 0.26 | 2.30 | 2.03 |
| 1990 | 4.82 | 0.31 | 2.45 | 2.06 |
| 1991 | 5.12 | 0.40 | 2.64 | 2.08 |
| 1992 | 5.57 | 0.56 | 2.91 | 2.10 |
| 1993 | 5.98 | 0.72 | 3.15 | 2.11 |
| 1994 | 6.30 | 0.84 | 3.34 | 2.12 |
| 1995 | 6.51 | 0.92 | 3.48 | 2.11 |
| 1996 | 6.61 | 0.96 | 3.57 | 2.09 |
| 1997 | 6.49 | 0.88 | 3.56 | 2.05 |
| 1998 | 6.57 | 0.89 | 3.65 | 2.03 |
| 1999 | 6.56 | 0.85 | 3.69 | 2.02 |
| 2000 | 6.60 | 0.85 | 3.74 | 2.01 |
| 2001 | 6.69 | 0.88 | 3.81 | 2.00 |
| 2002 | 6.79 | 0.91 | 3.88 | 2.00 |
| 2003 | 6.90 | 0.96 | 3.95 | 1.99 |
| 2004 | 6.99 | 0.99 | 4.02 | 1.98 |
| 2005 | 7.11 | 1.04 | 4.08 | 1.99 |
| 2006 | 7.24 | 1.08 | 4.15 | 2.00 |
| 2007 | 7.36 | 1.12 | 4.22 | 2.02 |
| 2008 | 7.52 | 1.15 | 4.33 | 2.03 |
| 2009 | 7.68 | 1.20 | 4.45 | 2.03 |
| 2010 | 7.91 | 1.24 | 4.63 | 2.04 |
| 2011 | 8.11 | 1.28 | 4.78 | 2.06 |
| 2012 | 8.26 | 1.31 | 4.87 | 2.08 |
| 2013 | 8.36 | 1.32 | 4.93 | 2.11 |
| 2014 | 8.34 | 1.30 | 4.91 | 2.12 |
| 2015 | 8.31 | 1.27 | 4.89 | 2.15 |
| 2016 | 8.25 | 1.21 | 4.85 | 2.19 |
| 2017 | 8.23 | 1.18 | 4.81 | 2.24 |
| 2018 | 8.13 | 1.15 | 4.71 | 2.27 |
| 2019 | 8.08 | 1.13 | 4.65 | 2.30 |
| 2020 | 7.96 | 1.11 | 4.56 | 2.30 |
| 2021 | 7.70 | 1.04 | 4.36 | 2.29 |
| 2022 | 7.54 | 1.00 | 4.20 | 2.35 |
| 2023 | 7.43 | 0.98 | 4.04 | 2.40 |
| 2024 | 7.42 | 1.00 | 3.95 | 2.47 |
| 2025 | 7.39 | 1.02 | 3.86 | 2.51 |
Average Payments by Age, December 2025
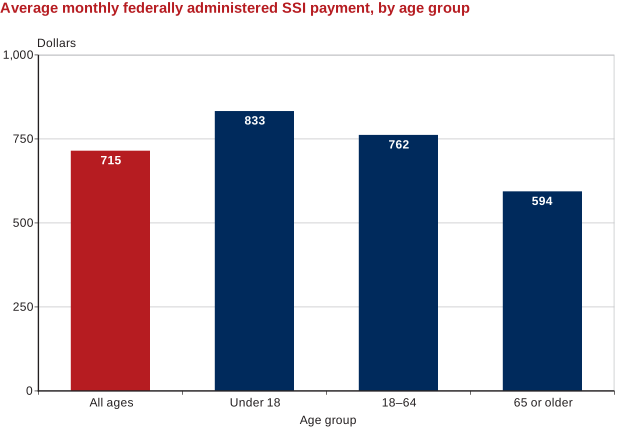
The average monthly federally administered SSI payment was $715. Payments varied by age group, ranging from an average of $833 for recipients aged under 18 to $594 for those aged 65 or older. In 2026, the maximum federal benefit rate is $994 for an individual and $1,491 for a couple, plus any applicable state supplementation.
Types of Payments, December 2025
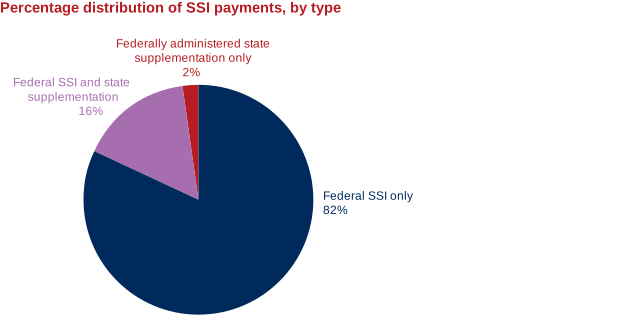
A total of 7.4 million persons received federally administered SSI payments. The majority received federal SSI only. States have the option of supplementing the federal benefit rate and are required to do so if that rate is less than the income the recipient would have had under the former state program.
Basis for Eligibility and Age of Recipients, December 2025
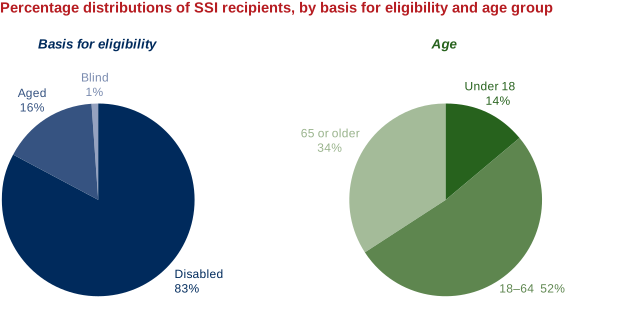
Of all SSI recipients, 16% received benefits on the basis of age and the rest qualified on the basis of disability. Overall, 34% of the recipients were aged 65 or older. In the SSI program, a disabled recipient is still classified as “disabled” after reaching age 65. In the OASDI program, DI beneficiaries are converted to the retirement program when they attain FRA.
Recipients by Age, December 1974–2025
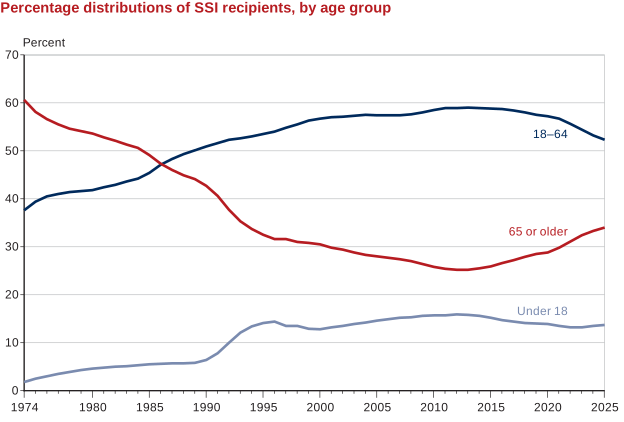
The proportion of SSI recipients aged 65 or older declined from 61% in January 1974 to 34% in December 2025. The overall long-term growth of the SSI program occurred because of an increase in the number of disabled recipients, most of whom are under age 65.
| Year | Under 18 | 18–64 | 65 or older |
|---|---|---|---|
| 1974 | 1.8 | 37.6 | 60.6 |
| 1975 | 2.5 | 39.4 | 58.1 |
| 1976 | 3.0 | 40.5 | 56.6 |
| 1977 | 3.5 | 41.0 | 55.5 |
| 1978 | 3.9 | 41.4 | 54.6 |
| 1979 | 4.3 | 41.6 | 54.1 |
| 1980 | 4.6 | 41.8 | 53.6 |
| 1981 | 4.8 | 42.4 | 52.8 |
| 1982 | 5.0 | 42.9 | 52.1 |
| 1983 | 5.1 | 43.6 | 51.3 |
| 1984 | 5.3 | 44.2 | 50.6 |
| 1985 | 5.5 | 45.4 | 49.1 |
| 1986 | 5.6 | 47.1 | 47.3 |
| 1987 | 5.7 | 48.3 | 46.0 |
| 1988 | 5.7 | 49.3 | 44.9 |
| 1989 | 5.8 | 50.1 | 44.1 |
| 1990 | 6.4 | 50.9 | 42.7 |
| 1991 | 7.8 | 51.6 | 40.6 |
| 1992 | 10.0 | 52.3 | 37.7 |
| 1993 | 12.1 | 52.6 | 35.3 |
| 1994 | 13.4 | 53.0 | 33.7 |
| 1995 | 14.1 | 53.5 | 32.5 |
| 1996 | 14.4 | 54.0 | 31.6 |
| 1997 | 13.5 | 54.8 | 31.6 |
| 1998 | 13.5 | 55.5 | 31.0 |
| 1999 | 12.9 | 56.3 | 30.8 |
| 2000 | 12.8 | 56.7 | 30.5 |
| 2001 | 13.2 | 57.0 | 29.8 |
| 2002 | 13.5 | 57.1 | 29.4 |
| 2003 | 13.9 | 57.3 | 28.8 |
| 2004 | 14.2 | 57.5 | 28.3 |
| 2005 | 14.6 | 57.4 | 28.0 |
| 2006 | 14.9 | 57.4 | 27.7 |
| 2007 | 15.2 | 57.4 | 27.4 |
| 2008 | 15.3 | 57.6 | 27.0 |
| 2009 | 15.6 | 58.0 | 26.4 |
| 2010 | 15.7 | 58.5 | 25.8 |
| 2011 | 15.7 | 58.9 | 25.4 |
| 2012 | 15.9 | 58.9 | 25.2 |
| 2013 | 15.8 | 59.0 | 25.2 |
| 2014 | 15.6 | 58.9 | 25.5 |
| 2015 | 15.2 | 58.8 | 25.9 |
| 2016 | 14.7 | 58.7 | 26.6 |
| 2017 | 14.4 | 58.4 | 27.2 |
| 2018 | 14.1 | 58.0 | 27.9 |
| 2019 | 14.0 | 57.5 | 28.5 |
| 2020 | 13.9 | 57.2 | 28.8 |
| 2021 | 13.5 | 56.7 | 29.8 |
| 2022 | 13.2 | 55.6 | 31.1 |
| 2023 | 13.2 | 54.4 | 32.4 |
| 2024 | 13.5 | 53.2 | 33.3 |
| 2025 | 13.7 | 52.3 | 34.0 |
Recipients by Sex and Age, December 2025
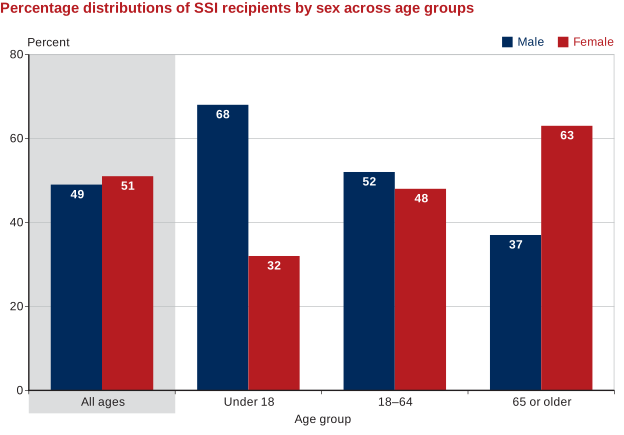
Overall, 51% of the approximately 7.4 million SSI recipients were women, but that percentage varied greatly by age group. Women accounted for 63% of recipients aged 65 or older, 48% of recipients aged 18–64, and 32% of recipients under age 18.
| Age | Men | Women |
|---|---|---|
| All ages | 49 | 51 |
| Under 18 | 68 | 32 |
| 18–64 | 52 | 48 |
| 65 or older | 37 | 63 |
Other Income Sources by Age, December 2025
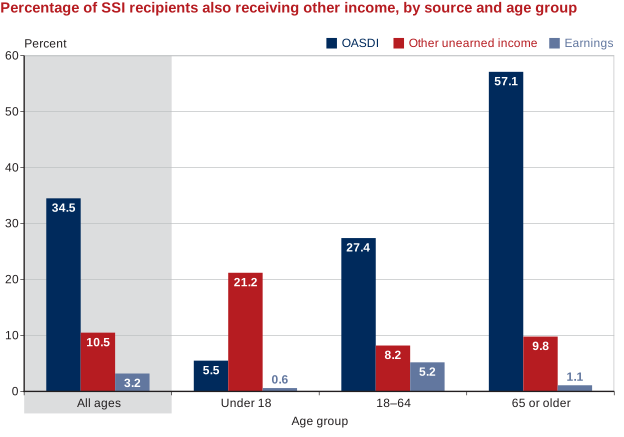
More than 57% of SSI recipients aged 65 or older received OASDI benefits, as did 27.4% of those aged 18–64 and 5.5% of those under age 18. Other types of unearned income, such as income from assets, were reported most frequently among those under age 18 (21.2%) and those aged 65 or older (9.8%). Earned income was most prevalent (5.2%) among those aged 18–64.
| Age group | OASDI | Other unearned income | Earnings |
|---|---|---|---|
| All ages | 34.5 | 10.5 | 3.2 |
| Under 18 | 5.5 | 21.2 | 0.6 |
| 18–64 | 27.4 | 8.2 | 5.2 |
| 65 or older | 57.1 | 9.8 | 1.1 |
Child Recipients, December 1974–2025
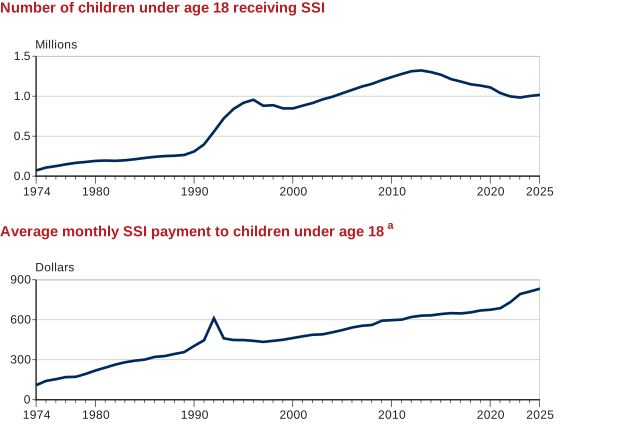
As of December 1974, the program's first year, 70,900 blind and disabled children were receiving SSI. That number has generally increased since then, peaking at more than 1.3 million in 2013, before declining to 1,016,027 in 2025. The relatively high average payment to children (compared with payments made to blind and disabled adults) is due in part to a limited amount of other countable income. The spike in average monthly benefits in 1992 is due to retroactive payments resulting from the Sullivan v. Zebley decision. As of December 2025, blind and disabled children were receiving SSI payments averaging $833.
| Year | Number (in millions) | Average monthly SSI payment a |
|---|---|---|
| 1974 | 0.07090 | 109.15 |
| 1975 | 0.10703 | 141.09 |
| 1976 | 0.12541 | 154.24 |
| 1977 | 0.14736 | 170.03 |
| 1978 | 0.16590 | 171.72 |
| 1979 | 0.17731 | 193.26 |
| 1980 | 0.19039 | 219.08 |
| 1981 | 0.19489 | 240.84 |
| 1982 | 0.19157 | 263.22 |
| 1983 | 0.19832 | 280.96 |
| 1984 | 0.21159 | 292.86 |
| 1985 | 0.22738 | 301.26 |
| 1986 | 0.24120 | 321.34 |
| 1987 | 0.25090 | 327.27 |
| 1988 | 0.25514 | 343.24 |
| 1989 | 0.26489 | 357.64 |
| 1990 | 0.30859 | 403.72 |
| 1991 | 0.39716 | 446.05 |
| 1992 | 0.55647 | 610.98 |
| 1993 | 0.72268 | 460.54 |
| 1994 | 0.84147 | 448.07 |
| 1995 | 0.91705 | 447.57 |
| 1996 | 0.95517 | 442.01 |
| 1997 | 0.87983 | 433.83 |
| 1998 | 0.88707 | 441.75 |
| 1999 | 0.84706 | 450.13 |
| 2000 | 0.84678 | 463.05 |
| 2001 | 0.88184 | 476.09 |
| 2002 | 0.91482 | 487.73 |
| 2003 | 0.95938 | 490.63 |
| 2004 | 0.99313 | 505.98 |
| 2005 | 1.03650 | 522.80 |
| 2006 | 1.07898 | 542.00 |
| 2007 | 1.12102 | 555.00 |
| 2008 | 1.15384 | 561.00 |
| 2009 | 1.19979 | 593.00 |
| 2010 | 1.23927 | 597.00 |
| 2011 | 1.27712 | 601.00 |
| 2012 | 1.31186 | 621.00 |
| 2013 | 1.32168 | 631.00 |
| 2014 | 1.29976 | 633.23 |
| 2015 | 1.26716 | 643.06 |
| 2016 | 1.21308 | 649.58 |
| 2017 | 1.18259 | 647.48 |
| 2018 | 1.14804 | 655.49 |
| 2019 | 1.13208 | 669.78 |
| 2020 | 1.10861 | 675.47 |
| 2021 | 1.03815 | 687.17 |
| 2022 | 0.99711 | 731.99 |
| 2023 | 0.98317 | 793.21 |
| 2024 | 1.00289 | 812.54 |
| 2025 | 1.01603 | 833.22 |
Cross-Program Beneficiaries
Beneficiaries by Program, December 2025
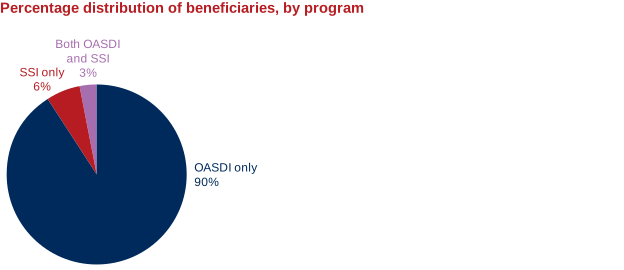
About 74.9 million people received a payment from one or more programs administered by SSA. Most (67.5 million) received OASDI benefits only, 4.9 million received SSI payments only, and 2.5 million received payments from both programs.
| Program | Number (thousands) |
|---|---|
| Total (unduplicated) | 74,897 |
| OASDI | 70,039 |
| OASDI only | 67,505 |
| SSI | 7,392 |
| SSI only | 4,858 |
| Both OASDI and SSI | 2,534 |
Beneficiaries Aged 65 or Older, December 2025
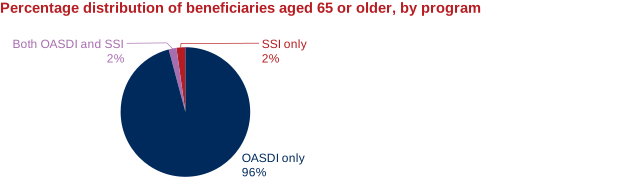
Benefits were paid to 58.3 million people aged 65 or older. About 1.4 million received both OASDI and SSI.
| Type | Number (thousands) |
|---|---|
| Total (unduplicated) | 58,257 |
| OASDI | 57,171 |
| Retired workers | 51,010 |
| Disabled workers | 1,011 |
| Spouses | 1,938 |
| Widow(er)s | a 3,096 |
| Disabled adult children | 117 |
| OASDI only | 55,745 |
| SSI | b 2,512 |
| Receiving SSI only | 1,086 |
| Receiving both OASDI and SSI | 1,426 |
Disabled Beneficiaries Aged 18–64, December 2025
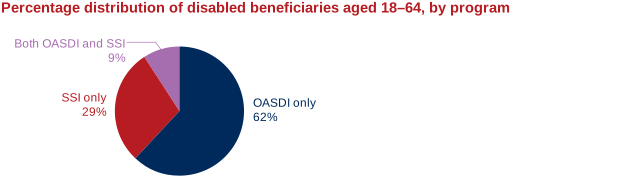
Payments were made to almost 10.1 million people aged 18–64 on the basis of their own disability. Of those individuals, 62% received disability payments from the OASDI program only, 29% received payments from the SSI program only, and 9% received payments from both programs.
| Type | Number (thousands) |
|---|---|
| Total (unduplicated) | 10,102 |
| OASDI disability | 7,160 |
| Workers aged 64 or younger | 5,552 |
| Disabled adult children | 630 |
| Widow(er)s | 56 |
| OASDI disability only | 6,238 |
| SSI disability | 3,864 |
| Receiving SSI disability only | 2,942 |
| Receiving both OASDI and SSI disability | 921 |
Social Security Financing
How Social Security Is Financed
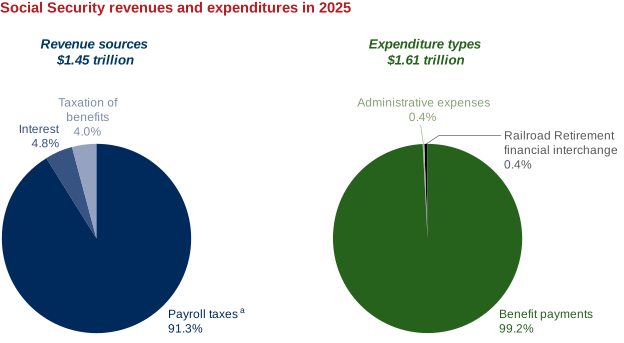
Social Security is largely a pay-as-you-go program. Most of the benefits paid to today's recipients are financed by the payroll taxes collected from today's workers. In 2025, the Old-Age and Survivors Insurance (OASI) and Disability Insurance (DI) Trust Funds collected $1.45 trillion in revenues. Of that amount, 91.3% was from payroll tax contributions and reimbursements from the General Fund of the Treasury and 4.0% was from income taxes on Social Security benefits. Interest earned on the government bonds held by the trust funds provided the remaining 4.8% of income. Assets decreased in 2025 because expenditures for benefit payments and administrative expenses exceeded total income.
Social Security's Demographic Challenge
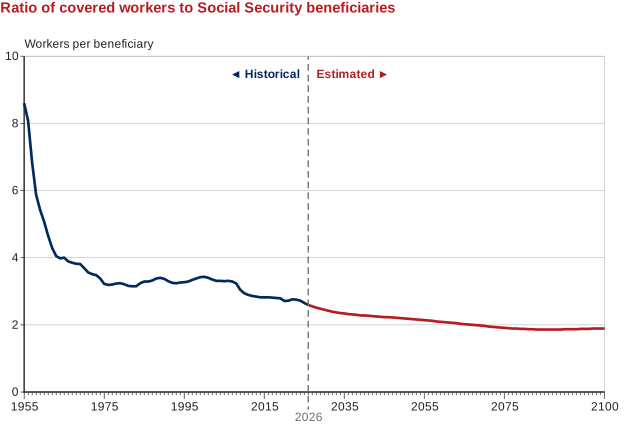
The 2026 Trustees Report projects that the number of retired workers will grow by about 60% over the next 50 years, while birth rates and net immigration are projected to be lower than historical levels. The Trustees project that the ratio of 2.6 workers paying Social Security taxes to each person collecting benefits in 2025 will fall to 2.3 to 1 in 2035. Since 2010, tax and other noninterest income has not fully covered OASI program cost, and the 2026 Trustees Report projects that this pattern will continue for at least 75 years if no program changes are made. However, the Trustees also project that redemption of OASI trust fund assets will be sufficient to allow for full payment of scheduled benefits until 2032.
| Year | Workers per beneficiary |
|---|---|
| 1955 | 8.60 |
| 1956 | 8.07 |
| 1957 | 6.83 |
| 1958 | 5.87 |
| 1959 | 5.42 |
| 1960 | 5.07 |
| 1961 | 4.65 |
| 1962 | 4.29 |
| 1963 | 4.05 |
| 1964 | 3.98 |
| 1965 | 4.00 |
| 1966 | 3.89 |
| 1967 | 3.85 |
| 1968 | 3.82 |
| 1969 | 3.81 |
| 1970 | 3.69 |
| 1971 | 3.56 |
| 1972 | 3.51 |
| 1973 | 3.48 |
| 1974 | 3.38 |
| 1975 | 3.22 |
| 1976 | 3.19 |
| 1977 | 3.20 |
| 1978 | 3.23 |
| 1979 | 3.24 |
| 1980 | 3.21 |
| 1981 | 3.16 |
| 1982 | 3.15 |
| 1983 | 3.15 |
| 1984 | 3.24 |
| 1985 | 3.29 |
| 1986 | 3.29 |
| 1987 | 3.32 |
| 1988 | 3.38 |
| 1989 | 3.40 |
| 1990 | 3.37 |
| 1991 | 3.30 |
| 1992 | 3.25 |
| 1993 | 3.24 |
| 1994 | 3.26 |
| 1995 | 3.27 |
| 1996 | 3.29 |
| 1997 | 3.34 |
| 1998 | 3.38 |
| 1999 | 3.42 |
| 2000 | 3.43 |
| 2001 | 3.40 |
| 2002 | 3.35 |
| 2003 | 3.31 |
| 2004 | 3.31 |
| 2005 | 3.30 |
| 2006 | 3.31 |
| 2007 | 3.29 |
| 2008 | 3.23 |
| 2009 | 3.04 |
| 2010 | 2.94 |
| 2011 | 2.89 |
| 2012 | 2.86 |
| 2013 | 2.84 |
| 2014 | 2.82 |
| 2015 | 2.82 |
| 2016 | 2.82 |
| 2017 | 2.81 |
| 2018 | 2.80 |
| 2019 | 2.79 |
| 2020 | 2.71 |
| 2021 | 2.72 |
| 2022 | 2.76 |
| 2023 | 2.75 |
| 2024 | 2.72 |
| 2025 | 2.65 |
| 2026 | 2.59 |
| 2027 | 2.55 |
| 2028 | 2.51 |
| 2029 | 2.48 |
| 2030 | 2.45 |
| 2031 | 2.42 |
| 2032 | 2.39 |
| 2033 | 2.37 |
| 2034 | 2.35 |
| 2035 | 2.34 |
| 2036 | 2.32 |
| 2037 | 2.31 |
| 2038 | 2.30 |
| 2039 | 2.28 |
| 2040 | 2.28 |
| 2041 | 2.27 |
| 2042 | 2.26 |
| 2043 | 2.25 |
| 2044 | 2.24 |
| 2045 | 2.23 |
| 2046 | 2.23 |
| 2047 | 2.22 |
| 2048 | 2.21 |
| 2049 | 2.20 |
| 2050 | 2.19 |
| 2051 | 2.18 |
| 2052 | 2.17 |
| 2053 | 2.16 |
| 2054 | 2.15 |
| 2055 | 2.14 |
| 2056 | 2.13 |
| 2057 | 2.12 |
| 2058 | 2.10 |
| 2059 | 2.09 |
| 2060 | 2.08 |
| 2061 | 2.07 |
| 2062 | 2.06 |
| 2063 | 2.05 |
| 2064 | 2.03 |
| 2065 | 2.02 |
| 2066 | 2.01 |
| 2067 | 2.00 |
| 2068 | 1.99 |
| 2069 | 1.98 |
| 2070 | 1.97 |
| 2071 | 1.95 |
| 2072 | 1.94 |
| 2073 | 1.93 |
| 2074 | 1.92 |
| 2075 | 1.91 |
| 2076 | 1.90 |
| 2077 | 1.89 |
| 2078 | 1.89 |
| 2079 | 1.88 |
| 2080 | 1.88 |
| 2081 | 1.87 |
| 2082 | 1.87 |
| 2083 | 1.86 |
| 2084 | 1.86 |
| 2085 | 1.86 |
| 2086 | 1.86 |
| 2087 | 1.86 |
| 2088 | 1.86 |
| 2089 | 1.86 |
| 2090 | 1.87 |
| 2091 | 1.87 |
| 2092 | 1.87 |
| 2093 | 1.87 |
| 2094 | 1.88 |
| 2095 | 1.88 |
| 2096 | 1.88 |
| 2097 | 1.89 |
| 2098 | 1.89 |
| 2099 | 1.89 |
| 2100 | 1.89 |
The Long-Run Financial Outlook
Social Security is not sustainable over the long term at current benefit and tax rates. Since 2010, the program has annually paid more in benefits and expenses than it collected in taxes and other noninterest income, and the 2026 Trustees Report projects this pattern to continue for the next 75 years. The Trustees estimate that the combined OASI and DI trust fund reserves will be depleted by 2034. At that point, payroll taxes and other income will flow into the fund but will be sufficient to pay only about 83% of program costs. As reported in the 2026 Trustees Report, the projected shortfall over the next 75 years is 4.24% of taxable payroll.
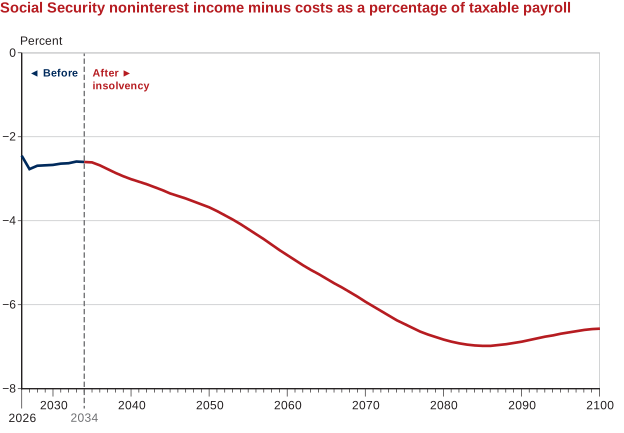
| Year | Percent |
|---|---|
| 2026 | -2.45 |
| 2027 | -2.77 |
| 2028 | -2.69 |
| 2029 | -2.68 |
| 2030 | -2.67 |
| 2031 | -2.64 |
| 2032 | -2.63 |
| 2033 | -2.59 |
| 2034 | -2.60 |
| 2035 | -2.61 |
| 2036 | -2.68 |
| 2037 | -2.77 |
| 2038 | -2.86 |
| 2039 | -2.94 |
| 2040 | -3.01 |
| 2041 | -3.07 |
| 2042 | -3.13 |
| 2043 | -3.20 |
| 2044 | -3.27 |
| 2045 | -3.35 |
| 2046 | -3.41 |
| 2047 | -3.47 |
| 2048 | -3.54 |
| 2049 | -3.61 |
| 2050 | -3.68 |
| 2051 | -3.77 |
| 2052 | -3.87 |
| 2053 | -3.97 |
| 2054 | -4.08 |
| 2055 | -4.20 |
| 2056 | -4.32 |
| 2057 | -4.44 |
| 2058 | -4.57 |
| 2059 | -4.70 |
| 2060 | -4.82 |
| 2061 | -4.94 |
| 2062 | -5.06 |
| 2063 | -5.17 |
| 2064 | -5.27 |
| 2065 | -5.38 |
| 2066 | -5.49 |
| 2067 | -5.59 |
| 2068 | -5.70 |
| 2069 | -5.81 |
| 2070 | -5.93 |
| 2071 | -6.04 |
| 2072 | -6.15 |
| 2073 | -6.26 |
| 2074 | -6.37 |
| 2075 | -6.46 |
| 2076 | -6.55 |
| 2077 | -6.64 |
| 2078 | -6.71 |
| 2079 | -6.77 |
| 2080 | -6.83 |
| 2081 | -6.88 |
| 2082 | -6.92 |
| 2083 | -6.95 |
| 2084 | -6.97 |
| 2085 | -6.98 |
| 2086 | -6.98 |
| 2087 | -6.96 |
| 2088 | -6.94 |
| 2089 | -6.91 |
| 2090 | -6.88 |
| 2091 | -6.84 |
| 2092 | -6.80 |
| 2093 | -6.76 |
| 2094 | -6.73 |
| 2095 | -6.69 |
| 2096 | -6.66 |
| 2097 | -6.63 |
| 2098 | -6.60 |
| 2099 | -6.58 |
| 2100 | -6.57 |
Abbreviations
- AIME
- average indexed monthly earnings
- DI
- Disability Insurance
- FICA
- Federal Insurance Contributions Act
- FRA
- full retirement age
- HI
- Hospital Insurance
- OASDI
- Old-Age, Survivors, and Disability Insurance
- OASI
- Old-Age and Survivors Insurance
- PIA
- primary insurance amount
- SECA
- Self-Employment Contributions Act
- SSA
- Social Security Administration
- SSI
- Supplemental Security Income
Notes
Any corrections to the statistics in this chartbook will be posted as errata at https://www.ssa.gov/policy
Because some values in this chartbook are independently rounded, the sum of components may not equal reported totals, and percentage distributions may not total 100.