How Many SSI Recipients Live with Other Recipients?
Policy Brief No. 2004-03 (released June 2004)
The data presented in this Policy Brief are from Melissa Koenig and Kalman Rupp, "SSI Recipients in Households and Families with Multiple Recipients: Prevalence and Poverty Outcomes," forthcoming in Social Security Bulletin vol. 65 (2004). The results are based on Survey of Income and Program Participation files from March 1996, January 1998, and December 1998 matched to Social Security Administration administrative records.
This brief was prepared by Susan Wilschke of the Social Security Administration's Office of Disability and Income Assistance Policy.
Questions about the analysis should be directed to her at 202-358-6275.
The findings and conclusions presented in this brief are those of the author and do not necessarily represent the views of the Social Security Administration.
The Office of Policy recently completed an analysis of the prevalence of multirecipient households in the Supplemental Security Income (SSI) program. The study was based on Survey of Income and Program Participation (SIPP) data for December 1998 matched to administrative records from the Social Security Administration (SSA).
The study found that roughly 30 percent of individuals receiving SSI benefits lived in the same household with at least one other SSI recipient.1 That estimate is substantially higher than was previously thought. Earlier estimates were based on SSA's administrative records alone, which contain limited information about other members of a recipient's household. SIPP, however, provides detailed information about household composition and income.
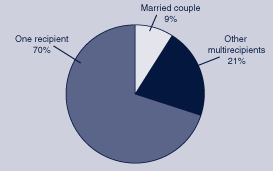
The 30 percent of SSI recipients living in multirecipient households can be divided into two groups—married couples and other, noncouple multirecipients. As shown in Chart 1, married couples account for approximately 9 percent of all recipients. The married classification is important because these SSI couples receive a benefit rate that is equal to 1.5 times the benefit rate for an individual, and there is a unique set of issues concerning their status.2 This policy brief, however, focuses primarily on the 21 percent who live in noncouple multirecipient households—such as a disabled parent and child or two disabled siblings—and provides information on their age, the size of their household, and their poverty status.
SSI recipients, by type of household

| Type of household | Percent |
|---|---|
| One recipient | 70 |
| Married couple | 9 |
| Other multirecipients | 21 |
Age and Household Composition
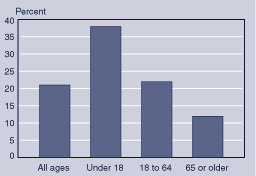
As Chart 2 shows, 21 percent of all SSI recipients, not including married couples, live in multirecipient households.
- Children are the most likely to live with another SSI recipient—38 percent of all SSI children live with another recipient. The elderly are the least likely to live in noncouple multirecipient households.
- Approximately 30 percent of children who live with another SSI recipient live in households in which children are the only recipients, most likely with a sibling who also receives SSI. Ninety-two percent of this subset of SSI children live with one other SSI sibling, and 8 percent live with two or more recipient siblings.
- The composition of noncouple multirecipient households is often mixed between different age groups. Of the remaining 70 percent of children in multirecipient households, most live in households that also contain a working-age adult, most likely a disabled parent. Thirty-two percent of noncouple multirecipient households are made up of working-age recipients only, and 23 percent contain working-age and aged recipients. Most multirecipients (82 percent) live in family households, although not necessarily only with other recipient family members. However, the exact relationship between them is not known.
- Most recipients in multirecipient households (80 percent) are in households with two SSI recipients (Table 1). Of the remainder, 15 percent are in households with three recipients, and 5 percent are part of households with four or more recipients. Though not shown in the table, the 80 percent living in households with two recipients includes both married-couple recipients only (30 percent) and noncouple multirecipients (50 percent).
Percentage of SSI recipients in each age group who live in a noncouple multirecipient household

| Age group | Percent |
|---|---|
| All ages | 21.00 |
| Under 18 | 38.00 |
| 18–64 | 22.00 |
| 65 or older | 12.00 |
| Number of recipients | Total | Under 18 | 18 to 64 | 65 or older |
|---|---|---|---|---|
| Two | 80 | 74 | 78 | 87 |
| Three | 15 | 19 | 15 | 13 |
| Four or more | 5 | 7 | 7 | 1 |
| SOURCE: Author's calculations based on data set used for Melissa Koenig and Kalman Rupp, "The Poverty Status of Different Types of Multirecipient Households: Is SSI Fair to Married Couples?" Paper presented at the 2002 Annual Meeting of the Population Association of America, Atlanta, GA (2002). | ||||
Economic Status
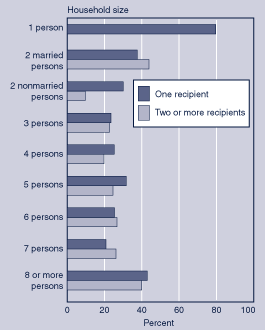
SSI recipients who live alone have high rates of poverty, with nearly 80 percent having household income below the poverty threshold, as shown in Chart 3. Married couples in which both members receive SSI have higher rates of poverty (44 percent) than do married couples with one spouse receiving SSI (38 percent). It is also interesting to compare two-person households consisting of two married recipients with those consisting of two nonmarried recipients. The nonmarried recipients have significantly lower rates of poverty (10 percent). Households with two to five members and more than one SSI recipient tend to have slightly lower rates of poverty than do households of that size with only one SSI recipient.
Percentage of SSI recipients in poverty, by household size and number of SSI recipients in household

| Persons in household | One recipient | Two or more recipients |
|---|---|---|
| 1 | 79.7 | . . . |
| 2 married | 37.5 | 43.9 |
| 2 nonmarried | 30 | 9.6 |
| 3 | 23.4 | 22.6 |
| 4 | 25.2 | 19.7 |
| 5 | 31.6 | 24.5 |
| 6 | 25.4 | 26.7 |
| 7 | 20.8 | 26.2 |
| 8 or more | 42.9 | 39.9 |
| NOTE: . . . = not applicable. | ||
Data and Policy Implications
Although this brief has focused on multirecipient households, another important part of the story involves recipients living in households with nonrecipients. All SSI recipients can enjoy economies of scale by living with another person. This is the case for both one-recipient and multirecipient households. As seen in Chart 3, SSI recipients who live with at least one other person have lower household poverty rates than recipients who live alone. In addition, three points should be noted about the results presented here.
- The matched SIPP data provide better information about household composition than has been available through previous techniques using administrative data alone. By their nature, the administrative data capture only the information that is necessary to determine eligibility and benefit level for the current program. The SIPP data, however, are less current.
- Despite occasional anecdotes to the contrary, relatively few families have more than one SSI child in the household. Thirty-eight percent of SSI children live in multirecipient households, but most of those consist of one child and an adult. Only 11 percent of all SSI children live with other SSI children only.
- As a program of last resort, SSI tries to ensure that beneficiaries end up in similar circumstances. That is why the program rules provide a complex system for reducing payments if recipients get in-kind support or housing. However, under the current benefit structure, SSI recipients who live with others are much less likely to be living in poverty than are recipients who live alone. Differences in poverty status based on marital status are also evident in Chart 3. This disparity suggests that it may be appropriate to review the way that SSI treats living arrangements.
Notes
1 The estimate of 30 percent is the most recent estimate available. There is no reason to conclude that the percentage has changed substantially since then.
2 See Richard Balkus and Susan Wilschke, Treatment of Married Couples in the SSI Program, Issue Paper No. 2003-01 (Washington, DC: Social Security Administration, Office of Policy, December 2003).