Distributional Effects of Reducing the Social Security Benefit Formula
Policy Brief No. 2010-02 (released November 2010)
A person's Social Security benefit, or primary insurance amount (PIA), is 90 percent of the lowest portion of lifetime earnings, plus 32 percent of the middle portion of lifetime earnings, plus 15 percent of the highest portion of lifetime earnings. This policy brief analyzes the distributional effects of three options (the three-point, five-point and upper) discussed by the Social Security Advisory Board to reduce the PIA. The first option would reduce the PIA by 3 percentage points; the second would reduce it by 5 percentage points; and the third would reduce the 32 and 15 percentages of the PIA to 21 and 10 percent, respectively. The third option would exempt about one quarter of the lowest earning beneficiaries, while reducing benefits by a median average of 19 percent in 2070. None would eliminate Social Security's long-term fiscal imbalance, although the third option would eliminate more (76 percent) of the deficit than the three-point (18 percent) and five-point (31 percent) options.
Glenn Springstead is with SSA's Office of Retirement and Disability Policy. Questions about this analysis should be directed to the author at (202) 358-6234.
The findings and conclusions presented in this brief are those of the author and do not necessarily represent the views of the Social Security Administration.
Summary
| AIME | average indexed monthly earnings |
| MINT | Modeling Income in the Near Term |
| PIA | primary insurance amount |
| SSA | Social Security Administration |
This policy brief analyzes the distributional effects of three options to reduce Social Security benefits as set forth by the Social Security Advisory Board.1 The first would reduce benefits 3 percent for all newly eligible beneficiaries (three-point option), the second would reduce benefits 5 percent for all newly eligible beneficiaries (five-point option); and the third would reduce benefits for all but the lowest lifetime earners (upper option).
The distributional results were estimated using the Social Security Administration's (SSA's) Modeling Income in the Near Term (MINT) model projections of Social Security beneficiaries aged 62 or older in 2030, 2050, and 2070.2 The benefit changes are compared to benefits scheduled under current program rules (scheduled benefits) and to benefits that could be paid by payroll tax revenue when the trust funds are exhausted in 2037 (payable benefits). SSA's Office of the Chief Actuary developed the solvency estimates, based on the 2009 Social Security Trustees Report.
Major Findings
The largest benefit reductions would be under the upper option, which would close 76 percent of Social Security's long-range actuarial imbalance. The five-point option would reduce the imbalance by 31 percent and the three-point option would reduce the imbalance by 18 percent.
The upper option would shield about 13 percent of beneficiaries in the lowest household income quintile and 26 percent of beneficiaries in the lowest lifetime wage quintile from any benefit reductions.3 The three-point and five-point options would affect nearly all beneficiaries by 2070. The upper option would reduce benefits by a median of 19 percent by 2070, but shielding low-lifetime earning beneficiaries would result in the lowest lifetime wage quintile having about the same percent reduction in benefits (-5.0 percent) under the upper and five-point options.
All three options would increase the number of aged beneficiaries in poverty in 2070 compared to scheduled benefits, but would reduce the number in poverty compared to payable benefits. The upper option would not increase poverty as much as the five-point or the three-point options.
Current Law and Proposed Options
The monthly Social Security benefit a worker receives is based on the primary insurance amount (PIA), which is the benefit amount before any adjustments for early retirement.4 The PIA's three-tier formula replaces a portion of lifetime wages by providing 90 percent of the lowest portion of a person's average indexed monthly earnings (AIME), 32 percent of the middle portion of the AIME, and 15 percent of the highest portion of the AIME.5 The different percentage amounts provide a higher benefit replacement rate for beneficiaries with lower AIME amounts compared with those with higher AIME amounts.6 Chart 1 illustrates how the various percentages apply to the AIME amount.
Primary insurance amount formula for those newly eligible in 2009
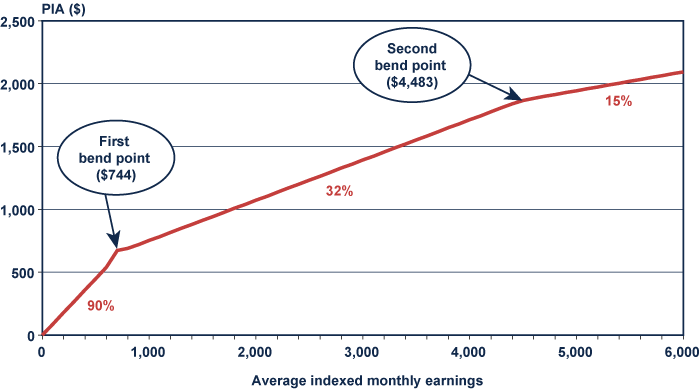
In 2009, the Social Security PIA formula was 90 percent of the first $744 of the AIME, plus 32 percent of any AIME amount between $744 and $4,483, plus 15 percent of any AIME amount beyond $4,483. Under current law, the 90, 32, and 15 percent PIA factors remain the same each year. However, the bend points, the dollar amounts that separate the PIA factors, increase each year based on the change in the average wage index.
According to the 2010 Social Security Trustees Report, Social Security will not have enough revenue to pay the full value of benefits beginning in 2037 when the trust funds become exhausted. If no action is taken before then to restore the system's solvency, benefits for all beneficiaries would need to be reduced by about 25 percent throughout the remainder of the 75-year projection period.7
The PIA changes studied by the Social Security Advisory Board would reduce benefits for newly eligible beneficiaries beginning in 2010. The PIA formula would remain the same under the three-point and five- point options. The benefit reductions, percentage-wise, under these options would apply to all beneficiaries regardless of AIME amount or whether they receive a disability or retirement benefit.
The upper option would reduce the PIA formula's 32 percent and 15 percent factors over 31 years to 21 percent and 10 percent, respectively. All newly eligible beneficiaries after 2039 would have a PIA formula comprised of 90 percent, 21 percent, and 10 percent factors. Beneficiaries with AIME amounts under the 90 percent level would not face a reduction in PIA under the upper option. This proposal protects the retirement benefits of the lowest lifetime earners. However, it may not necessarily afford protection to those low earners who ultimately receive a survivor benefit on the record of a higher earner.
Each Option Would Improve Solvency by Reducing Benefits
The upper option would reduce Social Security's long-range actuarial imbalance by 76 percent. The five-point option would reduce the imbalance by 31 percent, while the three-point option would reduce it by 18 percent (Table 1).
| Solvency effect | Three point | Five point | Upper |
|---|---|---|---|
| Change in actuarial balance (percent of taxable payroll) | 0.36 | 0.61 | 1.51 |
| Percentage of long-range actuarial imbalance fixed | 18.00 | 30.50 | 75.50 |
| Percentage of annual shortfall fixed in the 75th year | 11.52 | 19.36 | 67.74 |
| SOURCE: SSA's Office of the Chief Actuary, based on the intermediate assumptions of the 2009 Trustees Report, http://www.socialsecurity.gov/OACT/solvency/provisions/benefitlevel.html. | |||
Chart 2 illustrates the impact for each option over time and relative to the benefit reductions that would be necessary if the Social Security trust fund is allowed to become exhausted in 2037.
Average percent benefit reduction under the Social Security Advisory Board PIA options and payable benefit levels
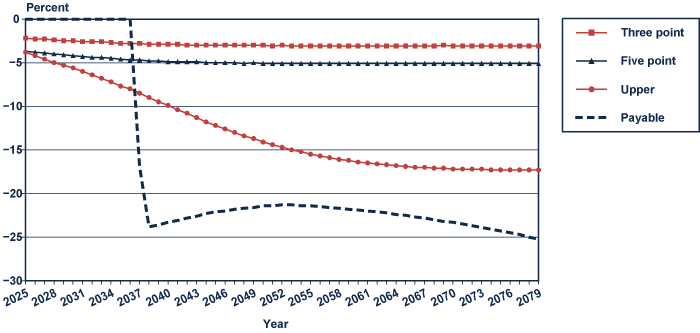
| Year | Three point | Five point | Upper | Payable benefit |
|---|---|---|---|---|
| 2025 | -2.2 | -3.7 | -3.8 | 0 |
| 2026 | -2.3 | -3.8 | -4.2 | 0 |
| 2027 | -2.3 | -3.9 | -4.6 | 0 |
| 2028 | -2.4 | -4.0 | -5.0 | 0 |
| 2029 | -2.5 | -4.1 | -5.3 | 0 |
| 2030 | -2.5 | -4.2 | -5.6 | 0 |
| 2031 | -2.6 | -4.3 | -6.0 | 0 |
| 2032 | -2.6 | -4.4 | -6.4 | 0 |
| 2033 | -2.6 | -4.4 | -6.8 | 0 |
| 2034 | -2.7 | -4.5 | -7.2 | 0 |
| 2035 | -2.8 | -4.6 | -7.7 | 0 |
| 2036 | -2.8 | -4.7 | -8.0 | 0 |
| 2037 | -2.8 | -4.7 | -8.5 | -16.9 |
| 2038 | -2.9 | -4.8 | -9.0 | -23.8 |
| 2039 | -2.9 | -4.8 | -9.5 | -23.6 |
| 2040 | -2.9 | -4.9 | -9.9 | -23.3 |
| 2041 | -2.9 | -4.9 | -10.4 | -23.1 |
| 2042 | -3.0 | -4.9 | -10.8 | -22.8 |
| 2043 | -3.0 | -4.9 | -11.3 | -22.6 |
| 2044 | -3.0 | -5.0 | -11.8 | -22.3 |
| 2045 | -3.0 | -5.0 | -12.2 | -22.1 |
| 2046 | -3.0 | -5.0 | -12.6 | -22.0 |
| 2047 | -3.0 | -5.0 | -13.0 | -21.8 |
| 2048 | -3.0 | -5.1 | -13.4 | -21.7 |
| 2049 | -3.0 | -5.0 | -13.7 | -21.6 |
| 2050 | -3.0 | -5.1 | -14.1 | -21.4 |
| 2051 | -3.1 | -5.1 | -14.4 | -21.4 |
| 2052 | -3.0 | -5.1 | -14.7 | -21.3 |
| 2053 | -3.1 | -5.1 | -15.0 | -21.3 |
| 2054 | -3.1 | -5.1 | -15.2 | -21.4 |
| 2055 | -3.1 | -5.1 | -15.5 | -21.4 |
| 2056 | -3.1 | -5.1 | -15.7 | -21.5 |
| 2057 | -3.1 | -5.1 | -15.9 | -21.6 |
| 2058 | -3.1 | -5.1 | -16.1 | -21.7 |
| 2059 | -3.1 | -5.1 | -16.2 | -21.8 |
| 2060 | -3.1 | -5.1 | -16.4 | -21.9 |
| 2061 | -3.1 | -5.1 | -16.5 | -22.0 |
| 2062 | -3.1 | -5.1 | -16.6 | -22.1 |
| 2063 | -3.1 | -5.1 | -16.7 | -22.2 |
| 2064 | -3.1 | -5.1 | -16.8 | -22.4 |
| 2065 | -3.1 | -5.1 | -16.9 | -22.5 |
| 2066 | -3.1 | -5.1 | -17.0 | -22.7 |
| 2067 | -3.1 | -5.1 | -17.0 | -22.8 |
| 2068 | -3.1 | -5.1 | -17.1 | -23.0 |
| 2069 | -3.0 | -5.1 | -17.1 | -23.2 |
| 2070 | -3.1 | -5.1 | -17.2 | -23.3 |
| 2071 | -3.1 | -5.1 | -17.2 | -23.5 |
| 2072 | -3.1 | -5.1 | -17.2 | -23.7 |
| 2073 | -3.1 | -5.1 | -17.2 | -23.9 |
| 2074 | -3.1 | -5.1 | -17.3 | -24.1 |
| 2075 | -3.1 | -5.1 | -17.3 | -24.3 |
| 2076 | -3.1 | -5.1 | -17.3 | -24.5 |
| 2077 | -3.1 | -5.1 | -17.3 | -24.7 |
| 2078 | -3.1 | -5.1 | -17.3 | -25.0 |
| 2079 | -3.1 | -5.1 | -17.3 | -25.2 |
The Upper Option Would Shield About One-Quarter of the Lowest Lifetime Earners from any Benefit Reduction
Although the upper option would result in higher average benefit reductions than the three-point and five-point options (Chart 2), fewer beneficiaries would be affected by the upper option. Compared to scheduled benefits, the upper option would affect 96 percent of beneficiaries overall in 2070, but only 74 percent of those in the lowest lifetime wage quintile (Chart 3). The upper option would affect 87 percent of those in the lowest household income quintile, and would affect 89 percent of survivor-only beneficiaries, who by definition would have low levels of lifetime Social Security-covered earnings. The three-point and five-point options would affect all beneficiaries equally across all quintiles.
Percent of beneficiaries affected under PIA options by lifetime wage quintile in 2070 (compared to scheduled benefits)
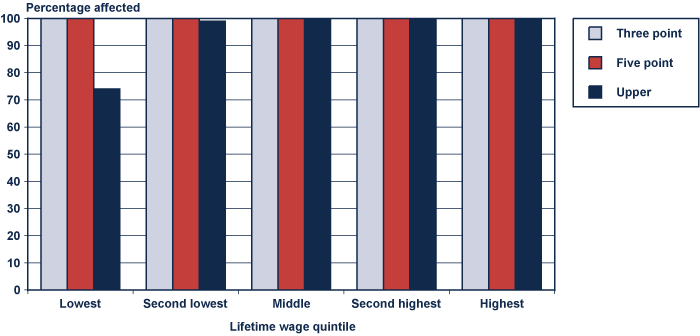
| Option | Lifetime wage quintile | ||||
|---|---|---|---|---|---|
| Lowest | Second lowest | Middle | Second highest | Highest | |
| Three Point | 100 | 100 | 100 | 100 | 100 |
| Five Point | 100 | 100 | 100 | 100 | 100 |
| Upper | 74 | 99 | 100 | 100 | 100 |
The upper option would reduce benefits by a median of 19 percent compared to scheduled benefits in 2070. However, with the upper option's shielding of 26 percent of low-lifetime wage earners, that option would reduce benefits by only 5 percent overall for those in the lowest lifetime wage quintile, the same reduction this group would face under the five-point option (Chart 4). The median benefit reduction for affected beneficiaries in the lowest quintiles would be slightly higher under the upper option than under the five-point option. The upper option would reduce benefits for affected beneficiaries in the lowest lifetime wage quintile by a median of 8 percent, and for affected beneficiaries in the lowest household income quintile by a median of 13 percent (not shown). Benefits for affected survivor-only beneficiaries under the upper option would be reduced by 15.7 percent, or almost twice the reduction for the lowest lifetime earners. If benefits were reduced beginning in 2037 to reflect the amount of revenue being received by SSA (payable), the average change in benefits overall would be about -23 percent.
Median percent benefit reduction under primary insurance amount options by lifetime wage quintile in 2070 (compared to scheduled benefits)
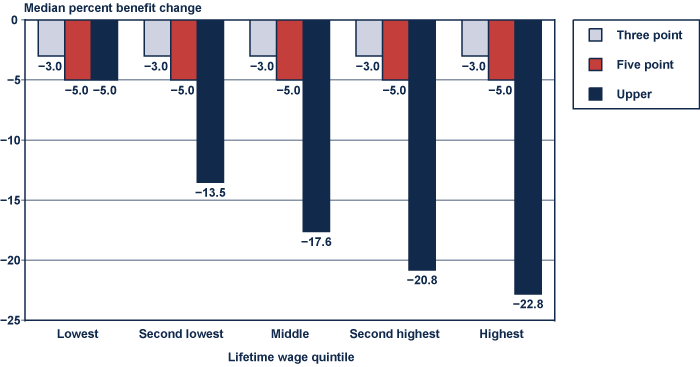
| Option | Lifetime wage quintile | ||||
|---|---|---|---|---|---|
| Lowest | Second lowest | Middle | Second highest | Highest | |
| Three Point | -3.0 | -3.0 | -3.0 | -3.0 | -3.0 |
| Five Point | -5.0 | -5.0 | -5.0 | -5.0 | -5.0 |
| Upper | -5.0 | -13.5 | -17.6 | -20.8 | -22.8 |
The Upper Option Would Leave Fewer Aged Beneficiaries in Poverty Than the Three-Point or Five-Point Options
Each option would increase the number of aged beneficiaries in poverty in 2070 compared to scheduled benefits. However, the upper option would leave fewer aged beneficiaries in poverty (66,052) than the three-point (75,327) and five-point (134,845) options in 2070 (Chart 5). Although the average benefit reduction under the upper option would be several times greater than the three-point option in 2070, the upper option would exclude, as previously shown, roughly a quarter of aged beneficiaries from the lowest lifetime wage quintile. The design of the upper option thus helps limit increases in poverty.
The number of aged in poverty would increase under each option (compared to scheduled benefits)
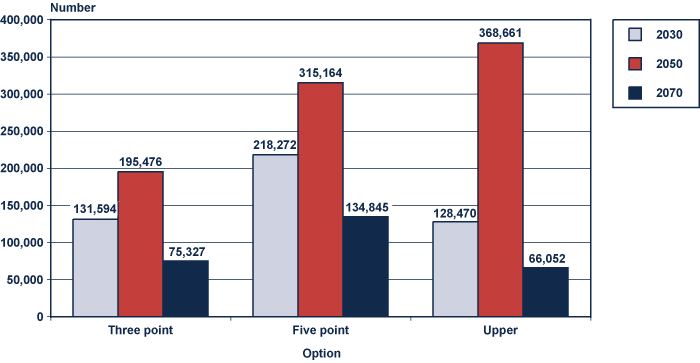
| Year | Option | ||
|---|---|---|---|
| Three point | Five point | Upper | |
| 2030 | 131,594 | 218,272 | 128,470 |
| 2050 | 195,476 | 315,164 | 368,661 |
| 2070 | 75,327 | 134,845 | 66,052 |
Percentage-wise, the poverty rate for aged beneficiaries under scheduled benefits is estimated to be 0.9 percent in 2070. Under the five-point option, the aged beneficiary poverty rate would rise to 1.1 percent. Under the three-point and upper options, the aged beneficiary poverty rate would rise to 1.0 percent. In 2008, the poverty rate for the population aged 65 or older was lower (9.7 percent) than for the population as a whole (13.2 percent) and those aged 18–64 (11.7 percent).8 The decline in poverty between 2008 and 2070 reflects the fact that poverty thresholds are indexed to price inflation, while household income grows at the generally higher rate of wage growth.
Notes
1 Social Security Advisory Board, Social Security: Why Action Should Be Taken Soon. September 2005. http://www.ssab.gov/documents/WhyActionShouldbeTakenSoon.pdf.
2 The comparison is a static one with no behavioral response to the policy options' effect on benefits or income. The MINT model is based on Social Security administrative data matched to the Survey of Income and Program Participation (SIPP). Work, marriage, retirement, and death are projected for real and imputed individuals based on real earnings, marital histories, and education levels.
3 Household income quintiles are based on the individual's annual household income. This includes household earnings, asset income (which includes income from defined contribution plans), defined benefit pensions, Social Security (scheduled benefits), Supplemental Security Income (SSI), and income from non-spousal coresidents. This is the same income amount that is used to determine poverty status. Lifetime wages are the present value of real (inflation-adjusted) shared lifetime total earnings. Shared earnings are the same as individual earnings except that the earnings for married couples are shared, that is, the sum total of the married couple's earnings are divided in half and each half is attributed to one of the spouses. The present value is calculated using a discount rate equal to the new issue rate for the Social Security trust funds. This discount rate is based on actual rates and varies from 1951–2007. From 2008–2016 it varies from 1.9 to 3.0 percent based on short-term projections of the Office of the Chief Actuary (OCACT), and from 2017 on it stays constant at 2.9 percent based on long-term OCACT projections. These rates are used for all of our present value calculations.
4 The full retirement age (FRA) is 66 for newly eligible beneficiaries and will begin increasing to age 67 in 2017. Insured workers and their spouses may claim benefits as early as age 62, but those benefits are reduced for retired workers by 6.67 percent per year for the first 3 years of benefit receipt before the FRA and by 8.33 percent per year for the first 3 years for spouses. Benefits for insured workers and their spouses are reduced by 5.0 percent each in the fourth and fifth years of early benefit receipt. Benefits can also be reduced if there are substantial earnings in retirement or if the beneficiary is entitled to pensions from employment not covered under the Social Security system.
5 For details about the PIA computation, see http://www.socialsecurity.gov/OACT/COLA/piaformula.html.
6 The replacement rate is the percentage of preretirement or lifetime average earnings available to a worker during retirement. See http://www.socialsecurity.gov/policy/docs/ssb/v65n1/v65n1p17.html for more information on replacement rates.
7 For 2037, the benefit reduction would be 17 percent. However, this includes some months before trust fund exhaustion when benefits would be paid in full.
8 See http://www.census.gov/prod/2009pubs/p60-236.pdf, Table 4.