Distributional Effects of Price Indexing Social Security Benefits
Policy Brief No. 2010-03 (released November 2010)
This policy brief compares five options (four progressive price indexing and one full price indexing option) set forth by the Social Security Advisory Board to index initial benefits to price growth. It examines the distribution of benefits of Social Security beneficiaries aged 62 or older in 2030, 2050, and 2070 using Modeling Income in the Near Term (MINT) model projections. The brief finds that the full price indexing option Shield 0% would more than achieve long-term solvency by reducing benefits by about 35 percent in 2070 and would increase the aged poverty rate compared with scheduled levels. The four progressive price indexing options (Shields 30%, 40%, 50%, 60%) would produce smaller benefit reductions by exempting varying proportions of lower earners from price indexing. Those options would not increase poverty above scheduled levels, but would reduce benefits for some low earners because their auxiliary benefits come from the reduced benefits of a higher-earning spouse. The progressive price indexing options would make Social Security more progressive compared with scheduled and payable benefits, both when looking at household benefit reductions by household income in a given year and when examining the distribution of lifetime taxes and benefits.
Mark Sarney is with SSA's Office of Retirement Policy. Questions about the analysis should be directed to the author at (202) 358-6295.
The findings and conclusions presented in this brief are those of the author and do not necessarily represent the views of the Social Security Administration.
Summary
| AIME | average indexed monthly earnings |
| COLA | cost-of-living adjustment |
| MINT | Modeling Income in the Near Term |
| OCACT | Office of the Chief Actuary |
| SSA | Social Security Administration |
This policy brief analyzes the distributional effects of slowing the growth of initial Social Security benefits by using price growth instead of wage growth for future retirees. Under current law, initial benefits paid to new beneficiaries increase with wage growth from year to year. The brief compares five options set forth by the Social Security Advisory Board1 to index initial benefits to price growth, as described in Table 1.
| Option | Type of indexing | Indexing applied to newly eligible beneficiaries | Begins | Ends |
|---|---|---|---|---|
| Shield 0% | Price growth | Regardless of career earnings | 2016 | Never |
| Shield 30% | Part wage, part price | Above the 30th percentile of career earnings | 2016 | Never |
| Shield 40% | Part wage, part price | Above the 40th percentile of career earnings | 2016 | Never |
| Shield 50% | Part wage, part price | Above the 50th percentile of career earnings | 2016 | Never |
| Shield 60% | Part wage, part price | Above the 60th percentile of career earnings | 2016 | Never |
| SOURCE: Author's updates of the Social Security Advisory Board options. | ||||
The analysis examines the distribution of benefits of Social Security beneficiaries aged 62 or older in 2030, 2050, and 2070 and uses projections from the Social Security Administration's (SSA's) Modeling Income in the Near Term (MINT) model.2 The benefits under each option are compared with the benefits scheduled under current law (scheduled benefits) and with the actual benefits that could be paid without any changes to current law (payable benefits).3 Solvency estimates and the option specifications come from SSA's Office of the Chief Actuary (OCACT).
Major Findings
- The Shield 0% option would more than achieve long-term solvency by reducing benefits by about 35 percent compared with scheduled levels in 2070 (compared with a 23 percent reduction from scheduled levels under payable benefits). The four other options would produce smaller benefit reductions and therefore have less solvency improvement because they exempt varying proportions of lower earners from price indexing.
- The Shield 0% option would increase the aged poverty rate to 3.1 percent in 2070 compared with 0.9 percent under scheduled benefits and 2.2 percent under payable benefits, which corresponds to an increase in the number of retirees in poverty by almost 2 million. The poverty rate under the four progressive price indexing options (Shields 30%, 40%, 50%, 60%) would be unchanged from scheduled benefit levels.
- Although portrayed as holding low-wage earners harmless, progressive price indexing options would reduce benefits for some low earners because their auxiliary benefits come from the reduced benefits of a higher-earning spouse. Over 80 percent of these beneficiaries would be women.
- The progressive price indexing options would make Social Security more progressive compared with scheduled and payable benefits, both when looking at household benefit reductions by household income in a given year and when examining the distribution of lifetime taxes and benefits.
Initial Benefits are Indexed to Wage Growth under Current Law
Under current law, initial Social Security benefits grow at approximately the rate of increase in the national average wage.4 Typically, each successive generation of retired workers receives higher average benefits than preceding generations because their earnings are higher and the bend points in the benefit formula are wage-indexed. As long as the replacement rate—initial benefits as a percentage of career-average earnings—remains constant for each successive generation of workers, the purchasing power5 of benefits increases from one generation to the next. In addition to the wage indexing of the initial benefit, subsequent years of benefits are increased by a cost-of-living adjustment (COLA), which is determined by changes in the Consumer Price Index for Urban Wage Earners and Clerical Workers (CPI-W) and designed to maintain the initial benefit's purchasing power for a retiree over his or her lifetime.6
The current Social Security benefit formula7 is also progressive within the same generation in that the replacement rate is higher for low-wage workers than it is for high-wage workers. Wage indexing of the formula's bend points has allowed the higher replacement rate for lower-wage earners to continue across successive generations. This higher replacement rate, supported by wage indexing in the benefit formula, has helped reduce the number of retirees in poverty because the price-indexed poverty thresholds grow more slowly than wages.
Price Indexing Would Freeze Purchasing Power and Reduce Replacement Rates
One way to slow the growth of future Social Security expenditures would be to index initial benefits to price, rather than wage, growth. The Social Security Board of Trustees projects that, on average, wages would grow faster than prices, which would mean price-indexed initial benefits would grow more slowly than wage-indexed initial benefits. Furthermore, for each successive generation of workers, the purchasing power of initial benefits would remain constant and replacement rates would decrease. Price indexing would freeze the purchasing power of initial benefits at 2016 levels for all future beneficiaries rather than increase the purchasing power for successive waves of younger beneficiaries, as would happen under scheduled benefits. This would lower the replacement rate of preretirement wages for future retirees. The benefit formula would not reflect future increases in earnings, but would maintain higher replacement rates for lower-wage workers.
The Shield 0% option would completely replace wage indexing so that all initial benefits would grow at the rate of prices rather than at the rate of wages. All workers first eligible for benefits in 2016 or later would be subject to price indexing of their initial benefits, which would still grow with prices because of the COLA. Disabled workers would be affected in their first year of eligibility, as would retired workers.
Progressive Price Indexing Flattens Future Benefits by Targeting Higher Earners
Under the four progressive price indexing options, Social Security would continue to pay fully wage-indexed initial benefits to low-wage workers. Initial benefits for high-wage workers would be price-indexed, however. Benefits for average-wage workers would be partly wage-indexed and partly price-indexed. Relative to scheduled benefits, purchasing power would be frozen at 2016 levels for high-wage earners, and their replacement rates would decrease; on the other hand, the purchasing power for low-wage earners would continue to increase, and their replacement rates would remain constant.
As shown in Chart 1, progressive price indexing would add a new dollar bend point and replacement factor to the benefit formula, splitting into two the segment of career earnings subject to the 32 percent replacement factor (in 2010, the $3,825 above $761). Above this new bend point, wage indexing would stop and the mix of wage and price indexing would begin, with more price indexing applied to those workers with higher career earnings.8 This new bend point would be set at the AIME of workers at a particular percentile of newly eligible workers in 2016, ranging from the 30th to the 60th percentile in the Shield 30%, 40%, 50%, and 60% options, respectively.
An additional bend point would split the 32 percent segment in the benefit formula (using 2010 bend points to illustrate, in dollars)
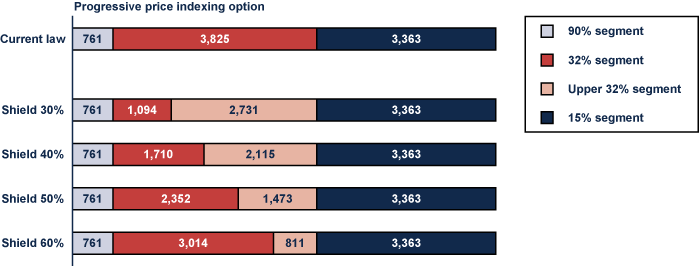
| Option | 90% segment | 32% segment | Upper 32% segment | 15% segment |
|---|---|---|---|---|
| Current Law | 761 | 3,825 | 3,363 | |
| Shield 30% | 761 | 1,094 | 2,731 | 3,363 |
| Shield 40% | 761 | 1,710 | 2,115 | 3,363 |
| Shield 50% | 761 | 2,352 | 1,473 | 3,363 |
| Shield 60% | 761 | 3,014 | 811 | 3,363 |
The four progressive price indexing options would reduce the upper 32 percent and 15 percent factors to produce the mix of wage and price indexing. The more workers a particular option shields, the steeper the reductions need to be to price index the benefit of a worker who earned at the taxable maximum each year. The long-range effect of these reductions would be to eliminate the upper two replacement factors of the benefit formula (see Table 2).
| Upper factors | Shield 0% | Shield 30% | Shield 40% | Shield 50% | Shield 60% |
|---|---|---|---|---|---|
| 2015 | 32, 15 | 32, 15 | 32, 15 | 32, 15 | 32, 15 |
| 2030 | 27, 13 | 24, 11 | 23, 11 | 21, 10 | 18, 9 |
| 2050 | 22, 10 | 15, 7 | 12, 6 | 9, 4 | 2, 1 |
| 2070 | 18, 8 | 8, 4 | 4, 2 | 0, 0 | 0, 0 |
| Year factors are eliminated | Never | After 2085 | 2081 | 2067 | 2054 |
| SOURCE: Social Security Administration's Office of the Chief Actuary. | |||||
Under the four progressive price indexing options, eventually the upper half of the formula would disappear and Social Security would pay most workers in the same generation roughly the same monthly benefit amount despite having different lifetime wages (Table 2). Under the Shield 50% option in 2070, for example, workers with lifetime earnings above the 50th percentile would receive the same initial benefit as workers at the 50th percentile despite having higher lifetime earnings and paying higher lifetime payroll taxes.
Cumulative Reductions Improve System Solvency
The degree to which each option would move the system toward 75-year actuarial balance depends on how many workers receive price indexing (Table 3). Shield 0% would more than eliminate Social Security's entire actuarial deficit, while the other options would reduce, but not eliminate, that deficit.9
| Effect | Shield 0% | Shield 30% | Shield 40% | Shield 50% | Shield 60% | Current law |
|---|---|---|---|---|---|---|
| Actuarial balance as a percent of taxable payroll | 0.27 | -0.69 | -0.90 | -1.13 | -1.39 | -2.00 |
| Annual balance in 75th year as a percent of taxable payroll | 2.82 | -0.37 | -1.02 | -1.83 | -2.77 | -4.34 |
| Percent of long-range actuarial deficit fixed | 114.00 | 65.50 | 55.00 | 43.50 | 31.00 | 0.00 |
| SOURCE: Social Security Administration's Office of the Chief Actuary, based on the intermediate assumptions of the 2009 Trustees Report. | ||||||
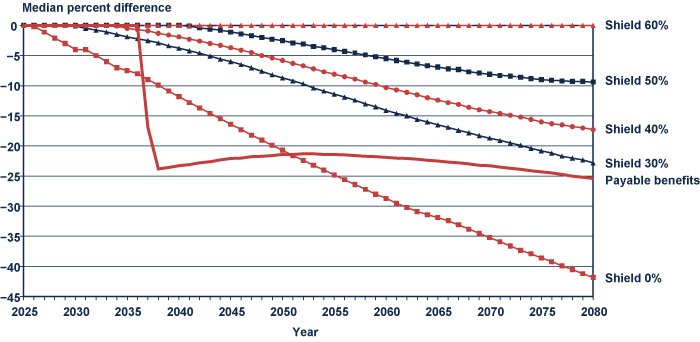
Benefit reductions under price indexing would grow over time because the gap between a price index and a wage index would grow over time. Median benefit reductions for beneficiaries aged 62 or older would increase from 4 percent in 2030 to 35 percent in 2070 under Shield 0% and range from 9 percent to 18 percent in 2070 under three of the four progressive price indexing options (Chart 2). The benefit reductions under Shield 0% would be greater than the 23 percent benefit reduction from scheduled benefits that would occur under payable benefits in 2070, which explains how Shield 0% reduces Social Security's program costs more than is needed to achieve system solvency.
Median individual benefit reductions increase over time, except for Shield 60% (relative to scheduled benefits)
| Year | Shield 0% | Shield 30% | Shield 40% | Shield 50% | Shield 60% | Payable benefits |
|---|---|---|---|---|---|---|
| 2025 | 0 | 0 | 0 | 0 | 0 | 0 |
| 2026 | -0.2 | 0 | 0 | 0 | 0 | 0 |
| 2027 | -1.1 | 0 | 0 | 0 | 0 | 0 |
| 2028 | -2.1 | 0 | 0 | 0 | 0 | 0 |
| 2029 | -3.0 | 0 | 0 | 0 | 0 | 0 |
| 2030 | -4.0 | -0.1 | 0 | 0 | 0 | 0 |
| 2031 | -4.0 | -0.5 | 0 | 0 | 0 | 0 |
| 2032 | -5.0 | -0.8 | 0 | 0 | 0 | 0 |
| 2033 | -6.0 | -1.1 | 0 | 0 | 0 | 0 |
| 2034 | -7.0 | -1.5 | -0.1 | 0 | 0 | 0 |
| 2035 | -7.5 | -1.9 | -0.5 | 0 | 0 | 0 |
| 2036 | -8.0 | -2.2 | -0.7 | 0 | 0 | 0 |
| 2037 | -9.0 | -2.5 | -0.9 | 0 | 0 | -16.9 |
| 2038 | -9.9 | -2.9 | -1.3 | 0 | 0 | -23.8 |
| 2039 | -10.9 | -3.4 | -1.6 | 0 | 0 | -23.6 |
| 2040 | -11.8 | -3.8 | -1.9 | 0 | 0 | -23.3 |
| 2041 | -12.8 | -4.2 | -2.3 | -0.1 | 0 | -23.1 |
| 2042 | -13.7 | -4.6 | -2.6 | -0.4 | 0 | -22.8 |
| 2043 | -14.6 | -5.1 | -3.0 | -0.6 | 0 | -22.6 |
| 2044 | -15.5 | -5.6 | -3.3 | -0.8 | 0 | -22.3 |
| 2045 | -16.4 | -6.0 | -3.7 | -1.1 | 0 | -22.1 |
| 2046 | -17.3 | -6.5 | -4.1 | -1.4 | 0 | -22.0 |
| 2047 | -18.2 | -7.0 | -4.5 | -1.7 | 0 | -21.8 |
| 2048 | -19.0 | -7.6 | -5.0 | -2.0 | 0 | -21.7 |
| 2049 | -19.9 | -8.2 | -5.4 | -2.3 | 0 | -21.6 |
| 2050 | -20.7 | -8.7 | -5.8 | -2.5 | 0 | -21.4 |
| 2051 | -21.6 | -9.2 | -6.3 | -2.9 | 0 | -21.4 |
| 2052 | -22.4 | -9.7 | -6.7 | -3.1 | 0 | -21.3 |
| 2053 | -23.2 | -10.4 | -7.2 | -3.5 | 0 | -21.3 |
| 2054 | -24.0 | -10.9 | -7.7 | -3.7 | 0 | -21.4 |
| 2055 | -24.8 | -11.4 | -8.1 | -4.0 | 0 | -21.4 |
| 2056 | -25.6 | -11.9 | -8.5 | -4.3 | 0 | -21.5 |
| 2057 | -26.4 | -12.4 | -8.9 | -4.6 | 0 | -21.6 |
| 2058 | -27.2 | -13.0 | -9.4 | -4.9 | 0 | -21.7 |
| 2059 | -28.0 | -13.5 | -9.8 | -5.2 | 0 | -21.8 |
| 2060 | -28.7 | -14.1 | -10.3 | -5.5 | 0 | -21.9 |
| 2061 | -29.5 | -14.6 | -10.7 | -5.8 | 0 | -22.0 |
| 2062 | -30.2 | -15.0 | -11.1 | -6.1 | 0 | -22.1 |
| 2063 | -30.9 | -15.6 | -11.5 | -6.4 | 0 | -22.2 |
| 2064 | -31.4 | -16.0 | -12.0 | -6.7 | 0 | -22.4 |
| 2065 | -31.9 | -16.5 | -12.4 | -6.9 | 0 | -22.5 |
| 2066 | -32.4 | -16.9 | -12.8 | -7.2 | 0 | -22.7 |
| 2067 | -33.1 | -17.4 | -13.1 | -7.3 | 0 | -22.8 |
| 2068 | -33.8 | -17.8 | -13.6 | -7.7 | 0 | -23.0 |
| 2069 | -34.5 | -18.3 | -14.0 | -7.9 | 0 | -23.2 |
| 2070 | -35.2 | -18.7 | -14.3 | -8.1 | 0 | -23.3 |
| 2071 | -35.9 | -19.1 | -14.6 | -8.3 | 0 | -23.5 |
| 2072 | -36.6 | -19.5 | -14.9 | -8.4 | 0 | -23.7 |
| 2073 | -37.3 | -19.9 | -15.2 | -8.6 | 0 | -23.9 |
| 2074 | -37.9 | -20.4 | -15.6 | -8.8 | 0 | -24.1 |
| 2075 | -38.6 | -20.8 | -16.0 | -9.0 | 0 | -24.3 |
| 2076 | -39.2 | -21.2 | -16.3 | -9.1 | 0 | -24.5 |
| 2077 | -39.9 | -21.7 | -16.5 | -9.2 | 0 | -24.7 |
| 2078 | -40.5 | -22.0 | -16.8 | -9.3 | 0 | -25.0 |
| 2079 | -41.2 | -22.3 | -17.0 | -9.3 | 0 | -25.2 |
| 2080 | -41.8 | -22.8 | -17.3 | -9.4 | 0 | -25.4 |
Progressive Price Indexing Prevents Almost Any Increase in Poverty
The number of beneficiaries in poverty would be virtually unchanged under any of the progressive price indexing options compared with scheduled benefits (Chart 3). However, under Shield 0%, the 2070 poverty rate would increase from 0.9 percent under scheduled benefits to 3.1 percent, increasing the number of poor beneficiaries by almost 2 million.10 Thus, freezing purchasing power at the 2016 level under Shield 0% would reduce benefits relative to scheduled benefits in later years and would cause more lower-income beneficiaries to fall below the poverty threshold compared with scheduled benefits.
The number of additional aged beneficiaries in poverty would increase under Shield 0%, but would be virtually unchanged under progressive price indexing options, compared with scheduled benefits
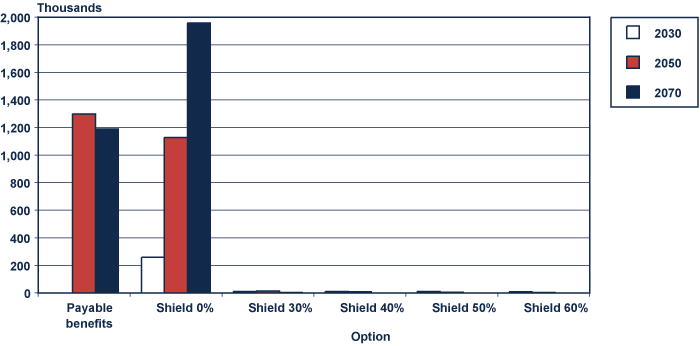
| Option | 2030 | 2050 | 2070 |
|---|---|---|---|
| Payable benefits | 1,297.45 | 1,189.16 | |
| Shield 0% | 257.81 | 1,127.51 | 1,955.15 |
| Shield 30% | 9.35 | 13.12 | 0.84 |
| Shield 40% | 9.35 | 7.12 | |
| Shield 50% | 8.35 | 5.12 | |
| Shield 60% | 5.70 | 1.12 | |
By contrast, the four progressive price indexing options would keep low-income beneficiaries above the poverty line under scheduled benefits from falling below that line. The lack of noticeable poverty increases suggests that progressive price indexing would shield low earners from benefit reductions. However, low earners could face reductions without falling into poverty. The next section explores the extent to which the shielding protects lower-wage workers.
Progressive Price Indexing Shields Fewer Lower Earners than Expected
A variety of press and think tank reports about progressive price indexing, specifically Shield 30%, state that this option would maintain scheduled benefit levels for low-wage earners.11 However, this does not appear to be accurate, as some low lifetime earners would experience reductions to their total individual Social Security benefits. Chart 4 indicates that in 2070, each option would shield a smaller proportion of retirees from benefit reductions than policymakers may expect based on how these options have been described.12 For example, the Shield 30% option actually would shield only 17 percent of beneficiaries.
A smaller percentage of beneficiaries would be shielded than expected under progressive price indexing options, 2070 (in percent)
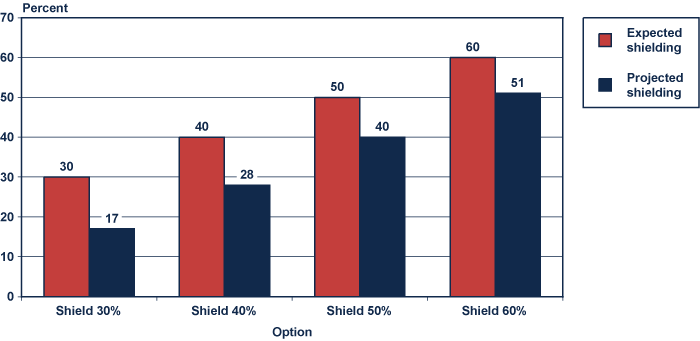
| Option | Expected | Projected |
|---|---|---|
| Shield 30% | 30 | 17 |
| Shield 40% | 40 | 28 |
| Shield 50% | 50 | 40 |
| Shield 60% | 60 | 51 |
Furthermore, the shielding appears to not hold harmless all of the lowest 20 percent of lifetime earners, who have been portrayed as fully protected under all four progressive price indexing options.13 Chart 5 shows that from 4 to 20 percent of the lowest quintile would experience benefit reductions, depending on the option. Even the Shield 50% and Shield 60% options, which are designed to provide full wage indexing for workers with much higher wages, would not hold all of these lower-wage workers harmless. The next section examines how deep these reductions would be and how they would occur.
Projected shielding of lowest quintile earners would fall below expectations
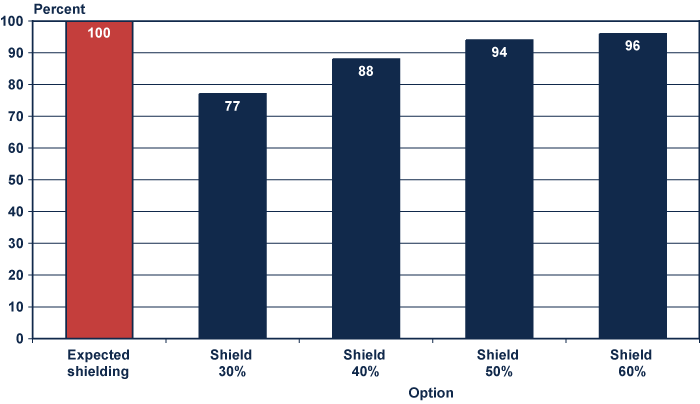
| Option | Percent |
|---|---|
| Expected shielding | 100 |
| Shield 30% | 77 |
| Shield 40% | 88 |
| Shield 50% | 94 |
| Shield 60% | 96 |
Auxiliary Benefits are Behind Reductions for Affected Low Earners
The benefit reductions in 2070 under Shield 30% for those affected in the lowest 20 percent of lifetime earners and how the option would reduce the different components of their benefit are shown in Chart 6.14 The reductions to the total Social Security benefit would average about 8 percent compared with scheduled benefits.
Benefit reductions under Shield 30% for those affected in the lowest 20 percent of lifetime earners, 2070 (in percent)
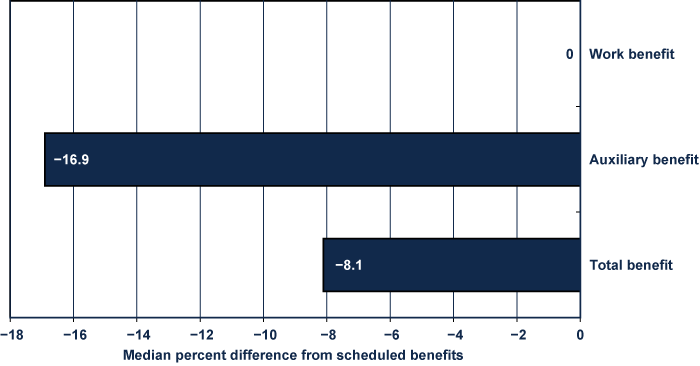
Shield 30% would hold harmless low-earners' worker benefits, as expected (Chart 6). However, Shield 30% would reduce their auxiliary benefits (that is, spousal or survivor benefits received from a higher-earner's record) by an average of about 17 percent, which is responsible for the reduction in the total benefit received. The auxiliary benefit reductions would occur because Shield 30% would reduce the benefit of a higher-earning spouse, which would lower the low-earning spouse's auxiliary benefit. The large effect of auxiliary benefit reductions on the total benefit under Shield 30% would happen because 75 percent of affected beneficiaries with the lowest career earnings would receive auxiliary benefits. Over 80 percent of affected beneficiaries with reduced auxiliary benefits would be women. Similar results would occur under the other three progressive price indexing options.
Household Benefit Reductions under Progressive Price Indexing Would be Progressive
Because existing auxiliary benefit rules allow benefit changes to the higher-earning spouse to affect the lower-earning spouse, it is also worthwhile to look at benefit reductions at the household level. It is especially important to examine how all of the options may affect the progressivity of the entire Social Security program from a lifetime perspective because individual low earners may be married to high earners and be in a high-income household.
Chart 7 indicates that the progressive price indexing options would result in progressive benefit reductions: The top fifth of households by income would experience a 20 percent reduction, while the lowest fifth of households would have no reduction (except for a 5 percent reduction under Shield 30%). By comparison, the Shield 0% option would produce roughly the same household reductions across the household income distribution, and these reductions would be greater than those under payable benefits.
Median household benefit reductions compared with scheduled benefits, by income quintile, 2070
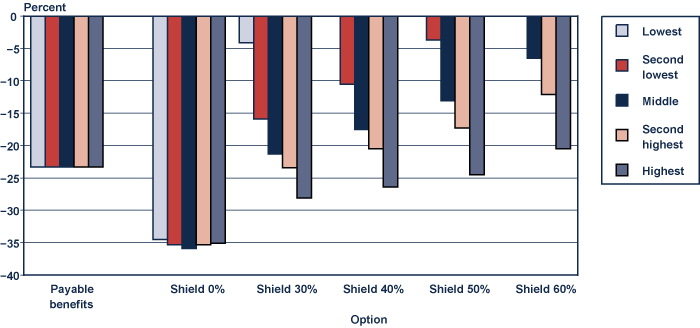
| Option | Lowest | Second lowest | Middle | Second highest | Highest |
|---|---|---|---|---|---|
| Payable benefits | -23.3 | -23.3 | -23.3 | -23.3 | -23.3 |
| Shield 0% | -34.5 | -35.3 | -35.9 | -35.3 | -35.1 |
| Shield 30% | -4.1 | -15.9 | -21.3 | -23.4 | -28.1 |
| Shield 40% | 0 | -10.5 | -17.5 | -20.5 | -26.4 |
| Shield 50% | 0 | -3.7 | -13.1 | -17.3 | -24.5 |
| Shield 60% | 0 | 0 | -6.5 | -12.1 | -20.5 |
Another method to examine changes to Social Security's progressivity is to look at how the distribution of total lifetime benefits compares with the distribution of total lifetime taxes via a progressivity index. The progressivity index compares a cohort's distribution of the total lifetime present value of benefits with the distribution of total lifetime present value of taxes. For example, if the bottom half of taxpayers in a birth cohort receive more than 50 percent of total benefits, the system is progressive for that cohort. Furthermore, if the share of total benefits received by those who pay 50 percent of total taxes increases from 55 percent to 60 percent, the system has become more progressive.
The index used here measures progressivity on a scale of -1 to 1, with -1 being the most regressive and 1 being the most progressive.15 A value of zero would indicate that lifetime benefits are exactly proportional to lifetime contributions. A flat dollar benefit with the current payroll tax structure would have an index value around 0.30. Scheduled Social Security benefits score around 0.15 to 0.17 for the birth cohorts affected by the price indexing options, and payable benefits would be slightly more progressive.16
All of the price indexing options would increase progressivity above scheduled and payable benefits (Chart 8). Shield 0% would score about 0.17 for most birth cohorts because, much like payable benefits, differences in longevity between high and low earners can affect the size of the reduction on lifetime benefits. The progressive price indexing options would boost progressivity above 0.20, ranging from 0.22 to 0.26. The benefits under Shield 30% and Shield 40% in particular would be closer to levels expected from a flat benefit because these two options eliminate the upper two factors of the benefit formula and would shrink the difference between higher and lower benefit levels substantially.
Lifetime progressivity increases under price indexing options
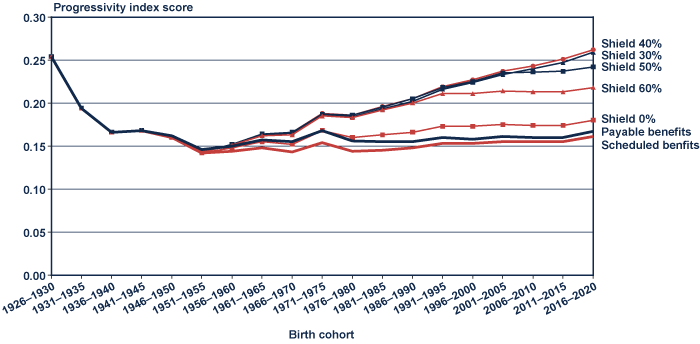
| Birth cohort | Shield 0% | Shield 30% | Shield 40% | Shield 50% | Shield 60% | Scheduled benfits | Payable benefits |
|---|---|---|---|---|---|---|---|
| 1926–1930 | 0.254 | 0.254 | 0.254 | 0.254 | 0.254 | 0.254 | 0.254 |
| 1931–1935 | 0.194 | 0.194 | 0.194 | 0.194 | 0.194 | 0.194 | 0.194 |
| 1936–1940 | 0.166 | 0.166 | 0.166 | 0.166 | 0.166 | 0.166 | 0.166 |
| 1941–1945 | 0.168 | 0.168 | 0.168 | 0.168 | 0.168 | 0.168 | 0.168 |
| 1946–1950 | 0.160 | 0.160 | 0.160 | 0.160 | 0.160 | 0.160 | 0.162 |
| 1951–1955 | 0.142 | 0.143 | 0.143 | 0.143 | 0.143 | 0.142 | 0.146 |
| 1956–1960 | 0.148 | 0.152 | 0.152 | 0.152 | 0.151 | 0.144 | 0.150 |
| 1961–1965 | 0.155 | 0.163 | 0.164 | 0.164 | 0.162 | 0.148 | 0.157 |
| 1966–1970 | 0.152 | 0.165 | 0.166 | 0.166 | 0.163 | 0.143 | 0.155 |
| 1971–1975 | 0.168 | 0.187 | 0.188 | 0.187 | 0.185 | 0.154 | 0.168 |
| 1976–1980 | 0.160 | 0.184 | 0.186 | 0.186 | 0.183 | 0.144 | 0.156 |
| 1981–1985 | 0.163 | 0.193 | 0.196 | 0.195 | 0.192 | 0.145 | 0.155 |
| 1986–1990 | 0.166 | 0.202 | 0.205 | 0.205 | 0.200 | 0.148 | 0.155 |
| 1991–1995 | 0.173 | 0.216 | 0.219 | 0.218 | 0.211 | 0.153 | 0.160 |
| 1996–2000 | 0.173 | 0.224 | 0.227 | 0.225 | 0.211 | 0.153 | 0.158 |
| 2001–2005 | 0.175 | 0.233 | 0.237 | 0.235 | 0.214 | 0.155 | 0.161 |
| 2006–2010 | 0.174 | 0.240 | 0.243 | 0.236 | 0.213 | 0.155 | 0.160 |
| 2011–2015 | 0.174 | 0.247 | 0.251 | 0.237 | 0.213 | 0.155 | 0.160 |
| 2016–2020 | 0.180 | 0.259 | 0.262 | 0.242 | 0.218 | 0.161 | 0.167 |
Notes
1 The Social Security Advisory Board's report, Social Security: Why Action Should be Taken Soon, is available at http://www.ssab.gov/documents/WhyActionShouldbeTakenSoon.pdf.
2 The simulations of the options use projections from the MINT 5 release of the MINT model that employs the intermediate economic assumptions of the 2008 Trustees Report. The comparisons here are static with no behavioral response to the policy options' effect on benefits or income. The MINT model is based on Social Security administrative data matched to the Survey of Income and Program Participation (SIPP). Work, marriage, retirement, and death are projected for real and imputed individuals based on real earnings, marital histories, and education levels.
3 The actuaries estimate payable benefit amounts based on the intermediate assumptions used in the 2009 Trustees Report, which estimates that the trust funds will be exhausted in 2037. Benefits will need to be reduced beginning in that year. Comparing both baselines is not meant to imply that the option has the same effect on solvency as the baseline, but is done to avoid appearing to endorse one baseline over another as the appropriate one for these types of analyses.
4 For information on wage indexing, see http://www.socialsecurity.gov/OACT/ProgData/retirebenefit1.html.
5 Purchasing power refers to how many goods and services a given amount of money can purchase at a point in time. Maintaining a certain standard of living requires having the ability to purchase the same basket of goods and services despite price inflation or deflation.
6 For information about the effects of options to reduce the COLA, see "Distributional Effects of Reducing the Cost-Of-Living Adjustment," http://www.socialsecurity.gov/policy/docs/policybriefs/pb2008-03.html. The specific CPI used is the CPI-W.
7 The benefit formula for those newly eligible in 2010 replaces 90 percent of the first $761 of average indexed monthly earnings (AIME), 32 percent of the next $3,825 of earnings, and 15 percent of the next $3,363 of earnings.
8 For example, Shield 30% would create a new bend-point amount in the formula, at 28.6 percent between the existing two bend-point amounts, splitting the 32 percent factor into two separate 32 percent replacement factors. The resulting formula structure would have four replacement factors: 90 percent, 32 percent, upper 32 percent, and 15 percent. The upper 32 percent and 15 percent factors would drop to achieve price indexing, while the lower 90 percent and 32 percent factors would remain unchanged. The exact amount the upper factors would be lowered is based on information provided by OCACT.
9 Under the intermediate assumptions of the 2009 Trustees Report, the 75-year actuarial balance is -2.00 percent of taxable payroll.
10 The MINT model projects that the elderly poverty rate will decline under both scheduled and payable benefits in future decades because the federal poverty threshold is price-indexed, while the initial Social Security benefits and other sources of retirement income grow with wages across generations. Note also that MINT projections are based on the Survey of Income and Program Participation, which typically provides lower poverty rates than the Current Population Survey.
11 For more information, see the following: "What is Progressive Price Indexing?" by Alicia H. Munnell and Mauricio Soto, Just the Facts on Retirement Issues, No. 17. Center for Retirement Research (April 2005), http://crr.bc.edu/images/stories/Just%20the%20Facts/jtf_17.pdf; "Social Security and Progressive Indexing," by Andrew J. Rettenmaier and Thomas R. Saving, National Center for Policy Analysis (July 11, 2005), http://www.ncpa.org/pub/ba520; "An Analysis of Using Progressive Price Indexing To Set Social Security Benefits," by Jason Furman, Center for Budget and Policy Priorities (May 2005), http://www.cbpp.org/cms/?fa=view&id=48; "Progressive Indexing: Effect on Benefits," by Jeanne Sahadi, CNNMoney.com (April 29, 2005), http://money.cnn.com/2005/04/29/retirement/progressive_numbers/index.htm; and "Pozen's Social Security Fix Sparks Buzz," by Charles Stein, Boston Globe (March 17, 2005), http://www.boston.com/business/globe/articles/2005/03/17/pozens_social_security_fix_sparks_buzz/.
12 The rest of the analysis focuses on 2070 because by that year the entire aged population would be subject to each option, and the degree of shielding of beneficiaries aged 62 or older can be examined.
13 In this brief, earners are defined as low if they have lifetime earnings (shared between married couples) that are in the lowest 20 percent of all people born in the same year. The lifetime wage quintiles control for intergenerational differences, such as wage growth, and avoid problems that AIME quintiles have, such as a decline in real value at older ages and the effect of different treatment of zero years.
14 A similar pattern exists for the Shield 40%, 50%, and 60% options.
15 The index is calculated using a modified Suits index formula, which is much like a Gini coefficient, except that the distribution of benefits replaces the income distribution, and the distribution of taxes replaces the population distribution. For more information on the progressivity index, see "Toward a Progressivity Index," by Andrew G. Biggs, Mark A. Sarney, and Christopher R. Tamborini, Issue Paper No. 2009-01, SSA, (July 2009), http://www.socialsecurity.gov/policy/docs/issuepapers/ip2009-01.html.
16 Payable benefits would score higher than scheduled benefits because the payable reductions grow over time, lowering lifetime benefits more for those with longer life spans, who are generally higher-wage workers.