my Social Security Participation and Willingness to Register Among U.S. Adults
Research and Statistics Note No. 2026-01 (released August 2026)
David Rogofsky, Richard Chard, and Matt Messel are researchers with the Social Security Administration.
Contents of this publication are not copyrighted; any items may be reprinted, but citation is requested. The findings and conclusions presented in this note are those of the authors and do not necessarily represent the views of the Social Security Administration.
Summary
This note uses data from the Understanding America Study (UAS) to examine people's awareness of, willingness to register for, and perceived obstacles to using my Social Security, the Social Security Administration's online account platform. Among U.S. adults, 43.6 percent report being aware of my Social Security, and 30 percent have registered for an account. Additionally, 14.8 percent were previously unaware of my Social Security but indicate a willingness to register after receiving basic information. However, 55 percent of adults remain hesitant to register. The most commonly cited reasons for nonregistration are that my Social Security does not meet an immediate need or “no particular reason.” Frequently mentioned barriers to use include security concerns, insufficient information, and perceived difficulty with the registration process. Differences by age, education, and race or ethnicity emerge, with older and more educated individuals most likely to have both heard of and registered for my Social Security. Varying levels of comfort with online transactions in general also relate to concerns about security and registration procedures. These findings suggest that targeted outreach, clear guidance, and highlighting potential long-term advantages of having an account may help increase my Social Security participation over time.
Introduction
In 2002, the E-Government Act established a federal framework to expand the reach and quality of government services online.1 The United States has consistently ranked among the top countries on the United Nations E-Government Survey's E-Participation Index, reflecting high levels of free access to government services (United Nations 2024). The Social Security Administration (SSA) has played a leading role in developing online federal services, beginning with its ssa.gov website in the 1990s and continuously expanding offerings to include features like the my Social Security platform in 2012. my Social Security is a central portal for a wide range of transactions, such as replacing a Social Security card, estimating future benefits, and applying for benefits, offering significant time and cost savings to both individuals and SSA. Yet, despite growth in internet access and online service options, not all eligible individuals register for my Social Security, and limited awareness remains a primary obstacle to broader adoption (Rabinovich and Perez-Arce 2023).
This study analyzes recent data from the University of Southern California's Understanding America Study (UAS) to address three questions: (1) Who is aware of my Social Security, and who has registered for an account? (2) Who is willing to register for an account? and (3) What are common reasons for registration hesitancy? By segmenting the U.S. adult population by current registration status, willingness to register, and reasons for hesitancy, we aim to inform targeted outreach and communication strategies to increase my Social Security usage.
Methods
Data
This study uses data from the fourth wave of the Social Security Communications Channels Preference Survey (UAS 459). The UAS is an internet-based panel of approximately 15,000 U.S. households recruited via address-based sampling. Panel members are provided tablet computers and internet access when needed and are compensated for survey participation. Surveys on Social Security program knowledge and information channels are administered on a rolling basis every 2 years, reaching new UAS panel members and individuals who did not participate in the prior 2-year window. Alattar, Messel, and Rogofsky (2018) provide detailed information on UAS methodology.
Sample
We restricted the sample to 12,809 adult respondents aged 18 or older who completed the fourth wave between June 2022 and July 2024. The weighted sample is nationally representative of U.S. adults, excluding military personnel and the institutionalized population, with survey weights aligned to the Current Population Survey's Annual Social and Economic Supplement benchmarks. Key demographic characteristics, including distributions by sex, age, race or ethnicity, education, and household income, are presented in Table 1.
| Characteristic | Number (unweighted) | Percent (weighted) |
|---|---|---|
| Total | 12,809 | 100.0 |
| Age group | ||
| 18–29 | 1,565 | 14.3 |
| 30–49 | 4,880 | 39.0 |
| 50–61 | 2,779 | 19.8 |
| 62–69 | 1,825 | 13.4 |
| 70 or older | 1,735 | 13.4 |
| Education level | ||
| Less than high school diploma | 633 | 4.9 |
| High school diploma | 2,033 | 15.9 |
| Some college | 4,371 | 34.1 |
| Bachelor's degree | 3,299 | 25.8 |
| Master's degree or higher | 2,471 | 19.3 |
| Race or ethnicity (alone or in combination) a | ||
| American Indian or Alaska Native | 680 | 4.0 |
| Asian | 1,212 | 7.3 |
| Black | 1,826 | 15.0 |
| Hispanic | 2,097 | 16.7 |
| Native Hawaiian or Pacific Islander | 219 | 1.4 |
| White | 9,781 | 77.8 |
| Sex | ||
| Women | 7,805 | 51.2 |
| Men | 5,001 | 48.8 |
| Household income ($) | ||
| Less than 25,000 | 2,485 | 22.5 |
| 25,000–49,999 | 2,472 | 20.5 |
| 50,000–74,999 | 2,209 | 17.8 |
| 75,000–149,999 | 3,625 | 26.3 |
| 150,000 or more | 1,990 | 12.8 |
| SOURCE: Authors' calculations using Understanding America Study (UAS) Survey 459 (June 2022–July 2024). | ||
| NOTE: Because some respondents did not answer all demographic questions, the sums of the characteristic groupings do not necessarily equal the sample size or 100 percent. | ||
| a. Because the racial and ethnic categories are not mutually exclusive, the sum of the weighted percentages exceeds 100 percent. | ||
Measures
To address the study objectives, we employed the following measures:
- my Social Security Awareness, Registration, and Willingness to Register: Respondents indicate whether they have heard of my Social Security. Individuals who are aware of my Social Security but have not registered are asked for the primary reason they have not registered (see measure 2). Individuals who are not aware of my Social Security are asked whether they would be willing to register. Those who indicate they are not currently willing to register are asked to provide their primary reason. Box 1 outlines the flow of these questions.
- Reasons for Hesitation: Those who are not willing to register provide a primary reason, which we categorize as (a) security concerns, (b) need more information, (c) difficulty registering, or (d) other reasons (such as “no particular reason,” “my Social Security is not very useful for now,” or an open-ended response). In the survey, this question is asked separately to individuals who are aware of my Social Security and those who are unaware (see Box 1). We combine the responses from the “aware” and “unaware” groups for a total percentage of the adult population who are hesitant to register for the various reasons asked in the survey.
- Comfort with Online Transactions: Respondents rate their comfort with (a) conducting Social Security transactions online, (b) seeking retirement planning information online, (c) seeking government services online, and (d) conducting banking transactions online. These measures provide context for understanding hesitancy to sign up for my Social Security, because discomfort or unfamiliarity with online transactions in general may contribute to registration reluctance.
(ch018) Have you previously heard about my Social Security?
- If yes: (ch020) Have you set up a my Social Security account?
- If yes → Registered group
- If no → Hesitant group: (ch021) Why not? Please check the main reason:
- “Security concerns”: Do not like to provide or receive personal information online
- “Need more information”: Do not know enough about it
- “Difficulty with registration”: Tried but was not able to complete registration for technical reasons
- “Not very useful, no particular reason, or other”:
- Not very useful or no need right now
- No particular reason
- Other (open-ended item)
- If no: (ch024) Would you be willing to set up a my Social Security account?
- If yes → Willing group
- If no → Hesitant group: (ch025) Why not? Please check the main reason:
- “Security concerns”: Do not like to provide or receive personal information online
- “Need more information”: Do not know enough about it
- “Difficulty with registration”: Too burdensome to set up
- “Not very useful, no particular reason, or other”:
- Not very useful or no need right now
- No particular reason
- I don't think I would be eligible for my Social Security account
- Other (open-ended item)
SOURCE: Understanding America Study (UAS) Survey 459.
Findings
Awareness and Registration
Overall, 43.6 percent of U.S. adults have heard of my Social Security, and 30.0 percent have registered for an account (Table 2). Consistent with broader patterns in digital literacy across demographic groups (Smith 2014; Zhao, Zhao, and Song 2022), age and education show the strongest associations with my Social Security awareness and registration.
| Subgroup | Already aware | Already registered | Unaware before survey but willing to register after introduction |
|---|---|---|---|
| All U.S. adults | 43.6 | 30.0 | 14.8 |
| Age group | |||
| 18–29 | 21.8 | 9.8 | 14.3 |
| 30–49 | 35.4 | 21.0 | 20.5 |
| 50–61 | 53.6 | 39.6 | 16.0 |
| 62–69 | 68.2 | 55.3 | 5.6 |
| 70 or older | 51.2 | 38.4 | 6.1 |
| Education level | |||
| Less than high school diploma | 37.3 | 18.0 | 10.1 |
| High school diploma | 40.7 | 25.7 | 10.1 |
| Some college | 45.7 | 32.4 | 13.2 |
| Bachelor's degree | 44.1 | 32.7 | 20.2 |
| Master's degree or higher | 48.2 | 37.2 | 22.0 |
| Race or ethnicity | |||
| American Indian or Alaska Native | 40.0 | 24.7 | 14.7 |
| Asian | 39.2 | 28.2 | 19.3 |
| Black | 45.6 | 28.0 | 10.9 |
| Hispanic | 36.5 | 21.6 | 16.8 |
| Native Hawaiian or Pacific Islander | 28.5 | 17.0 | 19.2 |
| White | 43.8 | 30.9 | 15.3 |
| Sex | |||
| Women | 41.8 | 27.5 | 14.8 |
| Men | 45.4 | 32.7 | 14.8 |
| Household income ($) | |||
| Less than 25,000 | 40.9 | 24.0 | 6.7 |
| 25,000–49,999 | 42.5 | 26.7 | 12.5 |
| 50,000–74,999 | 44.7 | 29.4 | 14.3 |
| 75,000–149,999 | 45.4 | 34.7 | 19.7 |
| 150,000 or more | 44.5 | 36.6 | 23.4 |
| Number (unweighted) | 5,658 | 4,124 | 2,203 |
| SOURCE: Authors' calculations using Understanding America Study (UAS) Survey 459 (June 2022–July 2024). | |||
| NOTE: Sample size = 12,809. Percentages are survey-weighted to represent the U.S. adult population. | |||
- Age. Awareness ranges from 21.8 percent among adults aged 18–29 to 68.2 percent among those aged 62–69, while registration ranges from 9.8 percent (ages 18–29) to 55.3 percent (ages 62–69). These findings align with research showing that older adults often have more reasons to engage with Social Security services and are therefore more likely to adopt online platforms (Smith 2014).
- Education. Registration varies substantially by educational attainment—37.2 percent among adults with a master's degree or higher versus 18.0 percent among those with less than a high school education—whereas awareness differences are somewhat narrower (48.2 percent versus 37.3 percent for these respective categories). Prior studies suggest that digital literacy skills associated with higher education may facilitate engagement with online systems (Zhao, Zhao, and Song 2022).
- Race and ethnicity. Awareness is highest among Black individuals (45.6 percent) and lowest among Native Hawaiian or Pacific Islander individuals (28.5 percent). Registration rates range from 17.0 percent among Native Hawaiian or Pacific Islander respondents to 30.9 percent among White respondents. Hispanic (21.6 percent) and American Indian or Alaska Native (24.7 percent) respondents also register at comparatively lower rates. For some American Indian or Alaska Native communities in tribal areas, an underdeveloped broadband infrastructure may limit access to online services (Government Accountability Office 2024).
- Sex. Men exhibit slightly higher levels of awareness (45.4 percent versus 41.8 percent) and registration (32.7 percent versus 27.5 percent) than women, though these differences are smaller than those observed by age or education.
- Household income. The pattern of registration differences between income brackets is less clear than the patterns observed for age or education. Registration rates range from 24.0 percent among individuals earning less than $25,000 to 36.6 percent among those earning $150,000 or more. One possible explanation is that many older adults, who are more likely to register for my Social Security, may have lower retirement incomes, which could contribute to the weaker association between income and enrollment.
Overall, these results indicate that individuals who are older and more educated tend to both learn about my Social Security and sign up at higher rates—mirroring national patterns regarding digital literacy and online access (Smith 2014; Zhao, Zhao, and Song 2022). Lower registration rates among some racial or ethnic groups may reflect differences in broadband availability among other factors (Government Accountability Office 2024).
Willingness to Register
Beyond the 30.0 percent of adults who have already registered, an additional 14.8 percent of the overall population report that they would be willing to sign up after learning about my Social Security in the context of the survey.2 Several subgroups exhibit relatively low awareness of the platform but willingness-to-register rates that exceed the 14.8-percent average for the total population.
- Individuals in their 30s and 40s. Only 35.4 percent of adults aged 30–49 have heard of my Social Security, compared with the overall awareness rate of 43.6 percent. However, 20.5 percent of adults in this age range indicate a willingness to sign up after receiving a brief introduction to the platform—above the overall average.
- Hispanic adults. Although only 36.5 percent of this subgroup report prior awareness of my Social Security—among the lower rates by race or ethnicity—16.8 percent indicated a willingness to register after learning about the platform, which is above the population average.
- Native Hawaiian or Pacific Islander adults. With the lowest overall awareness by race or ethnicity (28.5 percent), a notable portion of Native Hawaiian or Pacific Islander adults (19.2 percent) express willingness to sign up after they are introduced to the platform.
In addition, adults with at least a bachelor's degree or those with household incomes greater than $75,000 report willingness-to-register rates above the 14.8-percent population average after learning about the platform for the first time in the survey. These groups are also more likely to already be aware of and registered for the platform.
Registration Hesitancy
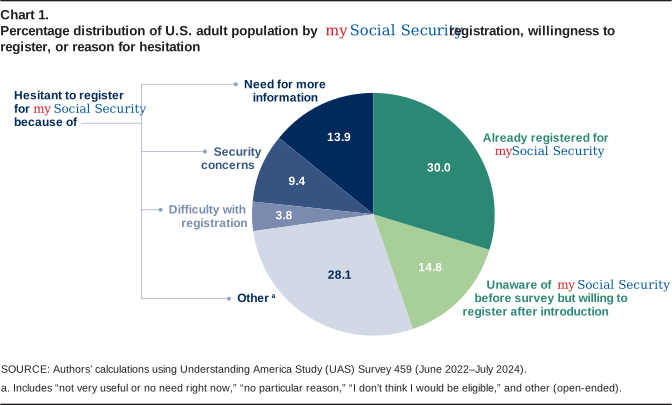
Whereas approximately 45 percent of UAS participants have either registered for a my Social Security account or expressed willingness to do so after a brief introduction in the survey, the remaining 55 percent express some reluctance to sign up for the platform. This group includes both adults who were aware of my Social Security before the survey and those who were not. Chart 1 shows the distribution of the U.S. adult population by my Social Security registration (green), willingness to register (light green), and the primary reasons for reluctance to register (varying shades of blue).
| Subgroup | Percent |
|---|---|
| Already registered for my Social Security | 30.0 |
| Unaware of my Social Security before survey but willing to register after introduction | 14.8 |
| Hesitant to register for my Social Security because of— | |
| Need for more information | 13.9 |
| Security concerns | 9.4 |
| Difficulty with registration | 3.8 |
| Other a | 28.1 |
| SOURCE: Authors' calculations using Understanding America Study (UAS) Survey 459 (June 2022–July 2024). | |
| a. Includes “not very useful or no need right now,” “no particular reason,” “I don't think I would be eligible,” and other (open-ended). | |
Although security concerns, a need for more information, and difficulty navigating the sign-up process each account for a share of this hesitancy, a considerable number of adults—28.1 percent of the total adult population—cite situational reasons or open-ended reasons, such as not finding the platform useful right now. Taken together, these responses suggest that people's underlying reservations vary widely, encompassing concrete worries about data protection, gaps in understanding, perceived sign-up barriers, or the perception that my Social Security simply does not address an immediate need.
Need for additional information. Lack of information is a barrier for many adults: 13.9 percent cite the need for more information as a primary obstacle to account registration (Table 3). This issue is especially evident among younger adults: 20.6 percent of those aged 18–29 report needing more clarity before they would feel ready to register. Similarly, adults who identify as Hispanic (18.3 percent) or Black (17.2 percent) report feeling uncertain. Adults who needed more information are generally comfortable with online platforms: 56.8 percent indicate they feel at ease conducting Social Security transactions online, and 74.7 percent express confidence in using online banking (Table 4). However, prior research shows that being digitally ready to use an online service does not always lead to e-government adoption, particularly when users feel uninformed about how a platform works (Zhao, Zhao, and Song 2022). While it cannot be assumed that targeted education or outreach will automatically increase sign-up rates, providing clear explanations of the features and benefits of my Social Security could encourage some adults to register.
| Subgroup | Total, all reasons | Need for more information | Security concerns | Difficulty with registration | Other a |
|---|---|---|---|---|---|
| All U.S. adults | 55.2 | 13.9 | 9.4 | 3.8 | 28.1 |
| Age group | |||||
| 18–29 | 75.9 | 20.6 | 6.8 | 6.2 | 42.2 |
| 30–49 | 58.5 | 14.8 | 6.7 | 4.5 | 32.5 |
| 50–61 | 44.4 | 12.4 | 9.9 | 2.5 | 19.6 |
| 62–69 | 39.1 | 9.1 | 12.9 | 2.1 | 15.1 |
| 70 or older | 55.5 | 11.5 | 15.5 | 3.1 | 25.4 |
| Education level | |||||
| Less than high school diploma | 71.9 | 14.2 | 15.2 | 5.4 | 37.0 |
| High school diploma | 64.3 | 17.0 | 13.2 | 4.1 | 30.0 |
| Some college | 54.3 | 13.8 | 9.5 | 3.7 | 27.3 |
| Bachelor's degree | 47.2 | 12.1 | 6.0 | 3.5 | 25.6 |
| Master's degree or higher | 40.8 | 10.6 | 2.9 | 3.2 | 24.1 |
| Race or ethnicity | |||||
| American Indian or Alaska Native | 60.8 | 15.8 | 12.2 | 6.6 | 26.2 |
| Asian | 52.5 | 13.6 | 7.2 | 5.7 | 26.0 |
| Black | 61.1 | 17.2 | 8.4 | 4.7 | 30.8 |
| Hispanic | 61.7 | 18.3 | 10.3 | 5.6 | 27.5 |
| Native Hawaiian or Pacific Islander | 63.8 | 10.7 | 8.2 | 13.1 | 31.8 |
| White | 53.9 | 13.2 | 9.6 | 3.4 | 27.7 |
| Sex | |||||
| Women | 57.8 | 14.8 | 9.9 | 4.4 | 28.7 |
| Men | 52.6 | 13.1 | 8.8 | 3.2 | 27.5 |
| Household income ($) | |||||
| Less than 25,000 | 69.3 | 16.6 | 15.0 | 5.2 | 32.5 |
| 25,000–49,999 | 60.5 | 15.3 | 11.4 | 4.2 | 29.7 |
| 50,000–74,999 | 56.3 | 15.1 | 8.7 | 3.3 | 29.1 |
| 75,000–149,999 | 45.7 | 11.6 | 5.8 | 3.2 | 25.1 |
| 150,000 or more | 40.1 | 10.4 | 4.3 | 2.9 | 22.4 |
| Number (unweighted) | 6,482 | 1,693 | 1,057 | 517 | 3,215 |
| SOURCE: Authors' calculations using Understanding America Study (UAS) Survey 459 (June 2022–July 2024). | |||||
| NOTE: Sample size = 12,809. Percentages are survey-weighted to represent the U.S. adult population. | |||||
| a. Includes "not very useful or no need right now," "no particular reason," "I don't think I would be eligible," and other (open-ended). | |||||
| Subgroup | Percentage comfortable a with— | Share of all U.S. adults | Number (unweighted) | |||
|---|---|---|---|---|---|---|
| Performing online transactions related to— | Going online to seek information about— | |||||
| Banking or finances | Social Security benefits | Government services | Retirement planning | |||
| All U.S. adults | 78.7 | 67.4 | 78.1 | 77.6 | 100.0 | 12,809 |
| Already registered for my Social Security | 86.3 | 85.4 | 86.1 | 85.6 | 30.0 | 4,124 |
| Unaware of my Social Security before survey but willing to register after introduction | 88.6 | 75.9 | 84.0 | 84.9 | 14.8 | 2,203 |
| Hesitant to register for my Social Security because of— | ||||||
| Need for more information | 74.7 | 56.8 | 72.1 | 70.4 | 13.9 | 1,693 |
| Security concerns | 51.4 | 34.1 | 57.3 | 55.4 | 9.4 | 1,057 |
| Difficulty with registration | 73.2 | 56.8 | 74.2 | 76.5 | 3.8 | 517 |
| Other b | 76.5 | 61.3 | 76.9 | 76.2 | 28.1 | 3,215 |
| SOURCE: Authors' calculations using Understanding America Study (UAS) Survey 459 (June 2022–July 2024). | ||||||
| NOTES: Sample size = 12,809. Percentages are survey-weighted to represent the U.S. adult population. | ||||||
| a. Combines the responses "strongly agree" and "somewhat agree" for questions about comfort for each activity type. | ||||||
| b. Includes "not very useful or no need right now," "no particular reason," "I don't think I would be eligible," and other (open-ended). | ||||||
Security concerns. About 9.4 percent of adults cite security concerns as the reason they have not registered for my Social Security. This share is notably higher among adults aged 70 or older (15.5 percent), those with lower incomes (15.0 percent), and those with less than a high school education (15.2 percent). Adults with security concerns also report the lowest levels of comfort in performing Social Security (34.1 percent) and banking (51.4 percent) transactions online. Their apprehension may reflect broader distrust or uncertainty around online services, consistent with prior findings that users who are less confident in digital contexts often cite security as a barrier to e-government participation (Adnan, Ghazali, and Othman 2022). Although it is uncertain whether emphasizing data-protection and privacy measures would necessarily boost enrollment, highlighting such information may address some concerns among this subgroup.
Difficulty registering. Perceived difficulty is the primary barrier for 3.8 percent of adults. Although this reason is less common overall, Native Hawaiian or Pacific Islander adults (13.1 percent) and younger adults (6.2 percent) are relatively more likely to cite a challenging registration process. Despite these perceived hurdles, many in this group are comfortable with online transactions (56.8 percent for Social Security transactions and 73.2 percent for banking), suggesting that some individuals may experience specific issues with my Social Security registration rather than distrusting digital services more broadly. Simplifying the account-setup process or providing clearer sign-up guidance could potentially help more people in this subset engage with the platform.
Other reasons. Finally, in addition to the subgroups citing security concerns, lack of information, or difficulty signing up, a substantial segment—28.1 percent of all adults—report open-ended or situational reasons for not registering or being willing to register (for example, “it's not very useful right now” or “no particular reason”). This is most prevalent among younger adults: 42.2 percent of adults aged 18–29 indicate they do not see an immediate need. Among the racial and ethnic subgroups, Native Hawaiian or Pacific Islander adults (31.8 percent) are also somewhat more likely to offer situational or open-ended responses. Despite their hesitancy, adults in this category tend to feel relatively comfortable using online government services (76.9 percent) and banking (76.5 percent), suggesting that their lack of enrollment is not driven by security or technical concerns but rather by a perceived lack of need for my Social Security at present. Highlighting potential future benefits—such as quick access to benefit statements—may help these adults recognize potential advantages of registering before they reach an age or circumstance where immediate need arises.
Discussion
This study highlights several factors influencing my Social Security awareness and registration among U.S. adults. Notably, older and more educated individuals are the most likely to have heard of and registered for my Social Security, whereas younger and less educated populations often remain either unaware of the platform or hesitant to register, citing security concerns, a need for more information, or difficulties with the registration process. In addition, a large subset of adults perceive my Social Security as unnecessary at this point in their lives or report other respondent-specific reasons3 for not registering, despite generally feeling comfortable with online transactions.
We combine two measures that capture different stages of the decision process: reasons for nonregistration among adults who are already aware of my Social Security and stated hesitancy to register among adults who were unaware before the survey. The former reflects realized obstacles conditional on awareness, whereas the latter reflects pre-awareness attitudes and expectations. In future work, a larger UAS sample could support separate analyses of these stages while maintaining statistical power for subgroup estimates. The measures could be used to define types of potential my Social Security users to inform strategies to encourage account uptake.
These findings underscore the importance of nuanced approaches to encouraging use of e-government platforms such as my Social Security. Some barriers—such as security or procedural concerns—could potentially be addressed through proactive messaging about the platform's protections and clear explanations of how to set up an account. Others, such as a belief that my Social Security is not immediately relevant, might be addressed by highlighting the platform's longer-term benefits, including convenient access to earnings records and benefit statements.
Limitations of the current survey
A notable limitation of this study is the treatment of “other” and “open-ended” responses in the analysis of hesitancy to register for a my Social Security account. In this analysis, responses such as “not useful right now” and “no particular reason” were grouped together with all “other” and open-ended answers into a single broad category. Although this approach allows for a more streamlined summary, it risks obscuring important distinctions among respondents, because the combined category likely includes a wide range of motivations and barriers (from a lack of immediate need or interest to unique personal circumstances or reasons that do not fit the structured response options). Aggregating these responses may therefore mask meaningful differences and limit the ability to identify specific, actionable barriers that could inform targeted outreach or policy changes.
In addition, because the open-ended responses were not coded or further categorized, the analysis cannot examine the specific content or themes within this group. This limitation constrains understanding of the full range of reasons for hesitancy, including whether certain demographic groups are more likely to cite “not useful right now,” “no particular reason,” or other unique circumstances. Future research that collects and systematically analyzes the raw open-ended responses—for example, through qualitative coding or thematic analysis—may provide deeper insights into the diversity of hesitancy and help inform more tailored interventions to increase my Social Security participation.
Notes
1 See https://www.congress.gov/107/plaws/publ347/PLAW-107publ347.pdf.
2 The survey provides the following brief explanation of the platform: “my Social Security is an online account that adults with a Social Security number can set up through the Social Security Administration.”
3 The authors did not have access to open-ended respondent-specific reasons. This is addressed more thoroughly in the limitations section, along with possible methods to improve future waves.
References
Adnan, Mohammed, Masitah Ghazali, and Nur Zuraifah Syazrah Othman. 2022. “e-Participation Within the Context of e-Government Initiatives: A Comprehensive Systematic Review.” Telematics and Informatics Reports 8: 100015. https://doi.org/10.1016/j.teler.2022.100015.
Alattar, Laith, Matt Messel, and David Rogofsky. 2018. “An Introduction to the Understanding America Study Internet Panel.” Social Security Bulletin 78(2): 13–28. https://www.ssa.gov/policy/docs/ssb/v78n2/v78n2p13.html.
Government Accountability Office. 2024. Tribal Broadband: Additional Assistance to Recipients Would Better Support Implementation of $3 Billion in Federal Grants. GAO-24-106541. Washington, DC: GAO. https://www.gao.gov/products/gao-24-106541.
Rabinovich, Lila, and Francisco Perez-Arce. 2023. “Mixed-Methods Study to Understand Public Use of Social Security's Online Platform.” Social Security Bulletin 83(4): 1–18. https://www.ssa.gov/policy/docs/ssb/v83n4/v83n4p1.html.
Smith, Aaron. 2014. “Older Adults and Technology Use.” Pew Research Center. https://www.pewresearch.org/internet/2014/04/03/older-adults-and-technology-use/.
United Nations. 2024. “E-Government Development Index (EGDI).” UN E-Government Knowledgebase, United Nations Department of Economic and Social Affairs, Division of Public Institutions and Digital Government. https://publicadministration.un.org/egovkb/en-us/About/Overview/-E-Government-Development-Index.
Zhao, Yuxiang Chris, Mengyuan Zhao, and Shijie Song. 2022. “Online Health Information Seeking Behaviors Among Older Adults: Systematic Scoping Review.” Journal of Medical Internet Research 24(2): e34790. https://doi.org/10.2196/34790.