An Empirical Study of the Effects of Social Security Reforms on Benefit Claiming Behavior and Receipt Using Public-Use Administrative Microdata
Social Security Bulletin, Vol. 69, No. 3, 2009 (released October 2009)
In the past few years, the Social Security Old-Age and Survivors Insurance benefit system in the United States has undergone some of the most significant changes since its inception. In a short period of time, we have seen the implementation of the phased increase in the full retirement age (FRA) with the resulting increase in the penalty for claiming benefits early, the elimination of the earnings test for those above the FRA, and the incremental increase in the delayed retirement credit (DRC) for those claiming benefits after the FRA. Because these changes have taken place only recently, there is relatively little research using household-level data that analyzes the consequences of all these changes. Using the public-use microdata extract from the Master Beneficiary Record, we are able to uncover a number of interesting trends in benefit claiming behavior and level of benefit receipt, which can help us understand how the changes in the system are shaping the retirement benefit claiming behavior of older Americans. We find evidence of substantial effects of the removal of the earnings test and the increase in the FRA, but evidence of very small effects as a result of the increases in the DRC.
Hugo Benítez-Silva is an associate professor of economics and director of graduate studies at the State University of New York at Stony Brook. Na Yin is an assistant professor of economics at Baruch College, School of Public Affairs, City University of New York.
This article has also circulated under the titles "Actuarial Fairness, Retirement Benefits, Self-Selection, and Individual Heterogeneity," and "An Analysis of the Effects of Recent Social Security Reforms Using Aggregate and Public-Use Administrative Micro Data."
Acknowledgments: We are grateful to Frank Heiland, Lina Walker, and the participants in the Aging and Social Security session at the APPAM Conference in Washington, DC, who provided excellent comments and suggestions. Barbara Lingg, Christine Vance, Rona Blumenthal, Joyce Manchester, and Kimberly Burham provided invaluable help dealing with the data set we use. Any remaining errors are those of the authors. Hugo Benítez-Silva acknowledges the financial support from Grant No. 5 P01 AG022481-04 from the National Institute on Aging and the Spanish Ministry of Science and Technology, through project number SEJ2005-08783-C04-01.
Contents of this publication are not copyrighted; any items may be reprinted, but citation of the Social Security Bulletin as the source is requested. The findings and conclusions presented in the Bulletin are those of the authors and do not necessarily represent the views of the Social Security Administration.
Summary and Introduction
| ARF | actuarial reduction factor |
| DRC | delayed retirement credit |
| FRA | full retirement age |
| MBR | Master Beneficiary Record |
| OASDI | Old-Age, Survivors, and Disability Insurance |
| OASI | Old-Age and Survivors Insurance |
| PIA | primary insurance amount |
| SSA | Social Security Administration |
In the past few years Social Security's Old-Age and Survivors Insurance (OASI) program has undergone some of the most important changes since its inception. In a short period of time, we have seen three major changes to the system: (1) the implementation of the phased increase in the full retirement age (FRA), with the resulting increase in the penalty for claiming benefits early; (2) the elimination of the earnings test for those above the FRA; and (3) the incremental increase in the delayed retirement credit (DRC) for those claiming benefits after the FRA.
The changes in the FRA and the most recent changes in the DRC are the result of the reforms signed into law by President Reagan in 1983 following the recommendations of the National Commission on Social Security Reform chaired by Alan Greenspan. The removal of the earnings test is a more recent development, which was introduced in the last year of Clinton's presidency and most likely unexpected for the average American.1 There is relatively little research analyzing the consequences of all these changes, mainly because of how recent they are, but also because of the difficulty identifying the likely contribution of these changes to variables of interest such as labor supply and claiming behavior using publicly available household-level data.
In this article we use microdata from public-use extracts from the Master Beneficiary Record (MBR) to uncover a number of interesting trends in benefit claiming behavior and especially novel trends in the level of benefit receipt. The analysis can help us understand how the changes in the system are shaping the retirement behavior of older Americans.
Our analysis finds evidence of significant effects of the removal of the earnings test, with a large and significant short-run effect of abolishing the test on the claiming behavior of older Americans and evidence of a significant and much longer-lived effect on the composition of benefit claimers and their levels of benefits received after age 65. We also find sizable effects in the levels of benefits received by early claimers, especially men, as a result of the increase in the FRA, but a hardly noticeable effect of the increases in the DRC. The results on claiming behavior are very similar to those discussed in recent articles by Song and Manchester (2007a, 2007b, and 2007c) using the same data but different empirical strategies. As far as we know, we are the first to analyze the trends in benefit receipt during the period from 1994 through 2004 and connect them with the reforms to the system.
Our findings should encourage researchers to use the public-use data provided by the Social Security Administration (SSA). This data source can complement more traditional analyses using household-level data and provide useful benchmarks for researchers modeling retirement behavior using advanced econometric and computational methods of analyses.
This data source, although highly reliable for the study of claiming behavior, has the disadvantage of not allowing us to control for the usually long list of sociodemographic and socioeconomic variables or to analyze other relevant variables of interest such as labor supply. This means that there is potentially a large amount of heterogeneity, which in other studies would be observable, but in this case remains unobservable for us. However, we find that our ability to access detailed information on claiming behavior and the level of benefits resulting from that benefit application allows us to provide a realistic and surprisingly illuminating picture of how changes in the system are quite likely affecting claiming behavior, which suggest a large explanatory power intrinsic in accurately observing the self-selection into claiming and the importance of properly understanding the complex set of incentives involved in people's decision to apply for retirement benefits at a given age.
It is important to highlight that the nature of the analysis we perform does not allow us to guarantee that the patterns we observe in claiming behavior and level of benefits received are solely the product of the policy changes. In terms of identification, other macro effects and also cohort effects could be driving, at least in part, the results. Given the lack of plausible reasons for the large differences over time and across cohorts that could be responsible for the particular pattern of decisions and outcomes we observe, we believe the policy changes are the most natural and appealing explanation.2
A discussion of the incentive structure provided by Social Security's OASI system follows. Next, we give information about the data set used in the analysis and then report our main findings. Our conclusions are given in the last part of the article.
Retirement Benefits: An Overview
Public pensions are a major income source for older Americans, and under the OASI program during 2008, SSA paid about $509.3 billion to almost 42 million beneficiaries (Board of Trustees 2009). Given the importance of Social Security, it is not surprising that the discussion over the need of reforms to the system has gone on for a long time. In fact, the 1983 Amendments to the Social Security Act were meant to solve short-term financial imbalances and the more serious long-run financial crisis that Social Security was headed toward. The reforms resulting from those amendments have started to take effect during the past few years, as the discussion on possible additional reforms continues.
Social Security provides fairly complex incentives that undoubtedly affect the labor supply and benefit claiming behavior of individuals starting at the early retirement age and continuing until age 70.3 Retirement benefits at all ages are intimately linked to a person's earnings history, but also to a fairly large number of provisions that compute the benefits a person receives as a function of the following:4
- the person's 35 highest years of earnings, conditional on having at least 40 quarters of covered earnings, which loosely translates into 10 years of paid work. Any years without covered earnings go into the formula as a zero.
- the indexing factors to adjust past earnings to current wage levels. These factors reflect the growth in average earnings in the economy over the years.
- the progressive formula, which uses bend points (indexed to the growth rate in the average wage index and therefore change every year) and marginal replacement rates (fixed) by indexed-earnings brackets to compute the primary insurance amount (PIA). The latter is the level of benefits a person receives if he or she claims benefits at the FRA.
- the actuarial reduction factor (ARF), which determines the reduction in benefits that individuals face if they claim benefits before attaining the FRA. This reduction factor depends on the person's FRA. For those who claimed benefits upon attaining age 62 in 2008, the FRA was 66 and the reduction factor was 0.75. The reduction factor will be 0.7 for earliest entitlement when the FRA increases to age 67 for people born in 1960 or later. Given that individuals can claim benefits in any month after they reach age 62, the reduction factor is 5/9 of 1 percent during the first 36 months before the FRA, and 5/12 of 1 percent for the months beyond the first 36. The benefit reduction is permanent unless benefits are reduced because of the earnings test. In that case, as explained later, there will be a recalculation of this factor when the person reaches the FRA.
- the DRC, which determines the upward adjustment of benefits if individuals claim after the FRA. For those born in 1943 or later, it is 2/3 of 1 percent for each month up to age 70. For those born before 1943, it ranges from 11/24 to 5/8 of 1 percent per month, depending on their birth year. In fact, the Amendments of 1983 included, among other measures, a phased increase in the DRC, with the clear objective of fostering work after the FRA. The DRC started to increase (from an initial annualized value of 3 percent) by half a percentage point for those attaining age 65 in the 1990–1991 period, and it has increased by half a percentage point every 2 years, reaching 8 percent for the cohort that will reach age 65 in 2008—the level at which it will stay until further reform changes it.
- the earnings levels between the time the person claims benefits and reaches the FRA, in order to apply the earnings test and withhold benefits if necessary. Therefore, the exempt amounts matter and they are different in the period between the early retirement age and the year the person reaches the FRA, and thereafter.5
- the number of monthly checks withheld because of the earnings test. This function is used once the person reaches the FRA to compute the upward adjustment to the ARF to compensate for the withheld benefits.6
The concept of actuarial fairness is underlying all these factors and especially those that require adjustments that are due to early or late (with respect to the FRA) claiming of benefits. Although the application of this concept faces practical difficulties given how long ago some of these adjustment factors were decided and the reasons for them, the idea is that an individual with a life expectancy at the average of the population should be indifferent between claiming benefits early at a reduced rate and claiming them at any point after that, assuming all individuals have the same subjective discount rate or that there is a distribution of discount rates, which maps the mortality probabilities in the population.7 In budgetary terms it means that no additional cost to the system arises on account of early (or late) retirement.8
At the individual level, however, it should come as no surprise that empirically we will observe in our analysis that actuarial fairness, although it goes a long way in explaining disparities in benefit levels, does not perfectly account for the different benefit claiming behavior of older Americans, even when we observe population data that allows us to use law-of-large-numbers arguments to approximate aggregate behavior. The reason is that there are many other factors potentially affecting claiming behavior, some of them relatively well understood and others the object of current and future research. In part, this article tries to analyze how substantial deviations from those averages can be linked to claiming behavior and the level of benefits of those claiming at different ages.
Open questions should come as no surprise given the short time since some of these changes started to take place and the fact that these changes are still taking place. These complications are exemplified by the three types of policy changes we focus on in this article: (1) the changes in the FRA, which affect the reduction factors when individuals claim early; (2) the changes in the adjustments that are due to late claiming of benefits; and (3) the removal of the earnings test for those above the FRA. The administrative publicly available extract of the MBR can be used to characterize some of the consequences of these changes, and it provides insightful discussions of how possible reforms will most likely affect the claiming behavior of older Americans.
The 1983 Amendments to the Social Security Act included, among other measures, the change in the FRA starting with the cohort attaining age 62 in 2000 (those born in 1938), for whom the FRA was set at 65 and 2 months. The FRA has increased by 2 months for every cohort since then until it reached 66 for those who attained age 62 in 2005, and it will stay at that level for a decade. The FRA will increase again by 2 months for the cohort born in 1955 (who reach age 62 in 2017, and it will continue to increase by 2-month increments for successive birth cohorts until it reaches 67 for the 1960 cohort.
The changes in the FRA and the DRC were clearly easy to anticipate by those nearing retirement age, and it is natural to expect comparatively less pronounced changes in behavior resulting from their phased implementation.9 More unexpected was the repeal of the earnings test for individuals above the FRA, which withholds benefits for individuals earning above the exempt amounts. The legislation was passed in the spring of 2000, approximately a year after it was made a policy objective by President Clinton in early 1999, and it affected earnings obtained after January 1, 2000. The literature analyzing the effects of the earnings test is also quite large and has focused primarily on understanding whether people respond to the exempt amount.10 Given the data analyzed, we are in a position to infer possible changes in behavior that are due to the repeal of the earnings test, which would otherwise be hard to characterize using household-level data.
Data
We use the 2004 publicly available release of the Old-Age, Survivors, and Disability Insurance (OASDI) public-use microdata files to analyze the trends in claiming behavior and level of benefits received in the 1994–2004 period.11 The 2004 Benefits and Earnings public-use file is a 1 percent random sample of OASDI beneficiaries who were on the Social Security records in December 2004. It contains 473,366 records as of December 2004 and includes information in 16 fields on OASDI beneficiaries' characteristics, mainly about benefit entitlements. This more detailed information allows us to focus only on retired workers who claimed benefits on their own earnings history, and because it is individual-level data, we can compute standard deviations and therefore statistically compare benefit levels across ages and years.
This microdata has, however, two weaknesses. First, we have not been able to separate disability conversions from new entitlements for those persons claiming benefits at age 65 or the FRA, if higher—a distinction that the public-use file does not allow us to make.12 What we have done to overcome this problem is to assume a proportion of Social Security claimants from age-65 samples each year as disability conversions. The proportions used are calculated according to the Annual Statistical Supplement to the Social Security Bulletin—referred to elsewhere in this article as the Supplement (SSA 1995–2008). Second, we are restricting attention to individuals in the MBR as of December of 2004. The latter method most likely results in a selection bias when looking at historical data on individuals who claimed benefits in the decade before 2004. The reason is that some individuals who claimed in the 1990s, or even more recently, might not be in the sample if they have died in the time since their application for benefits.13
Claiming Behavior and Retirement Benefits
Using public-use data extracts from the MBR, we notice the well-known retirement peaks at ages 62 and 65, both thinking in terms of proportions of claimers in a given calendar year and as proportions by cohort over different years.14 It is interesting to highlight, however, that the relative sizes of these peaks, as proportions by calendar year, have changed considerably from previous decades—where the largest peak occurred at age 65 in the 1970s—or were roughly of similar size during part of the 1980s. In our study period, from 1994 through 2004, we see that the proportion of individuals claiming benefits at age 62 has remained quite stable in most years (in the 48–52 percent range) with the proportion of individuals claiming benefits before the FRA at almost 64 percent by 2004. This is a key development of the past two decades and one that has puzzled economists considerably.15 On the other hand, the proportion of individuals claiming benefits at age 65 has remained at about 20 percent.
Until recently a number of researchers have tried to explain this with arguments regarding individual preferences (Coile, Gruber, and Jousten 2002; Gustman and Steinmeier 2002), suggesting that there is a proportion of individuals who seem to be rather myopic and do not quite behave as forward-looking optimizers. Other authors have recently shown that once the full incentive structure of the system is properly modeled (mainly regarding the earnings test provisions), these proportions are much more consistent with the predictions of a fully dynamic intertemporal model of behavior than previously thought (Benítez-Silva and Heiland 2007).16
Evidence on Claiming Behavior
Table 1 shows the proportion of individuals claiming Social Security retirement benefits by age in the 1994–2004 period, as well as the total number of individuals who claimed in a given year. The total number of claimants used to compute the proportions does not include the disability conversions at age 65 (or the FRA if higher), but does include the relatively small number of individuals who claim at age 70 or older (proportions not included in the table).17
| Age | 1994 | 1995 | 1996 | 1997 | 1998 | 1999 | 2000 | 2001 | 2002 | 2003 | 2004 |
|---|---|---|---|---|---|---|---|---|---|---|---|
| 62 | 0.523 | 0.512 | 0.511 | 0.518 | 0.518 | 0.503 | 0.452 | 0.490 | 0.483 | 0.487 | 0.496 |
| 63 | 0.161 | 0.166 | 0.143 | 0.151 | 0.152 | 0.147 | 0.136 | 0.157 | 0.156 | 0.145 | 0.143 |
| 64 | 0.074 | 0.069 | 0.064 | 0.063 | 0.068 | 0.067 | 0.060 | 0.069 | 0.070 | 0.069 | 0.067 |
| 65 | 0.184 | 0.196 | 0.176 | 0.186 | 0.186 | 0.196 | 0.228 | 0.241 | 0.247 | 0.254 | 0.201 |
| 66 | 0.018 | 0.020 | 0.023 | 0.021 | 0.021 | 0.027 | 0.043 | 0.009 | 0.011 | 0.011 | 0.071 |
| 67 | 0.010 | 0.010 | 0.014 | 0.013 | 0.013 | 0.017 | 0.027 | 0.006 | 0.005 | 0.006 | 0.004 |
| 68 | 0.008 | 0.007 | 0.009 | 0.009 | 0.009 | 0.011 | 0.018 | 0.005 | 0.004 | 0.005 | 0.004 |
| 69 | 0.006 | 0.006 | 0.009 | 0.007 | 0.008 | 0.008 | 0.012 | 0.005 | 0.005 | 0.004 | 0.002 |
| Total number | 10,700 | 11,026 | 11,676 | 11,619 | 12,055 | 13,048 | 14,976 | 13,606 | 13,708 | 14,098 | 14,852 |
| SOURCE: OASDI public-use microdata file, 2004. | |||||||||||
| NOTE: In the data, there is no way to separate disability converters from old-age claimants at age 65. What we have done is to assume a proportion of Social Security claimants from age-65 samples each year as disability converters. The proportions used are calculated according to the Supplement. | |||||||||||
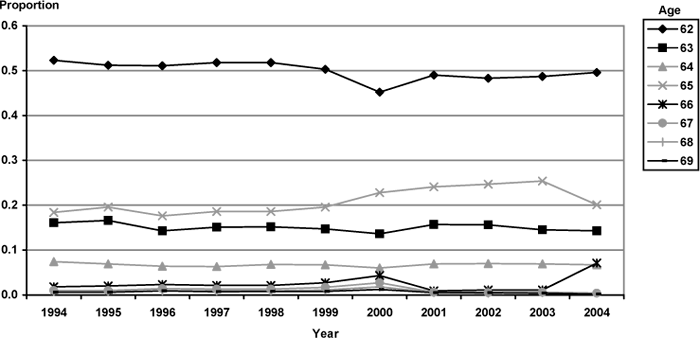
Chart 1, which illustrates the data in Table 1, shows that the proportions of individuals claiming benefits at different ages changed dramatically in 2000, with a large drop in the proportion claiming at age 62 (from 50 percent to around 45 percent), but a sharp increase in those claiming at age 65 or older. In 2000, the implementation of the FRA increase started, increases in the DRC continued, and the earnings test was repealed. Although the increase in the FRA is unlikely to have much of an effect in this case, given that it only affected those turning age 62 in 2000 who faced an increase in the FRA of only 2 months, an explanation linked to the elimination of the earnings test seems much more reasonable. Also, although the proportions changed considerably, the number of individuals claiming retirement benefits by age (Table 2) did not change much, except for those at age 65 (by approximately 200,000 people if we look at the aggregate data in the Supplement compared with the previous periods for this age in the year 2000, which explains the large jump in the total number of claimants shown in Table 1) to age 69.
Proportion of new claimants of Social Security retirement benefits, by age, 1994–2004
| Age | 1994 | 1995 | 1996 | 1997 | 1998 | 1999 | 2000 | 2001 | 2002 | 2003 | 2004 |
|---|---|---|---|---|---|---|---|---|---|---|---|
| 62 | 5,592 | 5,641 | 5,967 | 6,022 | 6,245 | 6,565 | 6,767 | 6,671 | 6,627 | 6,861 | 7,372 |
| 63 | 1,726 | 1,829 | 1,668 | 1,749 | 1,831 | 1,921 | 2,034 | 2,141 | 2,132 | 2,047 | 2,121 |
| 64 | 796 | 762 | 748 | 733 | 815 | 877 | 894 | 933 | 961 | 971 | 988 |
| 65 | 1,973 | 2,156 | 2,054 | 2,164 | 2,246 | 2,556 | 3,411 | 3,280 | 3,392 | 3,581 | 2,985 |
| 66 | 197 | 220 | 263 | 246 | 254 | 358 | 638 | 117 | 153 | 162 | 1,052 |
| 67 | 105 | 108 | 159 | 146 | 160 | 217 | 399 | 86 | 70 | 89 | 66 |
| 68 | 81 | 73 | 103 | 99 | 104 | 142 | 264 | 67 | 57 | 71 | 57 |
| 69 | 68 | 64 | 102 | 84 | 99 | 106 | 187 | 69 | 71 | 63 | 36 |
| Total | 10,700 | 11,026 | 11,676 | 11,619 | 12,055 | 13,048 | 14,976 | 13,606 | 13,708 | 14,098 | 14,852 |
| SOURCE: OASDI public-use microdata file, 2004. | |||||||||||
| NOTE: In the data, there is no way to separate disability converters from old-age claimants at age 65. What we have done is to assume a proportion of Social Security claimants from age-65 samples each year as disability converters. The proportions used are calculated according to the Supplement. | |||||||||||
These increases are larger than those described in Song (2004), but more in line with those described in Song and Manchester (2007a and 2007b), and suggest that individuals reacted to the elimination of the earnings test quite sharply and in accordance with a policy that eliminates any link between claiming benefits and labor earnings. These results are very much in line with those recently reported in Song and Manchester (2007c), who using the same data focus on the claiming behavior of individuals after the elimination of the earnings test for those above the FRA.18 In the years since that change, the proportions of individuals claiming benefits at age 62 have risen even as the penalty for claiming early has become higher; the proportion claiming at age 65 has stayed at higher levels. In the meantime the proportions of those claiming after age 65 have returned to pre-2000 levels and even gone lower, suggesting a very small effect of the increases in the DRC on claiming behavior.19 This latter result is in part surprising given the substantial increases in the DRC in the past years and its level, suggesting that alternative policies are necessary to convince individuals to claim benefits later and stay in the labor force longer. One possible reasonable explanation is that the likely effects of the increases in the DRC have been offset by the elimination of the earnings tests because these two policies seem to have affected claiming behavior in opposite directions around the FRA.
One number clearly stands out in Table 1—the large increase in the proportion of individuals claiming benefits at age 66 in 2004; see corresponding number in Table 2. The percentage claiming at age 66 increases from 1.1 percent to 7.1 percent in a single year. The reason for this is that the microdata report differently from the Supplement the claiming of benefits at the FRA of 65 and 2 months for the cohort who turned 66 in 2004. In the Supplement, those claiming benefits at age 65 and 2 months appear to be claiming at age 65, while in the microdata they appear to be claiming at age 66. This also explains the increasing percentage claiming at age 65 in 2004 as reported in the Supplement, but the declining percentage claiming at the same age in the microdata. The advantage of the microdata is that they show something that is well-known, but elusive in this period of changing FRA: A nontrivial number of individuals claim benefits exactly when they reach the FRA.20 Song and Manchester (2007c) present striking additional evidence to that effect.
Evidence on Level of Benefit Receipt
Table 3 presents the level of average monthly benefits adapted for the adjustment factors that have changed considerably in the period of analysis resulting from the policy changes we have discussed. The evolution of these factors is presented in Table 4 and then used to obtain the ARF/DRC-adjusted or actuarially adjusted (and inflation-adjusted by the Consumer Price Index, so that the benefit levels are all reported in 2005 dollars) benefit levels in the remaining tables, discussed later.21 These adjustments are necessary so that benefits can now be compared, with the theory in mind that in the absence of self-selection (which embeds individual heterogeneity, including for example, differential mortality expectations, health status, and earnings histories), the prediction would be that the benefit levels would not change by age, and they would only change by year because of time and cohort effects, where the former includes policy changes and macroeconomic effects.22
| Age | 1994 | 1995 | 1996 | 1997 | 1998 | 1999 | 2000 | 2001 | 2002 | 2003 | 2004 |
|---|---|---|---|---|---|---|---|---|---|---|---|
| 62 | 1,065.91 | 1,039.24 | 1,041.99 | 1,050.28 | 1,061.61 | 1,112.96 | 1,110.40 | 1,137.49 | 1,172.71 | 1,181.27 | 1,134.81 |
| 63 | 1,041.79 | 1,070.49 | 1,045.26 | 1,043.64 | 1,058.63 | 1,057.92 | 1,105.28 | 1,104.24 | 1,123.12 | 1,157.47 | 1,110.99 |
| 64 | 1,089.06 | 1,088.86 | 1,095.24 | 1,060.10 | 1,056.50 | 1,089.29 | 1,101.26 | 1,162.92 | 1,186.47 | 1,185.22 | 1,182.06 |
| 65 | 1,138.35 | 1,129.55 | 1,128.78 | 1,134.92 | 1,103.10 | 1,103.48 | 1,123.02 | 1,150.72 | 1,194.23 | 1,210.43 | 1,172.53 |
| 66 | 1,190.88 | 1,080.07 | 1,137.30 | 1,090.37 | 1,146.25 | 1,161.20 | 1,224.59 | 891.68 | 862.49 | 977.08 | 1,134.78 |
| 67 | 1,071.46 | 1,083.73 | 1,113.53 | 1,068.67 | 1,028.65 | 1,149.16 | 1,248.28 | 833.95 | 878.65 | 848.13 | 907.75 |
| 68 | 1,030.63 | 966.00 | 1,009.15 | 1,000.26 | 1,002.91 | 1,089.51 | 1,213.70 | 847.24 | 748.87 | 730.58 | 774.61 |
| 69 | 1,173.50 | 1,171.31 | 1,012.89 | 997.81 | 998.48 | 1,088.88 | 1,149.75 | 873.58 | 840.28 | 694.77 | 838.93 |
| SOURCE: Authors' calculations using the OASDI public-use microdata file, 2004. | |||||||||||
| NOTE: Shading is used to emphasize differences by age group. | |||||||||||
| Age | 1994 | 1995 | 1996 | 1997 | 1998 | 1999 | 2000 | 2001 | 2002 | 2003 | 2004 | 2005 | 2006 |
|---|---|---|---|---|---|---|---|---|---|---|---|---|---|
| 62 | 0.800 | 0.800 | 0.800 | 0.800 | 0.800 | 0.800 | 0.792 | 0.783 | 0.775 | 0.767 | 0.758 | 0.750 | 0.750 |
| 63 | 0.867 | 0.867 | 0.867 | 0.867 | 0.867 | 0.867 | 0.867 | 0.856 | 0.844 | 0.833 | 0.822 | 0.811 | 0.800 |
| 64 | 0.933 | 0.933 | 0.933 | 0.933 | 0.933 | 0.933 | 0.933 | 0.933 | 0.922 | 0.911 | 0.900 | 0.889 | 0.877 |
| 65 | 1.000 | 1.000 | 1.000 | 1.000 | 1.000 | 1.000 | 1.000 | 1.000 | 1.000 | 0.989 | 0.978 | 0.967 | 0.955 |
| 66 | 1.040 | 1.045 | 1.045 | 1.050 | 1.050 | 1.055 | 1.055 | 1.060 | 1.060 | 1.065 | 1.054 | 1.047 | 1.035 |
| 67 | 1.080 | 1.080 | 1.090 | 1.090 | 1.100 | 1.100 | 1.110 | 1.110 | 1.120 | 1.120 | 1.130 | 1.119 | 1.116 |
| 68 | 1.105 | 1.120 | 1.120 | 1.135 | 1.135 | 1.150 | 1.150 | 1.165 | 1.165 | 1.180 | 1.180 | 1.195 | 1.184 |
| 69 | 1.140 | 1.140 | 1.160 | 1.160 | 1.180 | 1.180 | 1.200 | 1.200 | 1.220 | 1.220 | 1.240 | 1.240 | 1.260 |
| SOURCE: Authors' compilation of information from the Social Security Administration. | |||||||||||||
In Table 3, we are essentially estimating the average PIA by age and year for those applying in this period. Our calculation is likely to differ from the actual PIAs for two reasons. First, in our calculations it is assumed that individuals claim exactly on their birthdays (or in the month they reached the FRA for claimers who were 65 in 2003 or later), which means that for those claiming in the months between birthdays, our calculation will use an ARF that is too small, resulting in an adjusted benefit that is higher than the PIA. Second, the benefit level reported is taking into account the effect of the earnings test, but because the earnings test is nearly actuarially fair, our adjustment delivers an approximation that is too low compared with the true PIA. Because these effects move in different directions, it is an empirical question whether our approximation of the PIA is upward or downward biased. We have also used the PIA reported in the public-use microdata extract to perform the same analysis we present below, and the results are essentially unchanged as shown in Tables A-1 and A-2 in the Appendix.23 The advantage of what we report here is that it can be compared by researchers with aggregate data from the Supplement, which is easily and readily accessible to researchers but does not provide the PIA.
From Table 3 it should be clear that accounting for the actuarially fair nature of the ARF and the DRC is important, and we see that although the numbers in the table are hardly the same by age or year, they are mostly of the same order of magnitude, suggesting the considerable explanatory power of self-selection; this most likely puts to rest any notion that early retirees are comparatively (and on average) much worse off than those claiming retirement benefits at later ages from SSA. Notice, however, that there is obviously a distribution of monthly benefits underlying these numbers, which might still have a significant proportion of individuals with very low level of benefits. Also note that the standard deviations (not shown in the tables) for those claiming benefits early are actually smaller than the standard deviations of those claiming at later ages, suggesting that the dispersion is not particularly different for early claimers. An additional exploration of the data shows that the 25 percent percentile of the monthly benefit level is around $612 for those claiming before age 65 and $782 for those claiming at age 65 or older.
A number of researchers have described early retirees as comparatively similar to those who claim retirement benefits later (Burkhauser, Couch, and Phillips 1996; Smith 1999; Leonesio, Vaughan, and Wixon 2000; Mitchell and Phillips 2000), but not in terms of the level of benefits they receive.24 A possible explanation behind the notion (described as conventional wisdom by Burkhauser, Couch, and Phillips (1996)) that early retirees where disproportionally at risk is that it was developed in a period of time in which claiming early was relatively less common. With 73.2 percent of Americans currently claiming benefits before the FRA (SSA 2007), it is hardly surprising that the range of characteristics of these retirees covers the spectrum of the population. In summary, although we still have to "beware of the mean" as stated by Quinn (1987) in his analysis of the economic status of the elderly, this summary statistic might now be less problematic than it was a couple of decades ago.25
The most relevant result shown in Table 3, which becomes even clearer in Chart 2, is also the main result and contribution of this article, which is that the level of benefits received by those claiming them after age 65 (shaded cells) decreased sharply after 2000, and during the following years it becomes increasingly different from the level of benefits received by those aged 62–65. The difference from the pre-2000 period, when benefit levels at all ages tend to be within $100 of one another, is striking.
Average monthly Social Security retirement benefits, by age, 1994–2004
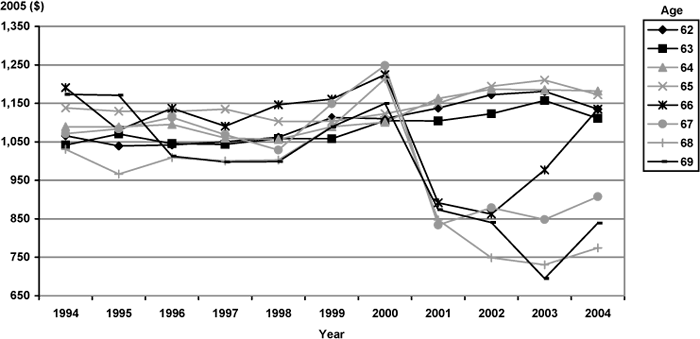
Those persons aged 62–65 have seen an upward trend in their benefit levels possibly resulting from the increase in the FRA. We can theorize that the increase in the penalty for claiming early can have two related effects. On one hand, one effect (which we could call a scale or wealth effect) should make everyone potentially interested in claiming later because of the fact that in order to reach the previous level of benefits, the claiming needs to be delayed. On the other hand, it is possible that the change in the FRA could affect lower-income career earners more, for whom the new adjusted benefits would fall short of what they consider adequate to make ends meet. The latter would suggest that some of those individuals would choose to delay benefit claiming slightly, leaving a higher proportion of higher-income earners among those claiming earlier. As we will see later, this interesting result is mainly driven by male workers.
With the elimination of the earnings test, it seems that the composition in terms of earnings histories of those claiming benefits after age 65 has changed considerably and now is composed of a higher proportion of individuals trying to catch up after having had sketchy careers or relatively low earnings histories, although before 2000 there were more high earners perhaps more focused on the short-term consequences of the earnings test provisions.26 Using data on total Social Security credits, we can analyze whether reaching fully insured status could be playing an important role among late claimers. We observe that there is a higher percentage of individuals near the 40 total credits (quarters of coverage) necessary to be insured among those claiming after age 65 (otherwise the distributions are quite similar), but because of the nature of the data we cannot observe the dynamics of how these credits were acquired, therefore we cannot present definitive evidence of individuals working longer after age 65 in order to achieve insured status. However, there is evidence that those claiming benefits later have comparatively lower total credits, with the 10th percentile at 43 credits for those claiming after age 65, and at 61 credits for those claiming at age 65. Therefore, it is plausible to believe that many of those claiming later could benefit from the extra years of work because they have a bit shorter employment histories.27
It would be ideal to additionally explore these conjectures regarding the composition of claimers using wage histories, however, this information is not available in the public-use microdata. We hope that in future releases of this data some additional variables are available, and some of these issues can be studied in more detail.
The sharp upward trend of the benefits received by those age 65 and those older than age 65 in the last couple of years, especially for men, provides some evidence of convergence toward the pre-2000 benefit levels. This could suggest the possibility that the increases in the DRC are finally playing a role among some workers with higher earnings histories and are more likely correlated to longer life expectancies of those who can gain the most from the permanent increases in their benefits if they claim later.
A clear advantage of using microdata is that we can now compute test statistics for the statistical significance of these average benefits with respect to the level of those that claimed, for example, at age 65 back in 1994, who at that time received 100 percent of their PIA at this age. Table 5 reports the t-statistics for the test of equality of means between the benefits received by those claiming at age 65 in 1994 and all the other ages and time periods. Notice that in most cases even if the benefit levels seem rather close, the levels are significantly different from those received by the age-65 claimers of 1994. In the table we also see that the major change in the post-2000 period in the level of benefits received by those claiming after age 65 is highly significant. Furthermore, the level of benefits goes from being in a number of cases not significantly different from the 1994 figure in the pre-2000 period, to significantly higher in 2000, to significantly lower in the 2001–2004 period. This provides even clearer evidence of the changes resulting from abolishing the earnings test, even in the presence of the more generous DRC.
| Age | 1994 | 1995 | 1996 | 1997 | 1998 | 1999 | 2000 | 2001 | 2002 | 2003 | 2004 |
|---|---|---|---|---|---|---|---|---|---|---|---|
| 62 | -13.4805 | -18.8968 | -19.0375 | -17.0784 | -14.8081 | -4.7205 | -5.1620 | -0.1537 | 5.7532 | 7.3185 | -0.6521 |
| 63 | -10.7386 | -7.5375 | -10.1821 | -10.6993 | -8.8523 | -8.7318 | -3.5480 | -3.6254 | -1.5533 | 1.8736 | -2.7303 |
| 64 | -3.5988 | -3.5065 | -2.9701 | -5.2823 | -5.9061 | -3.5680 | -2.6853 | 1.7147 | 3.3087 | 3.0444 | 2.8563 |
| 65 | a | -1.0169 | -1.0494 | -0.3811 | -4.1109 | -4.4248 | -2.2722 | 1.7050 | 7.3361 | 9.1248 | 3.9703 |
| 66 | 1.6634 | -1.8287 | -0.0406 | -1.5536 | 0.2626 | 0.8813 | 4.7070 | -5.1937 | -6.8857 | -3.8777 | -0.2644 |
| 67 | -1.4849 | -1.1258 | -0.6589 | -1.6699 | -2.8487 | 0.3316 | 4.5750 | -6.4220 | -4.4015 | -5.3363 | -3.7827 |
| 68 | -1.7849 | -2.6873 | -2.6178 | -2.9188 | -2.7914 | -1.1290 | 2.3995 | -5.0251 | -7.3427 | -7.5304 | -6.9266 |
| 69 | 0.6060 | 0.5722 | -2.7263 | -2.5275 | -2.8545 | -1.0505 | 0.3075 | -5.0385 | -5.5857 | -8.7639 | -5.0799 |
| SOURCE: Authors' calculations using the OASDI public-use microdata file, 2004. | |||||||||||
| NOTE: The shaded cells represent significance at the 5 percent level or higher. | |||||||||||
| a. The corresponding cell from Table 3 is used as the comparison to test the equality of means with the rest of the cells in Table 3. | |||||||||||
Table 6 provides a slightly different presentation of the test of statistical significance of differences in means. In this case instead of using the level of benefits of those who claimed at age 65 in 1994, we use the age-specific benefit levels as of 1994 to capture the variation over time and by age in the level of benefits. The results are even more striking and show a clear divergence in the benefit levels over time for those between ages 62 and 65 and those aged 66 or older. Although the former group's level of benefits are on the rise with increasingly statistically significant results, the benefit level for late claimers is quite the opposite, and they are receiving much lower benefits over time. The breaking point is the year 2000, suggesting in even more striking fashion the likely effect of the removal of the earnings test in the composition of those claiming benefits after age 65 and the effect of the increase in the FRA in the composition of those claiming early.
| Age | 1994 | 1995 | 1996 | 1997 | 1998 | 1999 | 2000 | 2001 | 2002 | 2003 | 2004 |
|---|---|---|---|---|---|---|---|---|---|---|---|
| 62 | a | -5.0854 | -4.7262 | -3.0317 | -0.8293 | 8.7489 | 8.2168 | 12.7966 | 17.8826 | 19.6706 | 12.6929 |
| 63 | a | 3.1878 | 0.3795 | 0.2090 | 1.8700 | 1.7511 | 6.8118 | 6.6375 | 8.2948 | 11.3359 | 6.9055 |
| 64 | a | -0.0142 | 0.4258 | -1.9550 | -2.3494 | 0.0167 | 0.8833 | 5.1546 | 6.6978 | 6.2461 | 6.0776 |
| 65 | a | -1.0169 | -1.0494 | -0.3811 | -4.1109 | -4.4248 | -2.2722 | 1.7050 | 7.3361 | 9.1248 | 3.9703 |
| 66 | a | -3.4769 | -2.0748 | -3.2545 | -1.4839 | -1.1444 | 1.8398 | -6.2997 | -8.1969 | -5.1407 | -4.1568 |
| 67 | a | 0.2529 | 1.1169 | -0.0669 | -1.1116 | 2.3824 | 7.3587 | -5.0108 | -3.2678 | -4.1064 | -2.6854 |
| 68 | a | -1.0077 | -0.4352 | -0.6420 | -0.5713 | 1.3613 | 5.8301 | -3.1657 | -5.3119 | -5.5411 | -4.8753 |
| 69 | a | -0.0380 | -3.4901 | -3.1597 | -3.5718 | -1.7969 | -0.6406 | -5.7073 | -6.2444 | -9.4584 | -5.6763 |
| SOURCE: Authors' calculations using the OASDI public-use microdata file, 2004. | |||||||||||
| NOTE: The shaded cells represent significance at the 5 percent level or higher. Bold type is used to emphasize the differences by age group. | |||||||||||
| a. The corresponding cells from Table 3 are used as the comparison to test the equality of means with the rest of the cells, by age, in Table 3. | |||||||||||
Comparisons by Sex
Tables 7 through 9 break down the benefit claiming information by sex, providing a sample of what can be gained by controlling for some of the heterogeneity implicit in the previous tables.28 Table 7 presents the proportion of individuals claiming benefits by age for men and women. We observe that women claim at lower ages than men, with a larger proportion of them claiming at age 62, and a smaller proportion claiming at age 65. As shown for both men and women, the proportion of individuals suddenly claiming at age 66 increases by several percentage points from a very low level—from 1.0 percent to 7.6 percent for men and from 1.3 percent to 6.5 percent for women, although the aggregate data shows no such trend during the 2003–2004 period. This is probably in part the result of a combination of the complementarity of leisure for husbands and wives, coupled with the fact that men are, on average, a few years older than their wives (see Blau (1997 and 1998), Blundell and others (2001), and Benítez-Silva and Dwyer (2006)). We also see that the large shift in the proportions of claimants in 2000 was much more pronounced for men, but in both cases the proportions seem to have reverted to pre-2000 figures by 2004, with an additional effect—the proportions of those claiming after age 65 have decreased for both subsamples. The exception to this occurred in 2004 (and will possibly continue into the future), and as explained for Table 1, this is due to the way the microdata records (assigning claimers to age 66) individuals who file for benefits exactly when they reach the FRA (now higher).
| Age | 1994 | 1995 | 1996 | 1997 | 1998 | 1999 | 2000 | 2001 | 2002 | 2003 | 2004 |
|---|---|---|---|---|---|---|---|---|---|---|---|
| Men | |||||||||||
| 62 | 0.489 | 0.480 | 0.509 | 0.500 | 0.491 | 0.473 | 0.414 | 0.453 | 0.460 | 0.465 | 0.478 |
| 63 | 0.162 | 0.170 | 0.150 | 0.158 | 0.163 | 0.152 | 0.137 | 0.163 | 0.160 | 0.148 | 0.142 |
| 64 | 0.081 | 0.072 | 0.072 | 0.066 | 0.071 | 0.072 | 0.061 | 0.075 | 0.073 | 0.073 | 0.072 |
| 65 | 0.207 | 0.215 | 0.201 | 0.208 | 0.207 | 0.212 | 0.248 | 0.273 | 0.275 | 0.282 | 0.219 |
| 66 | 0.022 | 0.024 | 0.025 | 0.025 | 0.024 | 0.033 | 0.054 | 0.009 | 0.010 | 0.010 | 0.076 |
| 67 | 0.008 | 0.010 | 0.013 | 0.015 | 0.013 | 0.018 | 0.031 | 0.007 | 0.005 | 0.006 | 0.004 |
| 68 | 0.008 | 0.008 | 0.009 | 0.008 | 0.007 | 0.012 | 0.021 | 0.004 | 0.003 | 0.005 | 0.002 |
| 69 | 0.007 | 0.004 | 0.007 | 0.006 | 0.007 | 0.009 | 0.013 | 0.004 | 0.004 | 0.003 | 0.001 |
| Total number | 5,766 | 5,911 | 6,001 | 6,073 | 6,344 | 6,970 | 8,169 | 7,195 | 7,266 | 7,404 | 7,794 |
| Women | |||||||||||
| 62 | 0.562 | 0.548 | 0.513 | 0.538 | 0.548 | 0.537 | 0.497 | 0.532 | 0.510 | 0.510 | 0.517 |
| 63 | 0.160 | 0.161 | 0.135 | 0.143 | 0.140 | 0.142 | 0.134 | 0.151 | 0.151 | 0.142 | 0.144 |
| 64 | 0.066 | 0.065 | 0.055 | 0.060 | 0.064 | 0.062 | 0.058 | 0.061 | 0.066 | 0.064 | 0.061 |
| 65 | 0.158 | 0.173 | 0.149 | 0.162 | 0.163 | 0.178 | 0.203 | 0.205 | 0.216 | 0.223 | 0.181 |
| 66 | 0.015 | 0.015 | 0.020 | 0.017 | 0.018 | 0.021 | 0.029 | 0.008 | 0.012 | 0.013 | 0.065 |
| 67 | 0.012 | 0.010 | 0.014 | 0.010 | 0.014 | 0.015 | 0.022 | 0.006 | 0.005 | 0.007 | 0.005 |
| 68 | 0.007 | 0.005 | 0.009 | 0.009 | 0.010 | 0.009 | 0.014 | 0.006 | 0.006 | 0.005 | 0.005 |
| 69 | 0.005 | 0.007 | 0.011 | 0.009 | 0.009 | 0.007 | 0.012 | 0.007 | 0.000 | 0.000 | 0.004 |
| Total number | 4,934 | 5,115 | 5,675 | 5,545 | 5,711 | 6,079 | 6,806 | 6,410 | 6,442 | 6,695 | 7,057 |
| SOURCE: OASDI public-use microdata file, 2004. | |||||||||||
| NOTE: In the data, there is no way to separate disability converters from old-age claimants at age 65. What we have done is to assume a proportion of Social Security claimants from age-65 samples each year as disability converters. The proportions used are calculated according to the Supplement. | |||||||||||
Table 8 provides the retirement benefit mean levels that have been actuarially and inflation-adjusted for male and female workers, which we also show in Chart 3. Notice the large differences in benefit levels, with men receiving at most ages and in most years much higher benefits than women and with a much higher variance across ages. This comes as no surprise given what we know about the labor force participation and earnings of these groups during the past decades, but it is still worth noting. Again we also see in the chart, especially for men, the changing composition of claimers after age 65 and more clearly after the FRA, which should be considered to be 66 starting in 2004 for the purposes of Table 8. The break in the post-65 series in 2000 is striking. We also observe the trend toward some convergence to pre-2000 levels of benefits, again especially for men (Chart 3).
| Age | 1994 | 1995 | 1996 | 1997 | 1998 | 1999 | 2000 | 2001 | 2002 | 2003 | 2004 |
|---|---|---|---|---|---|---|---|---|---|---|---|
| Men | |||||||||||
| 62 | 1,203.60 | 1,176.75 | 1,179.96 | 1,208.52 | 1,233.06 | 1,302.46 | 1,315.69 | 1,352.61 | 1,402.60 | 1,414.35 | 1,356.50 |
| 63 | 1,161.82 | 1,201.06 | 1,178.75 | 1,178.69 | 1,199.40 | 1,205.90 | 1,275.80 | 1,264.56 | 1,310.93 | 1,355.05 | 1,317.45 |
| 64 | 1,209.15 | 1,212.80 | 1,227.03 | 1,206.12 | 1,209.64 | 1,223.97 | 1,240.47 | 1,322.56 | 1,344.97 | 1,359.56 | 1,354.08 |
| 65 | 1,260.02 | 1,262.20 | 1,264.51 | 1,280.74 | 1,243.25 | 1,234.88 | 1,258.35 | 1,298.34 | 1,348.48 | 1,384.61 | 1,349.91 |
| 66 | 1,333.34 | 1,176.89 | 1,275.72 | 1,201.11 | 1,279.76 | 1,286.73 | 1,331.57 | 944.09 | 856.84 | 1,157.49 | 1,300.07 |
| 67 | 1,205.93 | 1,165.30 | 1,261.28 | 1,246.09 | 1,155.12 | 1,274.97 | 1,398.17 | 848.03 | 869.19 | 925.18 | 1,078.54 |
| 68 | 1,062.62 | 1,050.64 | 1,191.53 | 1,217.22 | 1,238.22 | 1,183.47 | 1,367.90 | 918.91 | 922.04 | 679.81 | 678.86 |
| 69 | 1,311.41 | 1,384.28 | 1,218.69 | 1,189.95 | 1,140.63 | 1,211.33 | 1,333.55 | 1,069.62 | 852.70 | 712.98 | 836.69 |
| Women | |||||||||||
| 62 | 926.15 | 899.80 | 897.24 | 889.07 | 890.88 | 921.42 | 905.06 | 931.88 | 938.98 | 946.07 | 908.38 |
| 63 | 899.92 | 911.93 | 887.69 | 880.47 | 877.21 | 877.27 | 895.07 | 909.60 | 898.14 | 931.10 | 885.60 |
| 64 | 916.81 | 930.03 | 912.09 | 886.62 | 869.56 | 908.99 | 925.39 | 944.52 | 988.25 | 965.87 | 958.82 |
| 65 | 951.20 | 938.96 | 934.97 | 929.89 | 905.25 | 924.06 | 924.22 | 930.00 | 972.30 | 967.53 | 936.41 |
| 66 | 943.55 | 896.61 | 956.38 | 920.27 | 947.29 | 941.04 | 983.33 | 823.85 | 867.93 | 813.65 | 918.73 |
| 67 | 962.50 | 985.53 | 967.63 | 775.12 | 902.19 | 971.63 | 996.81 | 814.39 | 888.67 | 772.81 | 781.91 |
| 68 | 988.59 | 829.98 | 808.16 | 778.87 | 823.43 | 949.39 | 925.39 | 785.52 | 662.28 | 789.03 | 822.48 |
| 69 | 964.08 | 1,025.60 | 880.13 | 860.57 | 875.10 | 902.29 | 903.93 | 755.03 | 830.65 | 686.31 | 839.57 |
| SOURCE: Authors' calculations using the OASDI public-use microdata file, 2004. | |||||||||||
| NOTE: Shading is used to emphasize differences by age group. Bold type is used to emphasize differences by sex. | |||||||||||
Average monthly Social Security retirement benefits, by sex and age, 1994–2004
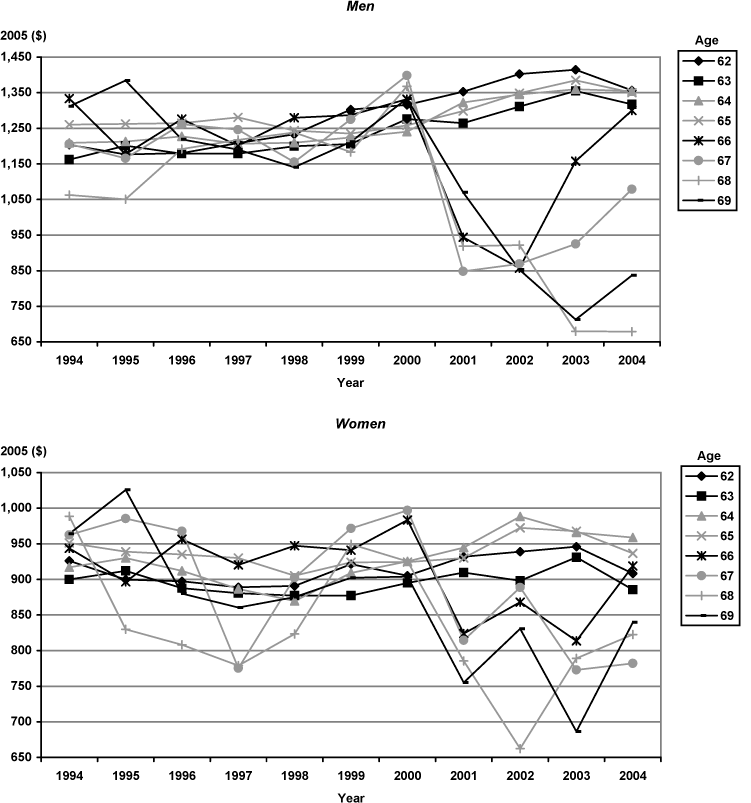
The statistical significance of the differences by sex and age are explored in Table 9. That analysis shows that for men, the changes in the benefit levels for those claiming after age 65 have been especially sharp in the post-2000 period; the much lower benefits since the elimination of the earnings test contrast with many years in which the benefit levels for those claiming at ages 66–69 were not statistically significantly different from the levels of those claiming at age 65 in 1994. One final important result is the significantly higher benefit levels among men claiming at age 62 (and also at ages 63–65) starting in 1999, compared with those claiming at age 65 in 1994, likely resulting from the composition of those claiming early after the implementation of the increases in the FRA. This effect seems to be much smaller for women.
| Age | 1994 | 1995 | 1996 | 1997 | 1998 | 1999 | 2000 | 2001 | 2002 | 2003 | 2004 |
|---|---|---|---|---|---|---|---|---|---|---|---|
| Men | |||||||||||
| 62 | -8.0485 | -12.0391 | -12.0371 | -7.5286 | -3.7941 | 5.9236 | 7.4083 | 11.8172 | 17.6262 | 19.0840 | 12.9759 |
| 63 | -8.4427 | -5.3728 | -7.2258 | -7.1668 | -5.3725 | -4.4740 | 1.3357 | 0.3633 | 3.9241 | 7.0243 | 4.3034 |
| 64 | -2.9746 | -2.5950 | -1.7915 | -2.7834 | -2.7543 | -2.0273 | -1.0789 | 3.4206 | 4.4613 | 5.0305 | 4.6576 |
| 65 | a | 0.2006 | 0.3866 | 1.8398 | -1.5491 | -2.5098 | -0.1983 | 4.3225 | 9.1668 | 12.5245 | 8.2154 |
| 66 | 2.0553 | -2.1057 | 0.5090 | -1.4214 | 0.5129 | 0.3134 | 1.1297 | -4.7461 | -6.4202 | -1.6187 | 2.2612 |
| 67 | -0.7686 | -1.3756 | 0.0236 | -0.2809 | -1.7136 | 0.3304 | 4.7137 | -5.6247 | -4.1352 | -3.5897 | -1.8140 |
| 68 | -2.2183 | -2.2577 | -0.9059 | -0.6648 | -0.2784 | -1.3099 | 2.9139 | -3.2463 | -3.2274 | -6.9940 | -5.2632 |
| 69 | 0.7077 | 1.3259 | -0.4890 | -0.7212 | -1.5169 | -0.7593 | 1.5287 | -1.8202 | -4.0705 | -5.3359 | -2.2697 |
| Women | |||||||||||
| 62 | -3.4522 | -7.3715 | -8.0576 | -9.5225 | -9.7547 | -4.5862 | -7.7022 | -3.1238 | -1.8326 | -0.8112 | -7.2473 |
| 63 | -4.1989 | -3.0617 | -5.0003 | -6.1377 | -6.2426 | -6.4374 | -4.8627 | -3.6144 | -4.7035 | -1.7065 | -5.7265 |
| 64 | -1.8202 | -1.1164 | -2.0471 | -3.4191 | -4.9134 | -2.3718 | -1.4572 | -0.3752 | 2.0109 | 0.7440 | 0.4103 |
| 65 | a | -1.0684 | -1.3725 | -1.8117 | -4.1544 | -2.6010 | -3.0871 | -2.2322 | 2.1959 | 1.6526 | -1.3827 |
| 66 | -0.1590 | -1.1458 | 0.1371 | -0.7715 | -0.0952 | -0.2981 | 1.1986 | -1.9225 | -1.6426 | -2.8306 | -2.0403 |
| 67 | 0.2064 | 0.5236 | 0.3410 | -3.1788 | -1.1499 | 0.5223 | 1.4068 | -2.6913 | -0.8889 | -3.1912 | -2.4065 |
| 68 | 0.4840 | -1.7215 | -2.9704 | -3.2030 | -2.5353 | -0.0305 | -0.5830 | -2.8440 | -5.1789 | -2.4343 | -2.3084 |
| 69 | 0.1571 | 1.1702 | -1.5565 | -1.5437 | -1.3517 | -0.8516 | -1.0374 | -4.0480 | -2.1660 | -4.5948 | -1.9692 |
| SOURCE: Authors' calculations using the OASDI public-use microdata file, 2004. | |||||||||||
| NOTE: The shaded cells represent significance at the 5 percent level or higher. Bold type is used to emphasize the differences by age group. | |||||||||||
| a. The corresponding cell from Table 8 is used as the comparison to test the equality of means with the rest of the cells in Table 8. | |||||||||||
Conclusions
This article uses microdata from the OASDI public-use microdata extract of 2004 to analyze the effects on retirement benefit claiming behavior and level of benefit receipt of a number of changes to the Social Security system implemented in the past few years. These changes include increasing the full retirement age, increasing the delayed retirement credit, and abolishing the earnings test for persons above the FRA.
We find evidence of a large and significant short-run effect of abolishing the earnings test on the claiming behavior of older Americans. There is also evidence of a significant, and much longer-lived effect on the composition of those claiming benefits after age 65 in the post-2000 period, with much lower average benefits for late claimers compared with those claiming at other ages. Both effects are stronger for men than for women. We also find evidence of significant effects resulting from the changes in the FRA, leading to an increase in the benefit levels among early retirees, coupled with a fairly large proportion of individuals that still wait to exactly reach the FRA to file, which likely predicts a sizable shift of the traditional age-65 retirement benefit claiming peak toward age 66 (and eventually even age 67) in the coming years. Additionally, there is evidence that the effects of the increases in the DRC seem to be very small.
Key to our analysis are the concepts of actuarial fairness and self-selection, which allow us to overcome, to a high degree, the impossibility to control for observed individual heterogeneity, as it is usually done in most micro-level analyses of retirement. The fact that individuals self-select themselves into claiming at different ages, given the well-known adjustments to their lifetime benefits if they choose to claim at an age that is not the FRA, allows us to extract considerable information from the data sources we use and provide a surprisingly sharp picture of the likely effects of policy changes—effects that have been hard to pinpoint by researchers using household-level data. Although it would be ideal to be able to control for a much larger array of observables in order to explain the changes we see in the data, we believe that even if this were possible, our main results would not change significantly.
Our analysis is not able to illuminate one key aspect intimately linked with claiming behavior and benefit levels, and that is labor supply. Some recent data suggest an increase in the labor force participation among older Americans, but to disentangle the sources of these changes will quite likely require fairly sophisticated models of behavior, using household-level data matched to Social Security administrative records. Those models should be able to match the patterns of claiming behavior and benefit levels we have described in this analysis.
Our findings should encourage researchers to use the public-use data provided by SSA. This data source can complement more traditional analyses using household-level data and provide useful benchmarks for researchers modeling retirement behavior using advanced econometric and computational methods of analysis.
Appendix
Table A-1 shows the actual PIAs for the same group of individuals as shown in Table 3. Table A-2 is the counterpart of Table 5, providing the t-statistics to assess the magnitude of the differences between all the numbers in Table A-1 and the reference cell.
| Age | 1994 | 1995 | 1996 | 1997 | 1998 | 1999 | 2000 | 2001 | 2002 | 2003 | 2004 |
|---|---|---|---|---|---|---|---|---|---|---|---|
| 62 | 940.78 | 926.23 | 935.13 | 953.19 | 973.71 | 1,034.55 | 1,046.03 | 1,080.50 | 1,127.71 | 1,142.03 | 1,103.01 |
| 63 | 979.89 | 1,009.24 | 992.26 | 1,004.17 | 1,026.54 | 1,030.67 | 1,089.22 | 1,098.32 | 1,123.75 | 1,165.74 | 1,121.95 |
| 64 | 1,018.19 | 1,021.65 | 1,047.72 | 1,013.85 | 1,012.43 | 1,039.77 | 1,061.02 | 1,135.15 | 1,154.62 | 1,165.67 | 1,181.94 |
| 65 | 1,057.93 | 1,058.15 | 1,058.74 | 1,078.11 | 1,054.01 | 1,061.43 | 1,099.92 | 1,122.12 | 1,170.74 | 1,181.23 | 1,141.35 |
| 66 | 1,136.01 | 1,026.72 | 1,101.08 | 1,053.64 | 1,121.91 | 1,124.77 | 1,232.29 | 887.25 | 856.65 | 986.29 | 1,172.39 |
| 67 | 1,000.67 | 1,039.73 | 1,058.21 | 1,047.50 | 1,011.88 | 1,115.41 | 1,240.26 | 830.71 | 888.67 | 840.90 | 942.88 |
| 68 | 1,001.07 | 941.18 | 977.90 | 969.08 | 992.46 | 1,078.06 | 1,222.81 | 845.29 | 757.86 | 751.68 | 796.67 |
| 69 | 1,155.27 | 1,150.30 | 1,009.65 | 981.93 | 990.41 | 1,082.81 | 1,153.82 | 879.90 | 844.02 | 718.22 | 843.33 |
| SOURCE: OASDI public-use microdata file, 2004. | |||||||||||
| NOTE: Shading is used to emphasize differences by age group. | |||||||||||
| Age | 1994 | 1995 | 1996 | 1997 | 1998 | 1999 | 2000 | 2001 | 2002 | 2003 | 2004 |
|---|---|---|---|---|---|---|---|---|---|---|---|
| 62 | -20.942 | -24.2018 | -23.1928 | -19.2652 | -15.3388 | -4.106 | -2.0489 | 3.7583 | 10.8637 | 13.3432 | 7.7827 |
| 63 | -7.9977 | -5.0899 | -6.7459 | -5.5853 | -3.2251 | -2.7561 | 3.1105 | 3.8991 | 6.1921 | 9.6267 | 5.8529 |
| 64 | -2.7804 | -2.4186 | -0.6552 | -2.8275 | -3.0307 | -1.2372 | 0.2103 | 5.0466 | 6.1515 | 6.5032 | 7.8343 |
| 65 | a | 0.0343 | 0.1227 | 3.0688 | -0.6182 | 0.5818 | 7.4898 | 11.3957 | 19.3562 | 20.07 | 12.4059 |
| 66 | 2.5193 | -1.0137 | 1.7775 | -0.1488 | 2.2147 | 2.6307 | 9.5604 | -3.7035 | -5.077 | -1.6894 | 7.9571 |
| 67 | -1.2032 | -0.385 | 0.0076 | -0.261 | -1.2481 | 1.7761 | 7.6716 | -4.8227 | -2.9185 | -4.0269 | -1.8268 |
| 68 | -1.0134 | -1.9625 | -1.6702 | -1.8942 | -1.4107 | 0.482 | 5.1924 | -3.7229 | -5.8324 | -5.6851 | -4.9683 |
| 69 | 1.6174 | 1.6602 | -1.0627 | -1.3864 | -1.435 | 0.5483 | 2.5446 | -3.3092 | -4.1866 | -6.7483 | -3.5572 |
| SOURCE: OASDI public-use microdata file, 2004. | |||||||||||
| NOTE: The shaded cells represent significance at the 5 percent level or higher. Bold type is used to emphasize differences by age group. | |||||||||||
| a. The corresponding cell from Table A-1 is used as the comparison to test the equality of means with the rest of the cells in Table A-1. | |||||||||||
Notes
1 Notice, however, that with the sharply increasing earnings limit for those above the FRA starting in 1996, and the fact that the earnings test was eliminated for those aged 70–71 beginning in 1990, the change came in phases, even if the final removal was a policy item, the timing of which was not easy to foresee.
2 In fact, the analysis of claiming behavior and benefit receipt by cohorts, which because of the time span of the data could only be partially completed, provide the same qualitative results. We consider this evidence of the robustness of our results.
3 After age 70 there is little incentive to delay claiming benefits given that the DRC provision stops at that time, and therefore any individual claiming after age 70 would receive less in present value for any life expectancy or any length of life he or she might have or end up having.
4 Our presentation here attempts to be as clear and simple as possible and not necessarily comprehensive of all the possible details and exceptions to the general rules of the system. For an encyclopedic presentation of the rules of the system we refer the reader to Myers (1993) and also to the Social Security Web site at http:/www.socialsecurity.gov.
5 The exempt amount for the period between the month of benefit claiming and the year the person reaches the FRA was $13,560 in 2008: for every dollar earned above this limit the government withheld 50 cents of benefits. A higher exempt amount, $36,120, applies in the year of attaining FRA for months before such attainment. For the latter case the withholding rate is $1 for every $3 earned above this limit.
6 This is a very important characteristic of the earnings test provisions, and too often misunderstood or ignored both by researchers and experts. Benítez-Silva and Heiland (2007 and 2008) present a good discussion and analysis of this important feature. Leonesio (1990), Gustman and Steinmeier (1991), and Gruber and Orszag (2003) describe this feature, but do not study it in detail. For the most recent evidence of how widely misunderstood this feature is, we refer the reader to a recent article by Stan Hinden, which appears in the AARP's October 2007 Bulletin, p. 23. Most of the other research on the earnings test has focused on the taxation aspects; see Vroman (1985), Burtless and Moffitt (1985), Honig and Reimers (1989), Leonesio (1990), Reimers and Honig (1993 and 1996), Friedberg (1998 and 2000), Baker and Benjamin (1999), and Votruba (2003).
7 If none of these assumptions are correct, it could very well be, for example, that individuals who value the future very little (very much) find the current penalties for early retirement too high (or too low). Crawford and Lilien (1981) and Gustman and Steinmeier (1991) question the actuarial fairness of the system at the individual level, even if it has some bite at the aggregate level.
8 Queisser and Whitehouse (2006) review, with an applied approach, this and other related concepts using data from a number of Organisation for Economic Co-operation and Development countries. Breyer and Hupfeld (2007) provide a more theoretical discussion to understand the redistributive effects of early retirement provisions.
9 See Gustman and Steinmeier (1985) for an early discussion of the possible consequences of the 1983 reforms.
10 Only recently have researchers (Benítez-Silva and Heiland 2007 and 2008) emphasized the nearly actuarial fairness of the earnings test and have connected its fairly complex incentives with the early benefit claiming behavior of older Americans.
11 An alternative data source is the aggregate historical data from the Supplement, reported in Table 6.A4 of the 2008 edition and in similar tables in the historical editions of the document. In previous versions of this article, we also used this additional source of data and compared it with the public-use microdata we use here. The conclusions are similar, but provide an interesting comparison between an analysis using aggregate data and individual-level data. The aggregate data has some weaknesses, for example, the information for retired workers and dependents is not presented separately, and it is essentially impossible to make any statistical argument about the differences in benefit levels because we only have information about the mean of the distribution of benefits by age, but not about the standard deviation, preventing us from utilizing the data to make any inference about the statistical differences.
12 The MBR has variables that probably allow for this distinction, but the public-use files do not.
13 This selection bias is not present in the aggregate data using the Supplement because it reports yearly, not retrospective, data. It is natural to expect an upward bias in the retrospective adjusted benefit levels in the microdata, and this is what we conclude from comparing that data with the data in the Supplement. These results are available upon request.
14 Notice that all our empirical analysis takes the calendar year perspective, and not a birth cohort perspective. The main reason is a serious right censoring problem that is due to the time span of the data, which prevents us from following a large number of individuals in younger cohorts into older ages. Despite this problem, we construct our main tables of interest by cohort, and the results do not change appreciably. In particular, as with the by-year data, we can observe the drop in the proportion of individuals claiming benefits for the 1938 cohort and the decline in benefit receipt once the members of the cohort become eligible to claim benefits after 2000. These results are available from the authors upon request. Recent work by Muldoon and Kopcke (2008), who take the birth cohort perspective, also does not find major differences in claiming behavior.
15 Queisser and Whitehouse (2006) using 2002 mortality data find that the U.S. reduction for early retirement is not actuarially fair (it is too low) and too generous given current mortality figures, which results in a subsidy for early retirement and a penalty for late retirement. This in part explains the preference for early retirement expressed by Americans in the last decades, and also some of our results on benefit levels because higher-income individuals, likely to live longer, are the ones benefiting the most from this low reduction. The authors also find, based on the same mortality data, that the DRC is nearly actuarially fair.
16 Rust and Phelan (1997) show quite convincingly that the proportion of individuals claiming benefits at age 62 could be explained through explicitly modeling that some individuals are liquidity constrained. However, they were using data from the 1970s with a much lower claiming peak at age 62, and they restricted attention to individuals for whom Social Security was essentially their only source of income in retirement.
Peracchi and Welch (1994) cast some doubt over this explanation, unless it is possible to provide a justification for why the proportion of liquidity-constrained Americans would shift so much over time. This point is especially important given the large age-62 peak we have discussed, pointing in the direction of alternative explanations for the current developments in claiming behavior. Recently, the large current peak at age 62 has been replicated if beliefs regarding the future ability of the system to pay benefits are accounted for (Benítez-Silva and others 2009). Although it is widely stated that any reforms to the system will not affect those close to retirement age, it is also clearly stated by Social Security in their communication to future beneficiaries that some reforms will be necessary to maintain the sustainability of the system and that they are likely to result in lower benefits. In a recent New York Times article, May 12 2007, Laurence J. Kotlikoff argues in favor of late claiming of benefits by those that hold relatively large private pension assets. This is also defended by the same researcher along with others in a recent U.S. News and World Report article, February 11, 2008.
17 Notice (and this is true in all the tables) that a given individual only appears in one of the cells identified by age and year, and that corresponds to the first time they apply for benefits.
18 In principle, we cannot rule out possible period effects resulting from at least two aspects. First, the focal point of the year 2000 as the arrival of the new millennium could have lead some individuals to postpone their retirement (claiming of benefits) until this milestone date. Second, the new decade came with the burst of the technology bubble and a slowdown in job growth after the robust growth of the late 1990s; this change in trend could have prompted some individuals consider retirement as their expectations of future income growth became less optimistic.
19 See also Gustman and Steinmeier (2004), Song (2004), and French (2005) for discussions of the likely consequences of the removal of the earnings test.
20 We thank an anonymous referee for making this point to us.
21 To truly compare these benefit levels we have to take into account the adjustments to their PIA so that the dollar amounts by column and rows are in the same actuarial units. The idea is that although a person who claims at age 62 will mechanically have a lower monthly benefit than a person who claims at age 65 yet has the same earnings history, the early claimer receives 3 more years of benefits and therefore is in present value at the actuarial adjustment factor, and assuming that they will live to the same age, their benefit levels are actuarially equivalent.
22 This means that if individuals were randomly assigned to claiming at a given age between say age 62 and age 70, and without the existence of any policy changes in this period, the benefit levels (on average) in a given year for the different ages should be identical, and the differences over time could only be explained by time effects (macro effects but not related to Social Security reforms) or cohort effects.
23 These tables show the actual PIAs for the same group of individuals as shown in Table 3, and therefore both sets of numbers can be directly compared. It is clear that our approximation is quite close to the PIA of record, and the differences can be traced back, as explained earlier, to the timing of claiming we have assumed and the role of the earnings test. Notice, that the main results of our analysis are essentially unchanged.
24 More recently Haveman and others (2006) analyze whether early retirees will be able to maintain their well-being during retirement. Given the data they use, little is discussed regarding level of benefits, and they do not compare early claimers with those that delay claiming benefits.
25 It is still true, however, that especially for long-lived early retirees and their survivors and low-income early retirees, the reduction can have real welfare consequences, even if for the average individual they are not of first order importance.
26 The fact that the proportion of individuals claiming benefits changed considerably in the year that the earnings test was eliminated for those above the FRA and that the composition of claimers in the post-2000 period seemed to have significantly changed for those claiming after age 65 is however a bit puzzling in light of the discussion of Benítez-Silva and Heiland (2008), where the authors clearly show that the real incentives of the earnings test are very close to being actuarially fair given the adjustment of benefits at the FRA if benefits were withheld. These large shifts suggest, as discussed by Benítez-Silva and Heiland (2007), a likely lack of knowledge about this important aspect of the earnings test provision. Those authors estimate that only around 40 percent of individuals are aware of this aspect of the rules that govern the earnings test. In recent work using telephone surveys on individuals' knowledge of the Social Security retirement system Benítez-Silva, Demiralp, and Liu (2009) show that a majority of Americans do not seem to be aware of even some of the basic features of the system.
27 This group can also potentially include individuals who do not need the benefit yet for a variety of reasons (access to private pensions or other sources of income) and consider the DRC a fair rate of return. Notice that additional work can lead to a recomputation of benefits, which can only be an advantage to individuals regardless of their economic circumstances.
28 Unfortunately, the public-use microdata file does not provide any additional characteristics of individuals.
References
Baker, Michael, and Dwayne Benjamin. 1999. How do retirement tests affect the labour supply of older men? Journal of Public Economics 71(1): 27–51.
Benítez-Silva, Hugo, and Debra S. Dwyer. 2006. Expectation formation of older married couples and the rational expectations hypothesis. Labour Economics 13(2): 191–218.
Benítez-Silva, Hugo, Debra S. Dwyer, Frank Heiland, and Warren C. Sanderson. 2009. Retirement and Social Security reform expectations: A solution to the new early retirement puzzle. Forthcoming.
Benítez-Silva, Hugo, and Frank Heiland. 2007. The Social Security earnings test and work incentives. Journal of Policy Analysis and Management 26(3): 527–555.
———. 2008. Early claiming of Social Security benefits and labor supply behavior of older Americans. Applied Economics 40(23): 2969–2985.
Benítez-Silva, Hugo, Berna Demiralp, and Zhen Liu. 2009. Social Security knowledge and retirement well-being. Unpublished manuscript, SUNY at Stony Brook, SUNY at Buffalo, and Old Dominion University, respectively.
Blau, David. 1997. Social Security and the labor supply of older married couples. Labour Economics 4(4): 373–418.
———. 1998. Labor force dynamics of older married couples. Journal of Labor Economics 16(3): 595–629.
Blundell, Richard, Pierre A. Chiappori, Thierry Magnac, and Costas Meghir. 2001. Collective labor supply: Heterogeneity and nonparticipation. IFS Working Paper Series 01/19.
Board of Trustees of the Federal Old-Age and Survivors Insurance and Federal Disability Insurance Trust Funds. 2009. The 2009 Annual Report of the Board of Trustees of the Federal Old-Age and Survivors Insurance and Federal Disability Insurance Trust Funds Washington, DC: Government Printing Office.
Breyer, Friedrich, and Stefan Hupfeld. 2007. On the fairness of early retirement provisions. CESifo Working Paper No. 2078. Munich, Germany: CESifo GmbH.
Burkhauser, Richard V., Kenneth A. Couch, and John W. Phillips.1996. Who takes early Social Security benefits? The economic and health characteristics of early beneficiaries. The Gerontologist 36(6): 789–799.
Burtless, Gary, and Robert A. Moffitt. 1985. The joint choice of retirement age and post-retirement hours of work. Journal of Labor Economics 3(2): 209–236.
Coile, Courtney, Peter Diamond, Jonathan Gruber, and Alain Jousten. 2002. Delays in claiming Social Security benefits. Journal of Public Economics 84(3): 357–385.
Crawford, Vincent P., and David M. Lilien. 1981. Social Security and the retirement decision. The Quarterly Journal of Economics 96(3): 505–529.
French, Eric. 2005. The effects of health, wealth, and wages on labour supply and retirement behaviour. Review of Economic Studies 72(2): 395–427.
Friedberg, Leora. 1998. The Social Security earnings test and labor supply of older men. In Tax policy and the economy, Vol. 12, James M. Poterba, ed., 121–150. Cambridge, MA: The MIT Press in NBER Book Series Tax Policy and the Economy.
———. 2000. The labor supply effects of the Social Security earnings test. Review of Economics and Statistics 82(1): 48–63.
Gruber, Jonathan, and Peter Orszag. 2003. Does the Social Security earnings test affect labor supply and benefits receipt? National Tax Journal 56(4): 755–773.
Gustman, Alan L., and Thomas L. Steinmeier. 1985. Social Security reform and labor supply. NBER Working Paper No. 1212. Cambridge, MA: National Bureau of Economic Research.
———. 1991. Changing the Social Security rules for work after 65. Industrial and Labor Relations Review 44(4): 733–745.
———. 2002. The Social Security early retirement age in a structural model of retirement and wealth. NBER Working Paper No. 9183. Cambridge, MA: National Bureau of Economic Research.
———. 2004. The Social Security retirement earnings test, retirement and benefit claiming. Michigan Retirement Research Center Working Paper No. 2004-090. Ann Arbor, MI: MRRC.
Haveman, Robert, Karen Holden, Barbara Wolfe, and Shane Sherlund. 2006. Do newly retired workers in the United States have sufficient resources to maintain well-being? Economic Inquiry 44(2): 249–264.
Honig, Marjorie, and Cordelia Reimers. 1989. Is it worth eliminating the retirement test? American Economic Review 79(2): 103–107.
Leonesio, Michael V. 1990. Effects of the Social Security earnings test on the labor market activity of older Americans: A review of the evidence. Social Security Bulletin 53(5): 2–21.
Leonesio, Michael V., Denton R. Vaughan, and Bernard Wixon. 2000. Early retirees under Social Security: Health status and economic resources. ORES Working Paper Series No. 86. Social Security Administration, Office of Policy, Office of Research, Evaluation, and Statistics.
Mitchell, Olivia S., and John W. R. Phillips. 2000. Retirement responses to early Social Security benefit calculations. NBER Working Paper No. 7963. Cambridge, MA: National Bureau of Economic Research.
Muldoon, Dan, and Richard W. Kopcke. 2008. Are people claiming Social Security benefits later? Issue in Brief No. ib2008-8-7. Chestnut Hill, MA: Center for Retirement Research at Boston College.
Myers, Robert J. 1993. Social Security (4th Edition). Philadelphia, PA: Pension Research Council, University of Pennsylvania Press.
Peracchi, Franco, and Finis Welch. 1994. Trends in labor force transitions of older men and women. Journal of Labor Economics 12(2): 210–242.
Queisser, Monika, and Edward Whitehouse. 2006. Neutral or fair? Actuarial concepts and pension-system design. OECD Social, Employment and Migration Working Papers, No. 40. Paris, France: Organisation for Economic Co-operation and Development.
Quinn, Joseph F. 1987. The economic status of the elderly: Beware of the mean. Review of Income and Wealth 33(1): 63–82.
Reimers, Cordelia, and Marjorie Honig. 1993. The perceived budget constraint under Social Security: Evidence from reentry behavior. Journal of Labor Economics 11(1): 184–204.
———. 1996. Responses to Social Security by men and women: Myopic and far-sighted behavior. Journal of Human Resources 31(2): 359–382.
Rust, John, and Christopher Phelan. 1997. How Social Security and Medicare affect retirement behavior in a world of incomplete markets. Econometrica 65(4): 781–831.
Smith, Ralph. 1999. Raising the earliest eligibility age for Social Security benefits. CBO Paper. Washington, DC: Congressional Budget Office (January).
Song, Jay G. 2004. Evaluating the initial impact of eliminating the retirement earnings test. Social Security Bulletin 65(1): 1–15.
Song, Jay G., and Joyce Manchester. 2007a. New evidence on earnings and benefit claims following changes in the retirement earnings test in 2000. Journal of Public Economics 91(3–4): 669–700 (April).
———. 2007b. How have people responded to changes in the retirement earnings test in 2000? Social Security Bulletin 67(1): 1–15.
———. 2007c. Have people delayed claiming retirement benefits? Responses to changes in Social Security rules. Social Security Bulletin 67(2): 1–23.
[SSA] Social Security Administration. 1995–2008. Annual Statistical Supplement to the Social Security Bulletin. Washington, DC: Office of Policy, Office of Research, Evaluation, and Statistics.
———. 2007. OASDI Monthly Statistics. Washington, DC: Office of Policy, Office of Research, Evaluation, and Statistics, Division of RSDI Statistics and Analysis.
Votruba, Mark E. 2003. Social Security and retirees' decision to work. Unpublished manuscript, Case Western Reserve University, Department of Economics, Weatherhead School of Management.
Vroman, Wayne. 1985. Some economic effects of the retirement test. In Research in Labor Economics, Vol. 7, Ronald Ehrenberg, ed., 31–89. Greenwich, CT: JAI Press, Inc.