Adult OASDI Beneficiaries and SSI Recipients Who Need Representative Payees: Projections for 2025 and 2035
Social Security Bulletin, Vol. 75, No. 2, 2015 (released May 2015)
For Social Security beneficiaries and Supplemental Security Income recipients who are not capable of managing their own benefit payments, the Social Security Administration (SSA) pays benefits to a representative payee. We estimate that the demand for representative payees will increase from 2.94 million beneficiaries in 2013 to 3.27 million by 2025 and to 3.56 million by 2035. Growth in the number of retired-worker beneficiaries by 2025, and the transition of the baby boom generation into the 85-or-older age category by 2035, account for much of the increased demand for representative payees. Although 71.1 percent of disabled-worker beneficiaries who need a payee have a family member serving in that role, only 57.3 percent of retired-worker beneficiaries do. SSA should be prepared to recruit payees in numbers sufficient to meet the future demand, and to devote the resources necessary to monitor payees and prevent their misuse of benefits.
Chris Anguelov is with the Division of Policy Evaluation, Office of Research, Evaluation, and Statistics, Office of Retirement and Disability Policy (ORDP), Social Security Administration (SSA). Gabriella Ravida is with the Office of Income Security Programs, Office of Payment and Claimant Representative Policy, ORDP, SSA. Robert Weathers is with the Office of the Chief Actuary, SSA.
Acknowledgments: We thank Tiffany Bosley, Irena Dushi, Bert Kestenbaum, and Mark Sarney for their thoughtful comments on an earlier version of this article; we are also grateful to Angela Harper, Chris Motsiopoulos, Clark Pickett, and Mark Sarney for providing the data we used.
Contents of this publication are not copyrighted; any items may be reprinted, but citation of the Social Security Bulletin as the source is requested. The findings and conclusions presented in the Bulletin are those of the authors and do not necessarily represent the views of the Social Security Administration.
Introduction
| GAO | Government Accountability Office |
| MINT | Modeling Income in the Near Term |
| OASDI | Old-Age, Survivors, and Disability Insurance |
| SSA | Social Security Administration |
| SSI | Supplemental Security Income |
The Social Security Administration (SSA) sends monthly cash payments to people who qualify for benefits under the Old-Age, Survivors, and Disability Insurance (OASDI) program and to those who qualify for payments under the Supplemental Security Income (SSI) program. Some people who qualify for monthly payments under these programs have a health condition that prevents them from managing their benefit payments. When a program participant is deemed incapable of managing his or her own monthly benefit, SSA sends the payment to a representative payee—a person or organization designated by SSA to act on the beneficiary's behalf.
Over the next two decades, the number of people receiving benefits from the OASDI and SSI programs will increase because of demographic factors such as the aging of the baby boom generation. The increase in the number of program participants will most likely lead to an increase in the need for representative payees. Although many beneficiaries will have a family member who can serve as a payee, others will not, and SSA will need to find suitable representative payees for them. Expressing concern that SSA has not adequately planned for the increasing numbers of program participants who will need a representative payee, the Government Accountability Office (GAO, 2013) recommended that SSA estimate the long-term increase in the number of individuals who will need a payee, their demographic characteristics, and the resources that will be needed to meet the increased demand. We address that recommendation by projecting the number and demographic characteristics of beneficiaries who will need a payee. These findings provide the foundation for a strategic plan to administer the representative payee program effectively in the future.
We use administrative data from SSA and program participation projections from Modeling Income in the Near Term (MINT) to estimate the increase in the number of adult OASDI beneficiaries and SSI recipients who will need a representative payee. We study beneficiaries aged 18 or older who are not receiving benefits as disabled adult children or as students aged 18–19. We focus on this group because minor children, disabled adult children, and students aged 18–19 generally have a parent or other family member serving as their payee. To develop our projections, we disaggregate program participants into groups categorized by beneficiary type and age. For each disaggregated group, we compute the proportion of participants with a representative payee and the distribution by type of payee. We then apply the group proportions and the distributions by payee type to the MINT program participation projections for 2025 and 2035. The disaggregated numbers allow us to account for changing distributions by age and type of beneficiary over time, and the results allow SSA to develop plans to target outreach efforts.
We estimate that the number of adult OASDI and SSI program participants who meet our study criteria and need a representative payee will increase from 2,941,037 as of December 2013 to 3,265,577 in 2025 and 3,558,915 in 2035. For beneficiaries whose representative payee is not a family member, we project an increase from 887,086 as of December 2013 to 1,008,175 in 2025 and 1,123,394 in 2035. The model projects that the increases between 2013 and 2025 are due primarily to greater numbers of retired-worker beneficiaries, and that the increases between 2025 and 2035 are due primarily to greater proportions of retired-worker beneficiaries who will be aged 85 or older. The projected growth in payee demand is relatively modest for disabled-worker beneficiaries. By 2035, the gap between the numbers of retired-worker beneficiaries and disabled-worker beneficiaries who need payees is projected to close. We conclude that SSA may need to (1) increase the number of payees to serve the growing demand from retired-worker beneficiaries; (2) bolster monitoring efforts to ensure that payees do not misuse benefits; and (3) provide training to payees to reduce the incidence of elder abuse and financial exploitation.
Our estimates are subject to uncertainty because we assume that the December 2013 proportion of program participants who need a payee (and the distribution by type of payee) will remain the same in 2025 and 2035. However, competing hypotheses about future morbidity patterns support divergent alternative predictions of demand for representative payees (Ailshire, Beltran-Sanchez, and Crimmins 2015). One of these, the expansion-of-morbidity hypothesis, posits that improvements in life expectancy are associated with more years in poor health (Olshansky and others 1991). The logical corollary is that the need for representative payees will increase because greater numbers of long-term survivors are more likely to experience health declines and lose the capacity to manage their finances. Salomon and others (2012) provide recent evidence supporting the expansion-of-morbidity hypothesis. A competing hypothesis posits a compression of morbidity and predicts that substantial improvements in healthy behaviors and functioning will reduce years in poor health (Fries 2005), with the corollary that a smaller proportion of beneficiaries will need a representative payee. Recent research provides some evidence supporting the compression-of-morbidity hypothesis in the United States (Cutler, Ghosh, and Landrum 2014). We acknowledge these hypotheses, yet we believe our assumption that 2013 distributions will not change dramatically by 2035 is reasonable for strategic planning purposes. Nevertheless, we will monitor changes in the demand for representative payees by payee type over time and adjust our estimates as needed.
OASDI, SSI, and Representative Payees
OASDI is a social insurance program that pays monthly benefits to qualified retired and disabled workers and their dependents or survivors. A worker's payroll tax contributions and earnings determine eligibility and benefit amounts. Additional eligibility factors are age (for retired-worker and dependent benefits) and disability (for disabled-worker benefits). SSI is a means-tested program that guarantees a minimum level of income for needy aged, blind, or disabled individuals. Applicants must meet income and resource requirements to qualify for SSI payments, and those younger than 65 must additionally meet SSA's definition of disability. In December 2013, 54,805,000 people received benefits from only the OASDI program, 5,593,000 received payments from only the SSI program, and 2,771,000 received both OASDI benefits and SSI payments (SSA 2014b).
In such a large and diverse population of beneficiaries, not all recipients are capable of managing their own benefits. Therefore, the 1939 Amendments to the Social Security Act authorized SSA to appoint individuals or organizations to serve as representative payees on behalf of beneficiaries who cannot manage their own finances. By 2013, SSA cooperated with over 5.9 million payees handling $74 billion in annual benefits for over 8 million beneficiaries (SSA 2014a).
SSA determines whether an OASDI beneficiary or SSI recipient needs a representative payee case by case. If SSA determines that a beneficiary is not capable of managing his or her benefits, or of directing someone else to manage them, SSA will select a suitable representative payee for that beneficiary. The determination is straightforward in some instances; for example, SSA assigns a representative payee to all beneficiaries aged younger than 15 and to adult beneficiaries declared by a court to be not legally competent. Payees must ensure that beneficiaries have all essentials of living, such as food, clothing, shelter, utilities, dental and medical care, and personal comfort items. Payees are also responsible for putting all unused funds into a savings account for the beneficiary.
Either individuals or organizations can serve as payees. Individual payees are not financially compensated for their duties; however, eligible organizational payees can charge a service fee after SSA grants written approval.1 Organizational payees can include local or state mental institutions, nursing homes, nonprofit community-based organizations, or fee-for-service organizations.
Selecting Payees
SSA strives to choose payees with the utmost concern for beneficiaries. Overall, 79 percent of payees are members of the beneficiary's family, most commonly a parent or spouse. However, regardless of the relationship, all payees must apply and be approved to represent beneficiaries.
To select payees, SSA reviews applications, interviews applicants, and assesses applicants' ability to serve as payees. If more information about applicants is necessary, the agency looks to third-party sources before making a selection. In 2012, in an attempt to further assure the selection of proper payees, SSA implemented a pilot program to bar individual payee applicants with certain felony records.2 The agency formally adopted the criminal bar policy nationwide in February 2014. In 2013, SSA introduced an online tool known as “PayeeWiz,” which provides field offices with criminal history information about applicants through the LexisNexis Accurint database. In this way, field offices can use third-party data to supplement applicant self-reporting when applying the criminal bar policy to prevent wrongful payee selection.3
Monitoring Payees
After payees are appointed, SSA monitors them to ensure that they fulfill their responsibilities to the beneficiary. Monitoring includes on-site reviews conducted every 3–4 years (depending on the type of payee), reviews of annual accounting forms that track how payees spent benefit payments, and interviews with both payees and beneficiaries. If monitoring detects the misuse of funds or inadequate representation, SSA either reeducates payees on their duties and responsibilities or removes them. Before removing a payee, SSA thoroughly investigates the case to ascertain the best option for the beneficiary.
Challenges Administering the Program
Congress and other observers have expressed concerns that the representative payee program, as currently structured, may be difficult for SSA to administer effectively in the future (GAO 2013, 1). GAO recommended that SSA estimate the long-term increase in the number of individuals who will need a payee as well as their demographic characteristics. We develop a methodology to project the need for representative payees in 2025 and 2035 and use data from SSA records and projections from MINT to produce our estimates.
Methodology and Data
Our methodology accounts for differences in the prevalence of beneficiaries who have representative payees by beneficiary type (OASDI retired worker, spouse, nondisabled widow(er), disabled worker, or disabled widow(er); and SSI) and age group. For example, we compute the percentage of retired-worker beneficiaries with a payee in each of four age groups: younger than 65, 65–74, 75–84, and 85 or older. We apply those percentages to population projections for each age category within each program to estimate the number within the category who will need a payee in 2025 and in 2035. Finally, we compute the sum of the age-group estimates in each program to obtain a programwide estimate of the need for a payee, and then compute the sum of the programwide estimates to estimate the number of those who will need a payee overall. The equation below provides the mathematical representation of our estimate.
where Pt is our projection for year t, i represents one of J types of beneficiaries, n represents one of N age categories, pi,n,2013 is the 2013 percentage of beneficiaries who have a payee for age category n within program i, and Popi,n,t is the population projection for age category n within program i in year t (2025, 2035).
Accounting for differences in the percentage of beneficiaries who need a representative payee across programs and age categories is important. As baby boomers reach retirement age, the projected growth in the number of retired-worker beneficiaries is substantially larger than that of disabled-worker, survivor, and spousal beneficiaries. Because the use of representative payees is less prevalent among retired-worker beneficiaries than it is among disabled-worker beneficiaries, our approach will provide a more appropriate estimate than simply multiplying the overall prevalence in 2013 by the beneficiary population projections for 2025 and 2035 would. Similarly, although the growth in the number of retired workers will decrease between 2025 and 2035, the growth in the number of beneficiaries who need a representative payee is projected to increase, as greater numbers of baby boomers enter the 85-or-older age category. Because the need for a representative payee is more prevalent among beneficiaries aged 85 or older, our method will likewise provide a more appropriate estimate of the need for a payee than would simply multiplying the prevalence of payee need by the projected beneficiary populations for each program. Regardless of how they are calculated, the projected overall prevalences will differ from the 2013 overall prevalence because of changing demographic patterns.
We use administrative data from SSA's Master Beneficiary Record and Supplemental Security Record to calculate 2013 program participant counts and the proportions of participants with representative payees. We use these data to compute pi,n,2013. The numbers for the OASDI program match the numbers shown in Table 5.L1 of the Annual Statistical Supplement to the Social Security Bulletin, 2014. To avoid double-counting OASDI beneficiaries who also collect SSI payments, we restrict our SSI population to recipients who do not concurrently collect OASDI benefits.
Administrative data from SSA are limited in that they identify only the representative payees that the agency formally recognizes. However, in SSA (2010), the agency's Office of the Inspector General (OIG) identified some beneficiaries aged 85 or older who received help managing their finances without having a formally designated representative payee. In the vast majority of those cases, the OIG determined that a family member was providing that help to the beneficiary. Therefore, holding other factors constant, our estimates will understate the true number of beneficiaries who receive help managing their finances. However, because almost all of the beneficiaries identified by the OIG received informal help from a family member, our estimates of beneficiaries aged 85 or older with a nonfamily representative payee should not be affected by that limitation in the administrative data.
We generate the 2025 and 2035 estimates of OASDI beneficiaries using Version 6 of SSA's MINT model. MINT6 provides a complete set of demographic and economic projections for all individuals born from 1926 through 2070, carried forward until death or 2099 (Smith and others 2010). MINT uses data from the 2001 and 2004 Surveys of Income and Program Participation (SIPP), administrative files current as of 2009,4 and assumptions from The 2009 Annual Report of the Board of Trustees of the Federal Old-Age and Survivors Insurance and Federal Disability Insurance Trust Funds. MINT does not provide any information on children.
Results and Analysis
In this section, we discuss the use of representative payees as of December 2013 and the projected demand for payees in 2025 and 2035. For all three years, we present data on the distribution of payee demand by beneficiary type and age group, with detail for nonfamily payees. For 2013, we also present the percentage distributions of beneficiaries with payees, by type of payee. Although projections by detailed type of payee are not discussed in this section, tables showing the projected counts (rather than the percentage distributions) by type of payee appear in the Appendix.
In 2013, 42.7 percent of the payees who served retired-worker beneficiaries were nonfamily members, compared with only 28.9 percent for disabled-worker beneficiaries. The projected growth in the number of retired-worker beneficiaries, combined with their greater proportional need for nonfamily payees, indicates that SSA may need to prepare to recruit, screen, train, and monitor additional payees to serve those beneficiaries.
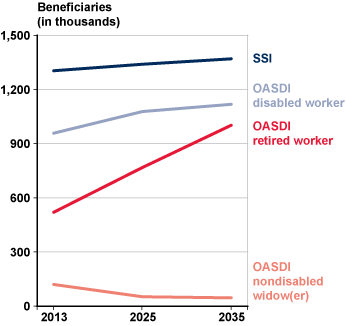
Chart 1 broadly summarizes the projected demand for representative payees among the four most populous beneficiary-type groups. Although the number of disabled-worker beneficiaries who need a payee will grow, it will do so much more slowly than that of retired-worker beneficiaries; in fact, as a proportion of all adult OASDI beneficiaries with a representative payee, disabled workers will decline (Chart 2). Interestingly, the number of nondisabled widow(er) beneficiaries needing a representative payee will decline in the future because increasing numbers of women will have entered the workforce and attained insured status during their working years and thus will receive retired-worker benefits on their own employment record. Chart 3 tracks the changing age distribution of retired-worker beneficiaries who will need a representative payee. Taken together, Charts 1–3 illustrate how the growth in the need for representative payees will be driven primarily by the increase in the numbers of (1) retired-worker beneficiaries as of 2025 because of the aging of baby boomers and (2) baby boomers who will have reached age 85 by 2035.
Number of adult OASDI beneficiaries and SSI recipients with representative payees, by selected beneficiary type: 2013 and projected 2025 and 2035
| Beneficiary type | 2013 | 2025 | 2035 |
|---|---|---|---|
| SSI | 1,305 | 1,340 | 1,369 |
| OASDI disabled worker | 957 | 1,078 | 1,118 |
| OASDI retired worker | 520 | 768 | 1,002 |
| OASDI nondisabled widow(er) | 121 | 53 | 45 |
Retired-worker, nondisabled widow(er), and disabled-worker beneficiaries as percentages of all adult OASDI beneficiaries with a representative payee: 2013 and projected 2025 and 2035
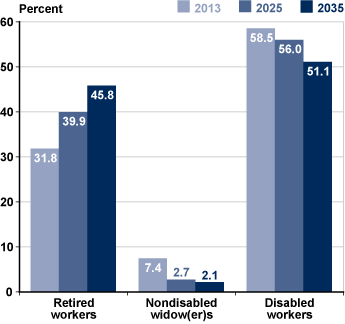
| Beneficiary type | 2013 | 2025 | 2035 |
|---|---|---|---|
| Retired workers | 31.8 | 39.9 | 45.8 |
| Nondisabled widow(er)s | 7.4 | 2.7 | 2.1 |
| Disabled workers | 58.5 | 56.0 | 51.1 |
Retired-worker beneficiaries in each of four age groups as percentages of all adult OASDI beneficiaries with a representative payee: 2013 and projected 2025 and 2035
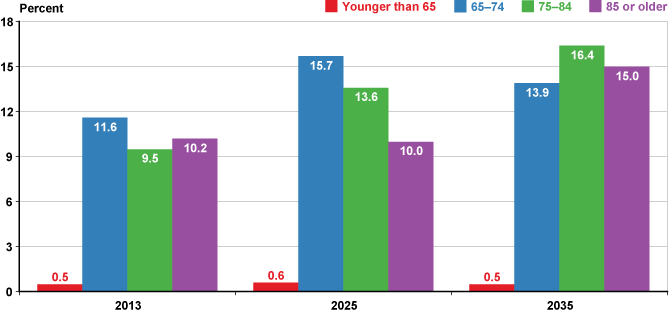
| Age group | 2013 | 2025 | 2035 |
|---|---|---|---|
| Younger than 65 | 0.5 | 0.6 | 0.5 |
| 65–74 | 11.6 | 15.7 | 13.9 |
| 75–84 | 9.5 | 13.6 | 16.4 |
| 85 or older | 10.2 | 10.0 | 15.0 |
Use of Representative Payees in 2013
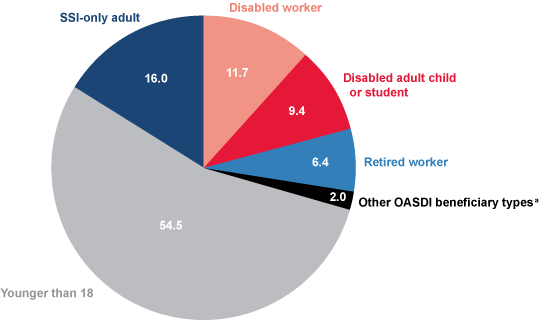
In December 2013, about 8.2 million of the 63.2 million OASDI beneficiaries and SSI recipients had a representative payee.5 More than half of those 8.2 million individuals were younger than 18 (Chart 4). Because the representative payee was a custodial parent, grandparent, or other relative in over 98 percent of those cases, we exclude child beneficiaries and recipients from our analysis. Among the remaining 3.7 million beneficiaries with a representative payee, 769,403 were disabled adult children or students aged 18–19. We also exclude those groups from our analysis, and for a similar reason: For the vast majority, their parents served as the representative payee. Thus, the group we study consists of adults (aged 18 or older) other than disabled adult children and students aged 18–19. Among the group of adult OASDI beneficiaries and SSI recipients we study, about 2.9 million (or 5.1 percent) had a representative payee.
Percentage distribution of all individuals with a representative payee (comprising adult OASDI beneficiaries, by type; adult SSI recipients; and children, regardless of program), 2013
In 2013, 1,636,106 (or 3.1 percent) of adult OASDI beneficiaries had a representative payee (Table 1). Within that group, 957,040 beneficiaries were disabled workers (58.5 percent), followed by 519,780 retired workers (31.8 percent) and 120,565 nondisabled widow(er)s (7.4 percent). The most prevalent types of representative payees for retired-worker beneficiaries were nonmental institutions such as nursing homes (29.6 percent), children (27.1 percent), relatives other than a parent or spouse or child (15.2 percent), and spouses (14.1 percent). For nondisabled widow(er) beneficiaries, representative payees were most often the beneficiary's child (44.4 percent), a nonmental institution (33.6 percent), or a relative outside the immediate family (12.0 percent). The most prevalent types of representative payees for disabled workers were parents (29.8 percent), relatives outside the immediate family (19.0 percent), spouses (16.6 percent), and “other” (9.9 percent). According to SSA records, the “other” representative payee category comprises 10 subcategories, of which the three most common are friends of the beneficiary or of the beneficiary's family, significant others or former spouses, and guardians.
| Beneficiary type and age | Total | With representative payee | Type of representative payee (percentage distribution) | ||||||||||
|---|---|---|---|---|---|---|---|---|---|---|---|---|---|
| Number | Percent | Parent a | Spouse | Child a | Other relative | Nonmental institution | Mental institution | Social agency | Public official | Financial organization | Other | ||
| All adult beneficiaries | 53,565,990 | 1,636,106 | 3.1 | 17.9 | 14.6 | 16.1 | 17.2 | 17.1 | 2.5 | 4.8 | 0.9 | 0.5 | 8.4 |
| Retired worker | 37,892,659 | 519,780 | 1.4 | 0.9 | 14.1 | 27.1 | 15.2 | 29.6 | 1.5 | 3.3 | 1.2 | 0.4 | 6.7 |
| Younger than 65 | 3,167,203 | 7,715 | 0.2 | 3.3 | 13.5 | 15.0 | 27.7 | 18.6 | 2.3 | 5.4 | 1.4 | 0.4 | 12.4 |
| 65–74 | 19,824,033 | 189,509 | 1.0 | 1.3 | 24.0 | 17.3 | 18.5 | 22.5 | 2.2 | 4.6 | 1.2 | 0.4 | 7.9 |
| 75–84 | 10,625,868 | 154,927 | 1.5 | 0.6 | 13.2 | 28.2 | 12.8 | 32.9 | 1.3 | 3.1 | 1.4 | 0.4 | 6.2 |
| 85 or older | 4,275,555 | 167,629 | 3.9 | 0.7 | 3.7 | 37.6 | 13.2 | 35.2 | 0.8 | 1.8 | 1.1 | 0.4 | 5.5 |
| Spouse | 2,442,308 | 23,620 | 1.0 | 1.4 | 28.8 | 34.0 | 10.5 | 17.1 | 1.1 | 2.3 | 0.8 | 0.2 | 3.8 |
| Younger than 65 | 311,349 | 2,513 | 0.8 | 5.5 | 48.4 | 20.3 | 12.1 | 4.9 | 1.1 | 2.6 | 0.6 | 0.3 | 4.1 |
| 65–74 | 1,251,166 | 9,965 | 0.8 | 0.8 | 29.6 | 31.3 | 11.4 | 16.3 | 1.6 | 3.3 | 1.0 | 0.2 | 4.5 |
| 75–84 | 714,235 | 7,693 | 1.1 | 0.9 | 25.1 | 36.8 | 9.3 | 21.4 | 0.9 | 1.5 | 0.7 | 0.2 | 3.2 |
| 85 or older | 165,558 | 3,449 | 2.1 | 1.3 | 20.2 | 45.6 | 9.3 | 18.9 | 0.3 | 0.8 | 0.5 | 0.1 | 3.0 |
| Nondisabled widow(er) | 4,032,825 | 120,565 | 3.0 | 1.1 | 0.2 | 44.4 | 12.0 | 33.6 | 1.0 | 2.1 | 1.0 | 0.3 | 4.5 |
| Younger than 65 | 584,424 | 2,455 | 0.4 | 10.0 | 0.2 | 41.8 | 24.3 | 10.1 | 1.4 | 3.6 | 0.9 | 0.3 | 7.2 |
| 65–74 | 1,175,655 | 18,282 | 1.6 | 0.9 | 0.3 | 40.5 | 16.0 | 28.1 | 1.7 | 4.4 | 1.3 | 0.3 | 6.5 |
| 75–84 | 1,198,541 | 36,353 | 3.0 | 0.8 | 0.2 | 43.0 | 10.8 | 35.6 | 1.1 | 2.4 | 1.2 | 0.3 | 4.6 |
| 85 or older | 1,074,205 | 63,475 | 5.9 | 0.9 | 0.1 | 46.4 | 11.0 | 34.9 | 0.7 | 1.3 | 0.7 | 0.2 | 3.8 |
| Disabled worker | 8,940,950 | 957,040 | 10.7 | 29.8 | 16.6 | 5.7 | 19.0 | 8.3 | 3.3 | 6.0 | 0.8 | 0.5 | 9.9 |
| 25–34 | 510,785 | 156,864 | 30.7 | 64.6 | 4.4 | 0.1 | 11.4 | 3.8 | 2.5 | 4.8 | 0.5 | 0.4 | 7.6 |
| 35–44 | 1,030,662 | 181,778 | 17.6 | 47.5 | 11.5 | 1.1 | 13.7 | 5.7 | 3.3 | 6.1 | 0.6 | 0.5 | 10.0 |
| 45–54 | 2,462,661 | 277,363 | 11.3 | 25.2 | 17.2 | 5.3 | 20.9 | 8.1 | 3.7 | 6.8 | 0.8 | 0.6 | 11.4 |
| 55–FRA | 4,936,842 | 341,035 | 6.9 | 8.1 | 24.4 | 11.2 | 23.8 | 12.0 | 3.3 | 5.8 | 1.0 | 0.5 | 9.9 |
| Disabled widow(er) | 257,248 | 15,101 | 5.9 | 5.1 | 0.5 | 36.4 | 25.6 | 12.5 | 2.1 | 5.4 | 1.0 | 0.4 | 10.8 |
| Younger than 55 | 34,444 | 2,180 | 6.3 | 11.0 | 0.4 | 30.4 | 29.5 | 5.1 | 2.2 | 5.9 | 0.6 | 0.4 | 14.6 |
| 55–FRA | 222,804 | 12,921 | 5.8 | 4.1 | 0.6 | 37.5 | 25.0 | 13.8 | 2.1 | 5.3 | 1.0 | 0.4 | 10.2 |
| SOURCE: Authors' calculations using SSA records. | |||||||||||||
| NOTES: Rounded components of percentage distributions do not necessarily sum to 100.0.
FRA = full retirement age.
|
|||||||||||||
| a. Natural, adoptive, or stepparent/stepchild. | |||||||||||||
Among adult recipients of SSI payments only, 29.9 percent had a representative payee (Table 2). The age distribution for this population was 91.9 percent aged 18–64, 4.0 percent aged 65–74, and 4.1 percent aged 75 or older (not shown). Overall, the most prevalent types of representative payees were parents (47.3 percent); other relatives, which in this context combines all relatives outside immediate family members and grandparents (16.2 percent); and “other” payees (8.5 percent). However, when focusing on retirement-age recipients (65 or older), we see a shift in the most prevalent types of payees. For recipients aged 65–74, the most prevalent types were other relatives (25.5 percent), children (25.1 percent), and nonmental institutions (19.5 percent). For recipients aged 75 or older, the proportion of representative payees who were the recipient's child spiked to 46.0 percent, followed by other relatives (22.5 percent) and nonmental institutions (16.6 percent).
| Recipient age | Total | With representative payee | Type of representative payee (percentage distribution) | |||||||||||
|---|---|---|---|---|---|---|---|---|---|---|---|---|---|---|
| Number | Percent | Parent a | Spouse | Child a | Grandparent | Other relative | Nonmental institution | Mental institution | Social agency | Public official | Financial organization | Other | ||
| All adult recipients | 4,370,138 | 1,304,931 | 29.9 | 47.3 | 3.0 | 5.8 | 2.6 | 16.2 | 7.0 | 3.4 | 5.2 | 0.7 | 0.3 | 8.5 |
| 18–64 | 3,439,117 | 1,198,858 | 34.9 | 51.4 | 2.8 | 3.2 | 2.9 | 15.5 | 6.1 | 3.4 | 5.3 | 0.6 | 0.3 | 8.7 |
| 65–74 | 414,939 | 52,136 | 12.6 | 1.9 | 6.5 | 25.1 | 0.0 | 25.5 | 19.5 | 4.5 | 6.5 | 1.8 | 0.3 | 8.4 |
| 75 or older | 516,082 | 53,937 | 10.5 | 1.1 | 4.4 | 46.0 | 0.1 | 22.5 | 16.6 | 1.9 | 2.5 | 0.8 | 0.1 | 4.1 |
| SOURCE: Authors' calculations using SSA records. | ||||||||||||||
| NOTE: Rounded components of percentage distributions do not necessarily sum to 100.0. | ||||||||||||||
| a. Natural, adoptive, or stepparent/stepchild. | ||||||||||||||
2025 Projections
We project that the number of program participants overall who need a payee will increase from 2.94 million in 2013 to 3.27 million by 2025, and the number who will have a nonfamily payee will increase by 114,336 to slightly more than 1 million as of 2025 (Table 3). For OASDI beneficiaries, the group with the largest increase in the need of a representative payee by 2025 is retired workers. We project that the number of retired-worker beneficiaries with representative payees will increase from 519,780 to 768,474—a difference of 248,694 beneficiaries, or 47.8 percent. Charts 2 and 3 highlight that rapid growth, which is due to the projected increase in the total number of retired-worker beneficiaries as baby boomers enter the program. That demographic shift is illustrated by the projected demand for payees in the 75–84 age group; by 2025, that group will experience the greatest rate of growth, with an increase of 107,270 beneficiaries, or 69.2 percent (Table 3). Finally, we project that the number of retired-worker beneficiaries who will need a nonfamily member to serve as their payee will increase from 221,784 in 2013 to 326,769 by 2025, indicating that SSA may need to devote additional resources to finding and monitoring payees for an additional 104,985 retired-worker beneficiaries.
| Beneficiary type and age | 2013 | 2025 | 2035 | Projected change from— | ||
|---|---|---|---|---|---|---|
| 2013 to 2025 | 2025 to 2035 | 2013 to 2035 | ||||
| Any representative payee | ||||||
| Overall | 2,941,037 | 3,265,580 | 3,558,921 | 324,543 | 293,341 | 617,884 |
| OASDI | 1,636,106 | 1,926,004 | 2,189,442 | 289,898 | 263,438 | 553,336 |
| Retired worker | 519,780 | 768,474 | 1,001,985 | 248,694 | 233,511 | 482,205 |
| Younger than 65 | 7,715 | 11,664 | 10,526 | 3,949 | -1,138 | 2,811 |
| 65–74 | 189,509 | 301,904 | 305,180 | 112,395 | 3,276 | 115,671 |
| 75–84 | 154,927 | 262,197 | 358,443 | 107,270 | 96,246 | 203,516 |
| 85 or older | 167,629 | 192,709 | 327,836 | 25,080 | 135,127 | 160,207 |
| Spouse | 23,620 | 13,006 | 12,148 | -10,614 | -858 | -11,472 |
| Younger than 65 | 2,513 | 1,952 | 2,022 | -561 | 70 | -491 |
| 65–74 | 9,965 | 5,072 | 4,852 | -4,893 | -220 | -5,113 |
| 75–84 | 7,693 | 5,122 | 4,339 | -2,571 | -783 | -3,354 |
| 85 or older | 3,449 | 860 | 935 | -2,589 | 75 | -2,514 |
| Nondisabled widow(er) | 120,565 | 52,899 | 45,090 | -67,666 | -7,809 | -75,475 |
| Younger than 65 | 2,455 | 2,616 | 2,211 | 161 | -405 | -244 |
| 65–74 | 18,282 | 3,763 | 3,812 | -14,519 | 49 | -14,470 |
| 75–84 | 36,353 | 16,922 | 12,262 | -19,431 | -4,660 | -24,091 |
| 85 or older | 63,475 | 29,598 | 26,805 | -33,877 | -2,793 | -36,670 |
| Disabled worker | 957,040 | 1,077,868 | 1,118,278 | 120,828 | 40,410 | 161,238 |
| 25–34 | 156,864 | 207,385 | 207,274 | 50,521 | -111 | 50,410 |
| 35–44 | 181,778 | 252,380 | 252,097 | 70,602 | -283 | 70,319 |
| 45–54 | 277,363 | 245,325 | 268,911 | -32,038 | 23,586 | -8,452 |
| 55 or older | 341,035 | 372,778 | 389,996 | 31,743 | 17,218 | 48,961 |
| Disabled widow(er) | 15,101 | 13,757 | 11,941 | -1,344 | -1,816 | -3,160 |
| Younger than 55 | 2,180 | 1,802 | 973 | -378 | -829 | -1,207 |
| 55 to FRA | 12,921 | 11,955 | 10,968 | -966 | -987 | -1,953 |
| SSI | 1,304,931 | 1,339,576 | 1,369,479 | 34,645 | 29,903 | 64,548 |
| 18–64 | 1,198,858 | 1,197,116 | 1,206,320 | -1,742 | 9,204 | 7,462 |
| 65–74 | 52,136 | 77,747 | 74,901 | 25,611 | -2,846 | 22,765 |
| 75 or older | 53,937 | 64,713 | 88,258 | 10,776 | 23,545 | 34,321 |
| Nonfamily representative payee | ||||||
| Overall | 886,217 | 1,000,553 | 1,121,201 | 114,336 | 120,648 | 234,984 |
| OASDI | 559,907 | 661,376 | 774,855 | 101,469 | 113,479 | 214,948 |
| Retired worker | 221,784 | 326,769 | 431,498 | 104,985 | 104,729 | 209,714 |
| Younger than 65 | 3,124 | 4,723 | 4,262 | 1,599 | -461 | 1,138 |
| 65–74 | 73,699 | 117,409 | 118,683 | 43,710 | 1,274 | 44,984 |
| 75–84 | 69,989 | 118,449 | 161,928 | 48,460 | 43,479 | 91,939 |
| 85 or older | 74,972 | 86,188 | 146,625 | 11,216 | 60,437 | 71,653 |
| Spouse | 5,977 | 3,258 | 3,011 | -2,719 | -247 | -2,966 |
| Younger than 65 | 343 | 266 | 277 | -77 | 11 | -66 |
| 65–74 | 2,674 | 1,361 | 1,303 | -1,313 | -58 | -1,371 |
| 75–84 | 2,145 | 1,428 | 1,210 | -717 | -218 | -935 |
| 85 or older | 815 | 203 | 221 | -612 | 18 | -594 |
| Nondisabled widow(er) | 51,147 | 22,170 | 18,827 | -28,977 | -3,343 | -32,320 |
| 65–74 | 7,735 | 1,592 | 1,613 | -6,143 | 21 | -6,122 |
| 75–84 | 16,413 | 7,640 | 5,536 | -8,773 | -2,104 | -10,877 |
| 85 or older | 26,419 | 12,319 | 11,156 | -14,100 | -1,163 | -15,263 |
| Disabled worker | 276,127 | 304,732 | 317,635 | 28,605 | 12,903 | 41,508 |
| 25–34 | 30,599 | 40,454 | 40,432 | 9,855 | -22 | 9,833 |
| 35–44 | 47,561 | 66,034 | 65,958 | 18,473 | -76 | 18,397 |
| 45–54 | 87,012 | 76,961 | 84,361 | -10,051 | 7,400 | -2,651 |
| 55 or older | 110,955 | 121,283 | 126,884 | 10,328 | 5,601 | 15,929 |
| Disabled widow(er) | 4,872 | 4,447 | 3,884 | -425 | -563 | -988 |
| Younger than 55 | 626 | 518 | 279 | -108 | -239 | -347 |
| 55 to FRA | 4,246 | 3,929 | 3,605 | -317 | -324 | -641 |
| SSI | 326,310 | 339,177 | 346,346 | 12,867 | 7,169 | 20,036 |
| 18–64 | 290,963 | 290,540 | 292,774 | -423 | 2,234 | 1,811 |
| 65–74 | 21,369 | 31,866 | 30,700 | 10,497 | -1,166 | 9,331 |
| 75 or older | 13,978 | 16,771 | 22,872 | 2,793 | 6,101 | 8,894 |
| SOURCE: Authors' calculations using SSA records and MINT projections. | ||||||
| NOTES: Data for 2013 are as of December.
FRA = full retirement age.
|
||||||
The number of disabled-worker beneficiaries who need a representative payee will increase much more slowly than that of retired-worker beneficiaries. From 2013 to 2025, we project demand to increase from 957,040 to 1,077,868 disabled-worker beneficiaries, a difference of only 120,828, or 12.6 percent. The 35–44 age group will exhibit the greatest change, with its need for representative payees projected to increase by 70,602 beneficiaries, or 38.8 percent. We also project a relatively modest increase of about 28,605 disabled-worker beneficiaries who will need a nonfamily representative payee.
The demand for representative payees among nondisabled widow(er) beneficiaries is projected to decrease substantially by 2025 because of the growth in women's labor force participation and the corresponding increase in their eligibility for retired-worker benefits based on their own earning record rather than that of a spouse. We project that the number of nondisabled widow(er)s with representative payees will decline to 52,899, a reduction of 67,666 beneficiaries, or 56.1 percent. The 65–74 age group shows the greatest rate of projected change, with a decrease of 14,519 beneficiaries, or 79.4 percent.
For recipients of only SSI payments, we project modest increases in the need for representative payees overall, with more substantial increases among recipients aged 65 or older. We project that by 2025, the number of recipients aged 65–74 with representative payees will increase by 25,611 (or 49.1 percent), and those aged 75 or older will increase by 10,776 (or 20.0 percent). However, the number of recipients aged 18–64 with a representative payee will stay relatively stable, declining slightly from 1,198,858 in 2013 to 1,197,116 in 2025. As with the 2025 OASDI projections, the rapid increase in the elderly population drives the overall SSI increase.
2035 Projections
We project that the number of program participants overall who need a representative payee will increase from 3.27 million in 2025 to 3.56 million by 2035 and that the number of participants who need a nonfamily payee will increase by 120,648 between 2025 and 2035 to 1.12 million. Demographic changes will continue to shift a greater share of program participants toward retired-worker beneficiary status, especially those aged 85 or older, who accounted for 10.2 percent of all beneficiaries with a payee in 2013 and will account for 15.0 percent of them in 2035 (Chart 3).
For 2035, we project that the number of retired-worker beneficiaries with representative payees will grow to 1,001,985—an increase of 233,511 (or 30.4 percent) from 2025 and of 482,205 (or 92.8 percent) from 2013 (Table 3). Among retired workers, the age group with the greatest change between 2025 and 2035 is 85 or older, which will increase by 135,127 beneficiaries (or 70.1 percent). The number of retired-worker beneficiaries with a nonfamily representative payee is projected to increase from 326,769 in 2025 to 431,498 by 2035, nearly doubling the 2013 count.
The number of disabled-worker beneficiaries who need representative payees will also continue to increase between 2025 and 2035, but more slowly. We project a population of 1,118,278 disabled workers with a representative payee by 2035, an increase of 40,410 beneficiaries (3.7 percent) from 2025 and of 161,238 beneficiaries (16.8 percent) from 2013. The age group with the greatest change between 2025 and 2035 (ages 45–54) will increase by 23,586 beneficiaries (9.6 percent). The number of disabled-worker beneficiaries with a nonfamily representative payee is projected to increase from 304,732 in 2025 to 317,635 by 2035, or 41,508 more beneficiaries than there were in 2013.
The demand for representative payees among nondisabled widow(er) beneficiaries will decline less dramatically between 2025 and 2035 than it will have between 2013 and 2025. We project that the number of nondisabled widow(er)s with payees will decline to 45,090 in 2035, a decrease of 7,809 beneficiaries (14.8 percent) from 2025 but of 75,475 beneficiaries (62.6 percent) from 2013. Among the age groups, the greatest change between 2025 and 2035 will occur for the group aged 75–84; its numbers will decline by 4,660 beneficiaries (27.5 percent). Yet the greatest proportional change between 2013 and 2035 will occur in the group aged 65–74, which will decrease by 14,470 beneficiaries, or 79.1 percent.
For recipients of only SSI payments, we project the greatest increase in demand for representative payees between 2025 and 2035 among recipients aged 75 or older. The model suggests that this population will reach 88,258 in 2035, an increase of 23,545 recipients (or 36.4 percent) from 2025 and of 34,321 recipients (or 63.6 percent) from 2013. We expect that the number of recipients aged 18–64 will also increase, but by less than 1 percent of the 2013 level. Specifically, this population is projected to increase by 9,204 recipients (or 0.8 percent) after 2025 and by 7,462 recipients (or 0.6 percent) after 2013. Conversely, we anticipate that the growth in the number of recipients aged 65–74 who need representative payees will stabilize by 2035, having decreased slightly (by 2,846 recipients, or 3.7 percent) after 2025.
Discussion and Conclusions
We estimate that the number of adult OASDI beneficiaries and SSI recipients who meet our study criteria and who need a representative payee will increase from 2.94 million in 2013 to 3.27 million by 2025 and to 3.56 million by 2035. The growth in the number of representative payees is driven primarily by growth in the retired-worker beneficiary population between 2013 and 2025 and by the 85-or-older age group's increasing share of that population as the baby boom generation ages between 2025 and 2035. As baby boomers become retired-worker beneficiaries in the coming years, the number who are estimated to need a representative payee will grow from about 520,000 in 2013 to about 768,000 by 2025. As they enter the 85-or-older age category in increasing numbers by 2035, the number of retired-worker beneficiaries who need a payee will continue to increase to about 1 million. In fact, the gap between retired-worker and disabled-worker beneficiaries who need payees will shrink considerably, from about 437,000 in 2013 to only about 116,000 by 2035.
The growth in demand for representative payees poses management challenges for SSA. Among disabled-worker beneficiaries who needed a payee in 2013, 71.1 percent had a family member serving in that role, but only 57.3 percent of retired-worker beneficiaries with a payee had a family member performing that service. Thus, SSA may not only need to find payees for an increasing retired-worker beneficiary population, it may also need to devote additional resources for monitoring far greater numbers of nonfamily payees to ensure that those payees do not misuse benefits.
SSA is planning for these challenges through several initiatives. First, the agency is conducting pilot projects to recruit more representative payees. One example, the Pro Bono Pilot, is designed to recruit lawyers in good standing to serve as representative payees as part of their required pro bono work. This project will begin in Maryland, and if it proves successful there, SSA plans to expand the pilot to other states. In collaboration with other federal agencies and organizations, SSA will also initiate two other pilot projects to recruit a new pool of payees, to provide them with interdisciplinary training designed to heighten awareness of elder abuse and exploitation, and to develop effective strategies for working with the banking community to help protect beneficiary assets.
Second, SSA is reexamining its methods of monitoring representative payees to protect beneficiaries from payee misuse of their benefits. Those methods will include the following:
- using public records to check the financial background (and any criminal history) of payees;
- sharing data with federal, state, and local organizations responsible for assigning guardians or payees;
- using predictive models to identify benefit-misuse risk factors and to target monitoring activities;
- providing interdisciplinary training on identifying and reporting elder abuse; and
- identifying best practices for monitoring payees.
Third, SSA is reaching out to other public and private organizations that serve the elderly population. By coordinating efforts with those organizations, the agency may be able to find ways to administer its representative payee program more efficiently. These efforts are in their early stages and will need to be sustained in order to address the needs of the growing retired-worker population.
Although our projections are subject to uncertainty, they indicate the scope of the challenges SSA will face in administering the representative payee program. As the agency gains more information on the need for representative payees, researchers will be able to reexamine our estimates and provide additional insight into the strategies that could help SSA manage the representative payee program most effectively.
Appendix
| Beneficiary type and age | Beneficiaries | Type of representative payee | ||||||||||
|---|---|---|---|---|---|---|---|---|---|---|---|---|
| Total | With representative payee | Parent a | Spouse | Child a | Other relative | Nonmental institution | Mental institution | Social agency | Public official | Financial organization | Other | |
| 2025 | ||||||||||||
| All adult beneficiaries | 72,502,321 | 1,926,004 | 355,121 | 290,764 | 291,087 | 327,656 | 332,827 | 47,474 | 91,989 | 18,640 | 8,725 | 161,721 |
| Retired worker | 59,267,974 | 768,474 | 7,320 | 115,678 | 200,656 | 118,051 | 224,299 | 11,729 | 26,090 | 9,660 | 3,061 | 51,930 |
| Younger than 65 | 4,788,198 | 11,664 | 381 | 1,577 | 1,748 | 3,235 | 2,166 | 271 | 635 | 165 | 42 | 1,444 |
| 65–74 | 31,581,319 | 301,904 | 3,866 | 72,412 | 52,349 | 55,868 | 68,068 | 6,654 | 13,845 | 3,763 | 1,345 | 23,734 |
| 75–84 | 17,983,200 | 262,197 | 1,670 | 34,591 | 74,010 | 33,477 | 86,255 | 3,320 | 8,076 | 3,610 | 987 | 16,201 |
| 85 or older | 4,915,257 | 192,709 | 1,403 | 7,098 | 72,549 | 25,471 | 67,810 | 1,484 | 3,534 | 2,122 | 687 | 10,551 |
| Spouse | 1,395,508 | 13,006 | 207 | 3,905 | 4,262 | 1,374 | 2,180 | 151 | 301 | 102 | 26 | 498 |
| Younger than 65 | 241,898 | 1,952 | 108 | 946 | 395 | 237 | 96 | 22 | 51 | 12 | 5 | 80 |
| 65–74 | 636,860 | 5,072 | 43 | 1,500 | 1,589 | 579 | 825 | 82 | 167 | 51 | 9 | 227 |
| 75–84 | 475,415 | 5,122 | 45 | 1,285 | 1,886 | 478 | 1,096 | 45 | 76 | 35 | 11 | 165 |
| 85 or older | 41,335 | 860 | 11 | 174 | 392 | 80 | 163 | 2 | 7 | 4 | 1 | 26 |
| Nondisabled widow(er) | 1,923,427 | 52,899 | 702 | 85 | 23,614 | 6,328 | 17,677 | 480 | 1,042 | 502 | 140 | 2,329 |
| Younger than 65 | 622,692 | 2,616 | 262 | 6 | 1,094 | 635 | 265 | 36 | 95 | 25 | 9 | 189 |
| 65–74 | 241,962 | 3,763 | 35 | 12 | 1,523 | 601 | 1,057 | 63 | 165 | 49 | 12 | 246 |
| 75–84 | 557,881 | 16,922 | 138 | 38 | 7,278 | 1,828 | 6,029 | 179 | 404 | 210 | 46 | 772 |
| 85 or older | 500,892 | 29,598 | 267 | 29 | 13,719 | 3,264 | 10,326 | 202 | 378 | 218 | 73 | 1,122 |
| Disabled worker | 9,680,807 | 1,077,868 | 346,200 | 171,021 | 57,531 | 198,384 | 86,932 | 34,821 | 63,812 | 8,244 | 5,439 | 105,484 |
| 25–34 | 675,291 | 207,385 | 133,989 | 9,027 | 201 | 23,714 | 7,876 | 5,148 | 10,008 | 1,007 | 742 | 15,673 |
| 35–44 | 1,430,963 | 252,380 | 119,971 | 29,102 | 2,748 | 34,525 | 14,313 | 8,335 | 15,368 | 1,638 | 1,215 | 25,165 |
| 45–54 | 2,178,205 | 245,325 | 61,907 | 42,113 | 12,975 | 51,369 | 19,891 | 9,093 | 16,714 | 1,975 | 1,438 | 27,850 |
| 55–FRA | 5,396,348 | 372,778 | 30,333 | 90,779 | 41,607 | 88,776 | 44,852 | 12,245 | 21,722 | 3,624 | 2,044 | 36,796 |
| Disabled widow(er) | 234,605 | 13,757 | 692 | 75 | 5,024 | 3,519 | 1,739 | 293 | 744 | 132 | 59 | 1,480 |
| Younger than 55 | 28,449 | 1,802 | 198 | 7 | 547 | 532 | 92 | 40 | 106 | 10 | 7 | 263 |
| 55–FRA | 206,156 | 11,955 | 494 | 68 | 4,477 | 2,987 | 1,647 | 253 | 638 | 122 | 52 | 1,217 |
| 2035 | ||||||||||||
| All adult beneficiaries | 82,470,374 | 2,189,442 | 363,633 | 317,037 | 368,309 | 365,608 | 413,502 | 51,086 | 99,831 | 21,730 | 9,779 | 178,927 |
| Retired worker | 69,191,670 | 1,001,985 | 8,922 | 133,984 | 279,090 | 148,491 | 304,035 | 14,035 | 31,622 | 12,498 | 3,916 | 65,392 |
| Younger than 65 | 4,321,689 | 10,526 | 344 | 1,423 | 1,577 | 2,920 | 1,955 | 244 | 573 | 149 | 38 | 1,303 |
| 65–74 | 31,924,106 | 305,180 | 3,908 | 73,198 | 52,917 | 56,474 | 68,806 | 6,727 | 13,996 | 3,804 | 1,359 | 23,991 |
| 75–84 | 24,584,132 | 358,443 | 2,284 | 47,288 | 101,177 | 45,766 | 117,916 | 4,539 | 11,041 | 4,935 | 1,349 | 22,148 |
| 85 or older | 8,361,743 | 327,836 | 2,386 | 12,075 | 123,419 | 43,331 | 115,358 | 2,525 | 6,012 | 3,610 | 1,170 | 17,950 |
| Spouse | 1,307,016 | 12,148 | 203 | 3,690 | 3,953 | 1,291 | 1,994 | 143 | 285 | 96 | 25 | 468 |
| Younger than 65 | 250,393 | 2,022 | 112 | 979 | 409 | 245 | 100 | 23 | 53 | 12 | 6 | 83 |
| 65–74 | 609,025 | 4,852 | 41 | 1,434 | 1,520 | 554 | 789 | 79 | 160 | 49 | 9 | 217 |
| 75–84 | 402,774 | 4,339 | 38 | 1,088 | 1,598 | 405 | 929 | 38 | 64 | 30 | 9 | 140 |
| 85 or older | 44,824 | 935 | 12 | 189 | 426 | 87 | 176 | 3 | 8 | 5 | 1 | 28 |
| Nondisabled widow(er) | 1,629,688 | 45,090 | 600 | 70 | 20,166 | 5,427 | 15,016 | 408 | 881 | 420 | 118 | 1,984 |
| Younger than 65 | 526,623 | 2,211 | 222 | 5 | 925 | 537 | 224 | 31 | 80 | 21 | 7 | 159 |
| 65–74 | 245,106 | 3,812 | 36 | 12 | 1,542 | 609 | 1,071 | 64 | 167 | 50 | 12 | 249 |
| 75–84 | 404,317 | 12,262 | 100 | 27 | 5,274 | 1,325 | 4,369 | 130 | 292 | 152 | 33 | 560 |
| 85 or older | 453,642 | 26,805 | 242 | 26 | 12,425 | 2,956 | 9,352 | 183 | 342 | 197 | 66 | 1,016 |
| Disabled worker | 10,137,515 | 1,118,278 | 353,348 | 179,226 | 60,697 | 207,372 | 90,896 | 36,247 | 66,400 | 8,599 | 5,668 | 109,825 |
| 25–34 | 674,935 | 207,274 | 133,918 | 9,022 | 201 | 23,701 | 7,871 | 5,145 | 10,003 | 1,007 | 741 | 15,665 |
| 35–44 | 1,429,362 | 252,097 | 119,837 | 29,070 | 2,745 | 34,487 | 14,297 | 8,325 | 15,351 | 1,636 | 1,213 | 25,136 |
| 45–54 | 2,387,625 | 268,911 | 67,859 | 46,162 | 14,222 | 56,307 | 21,804 | 9,967 | 18,321 | 2,165 | 1,576 | 30,528 |
| 55–FRA | 5,645,593 | 389,996 | 31,734 | 94,972 | 43,529 | 92,877 | 46,924 | 12,810 | 22,725 | 3,791 | 2,138 | 38,496 |
| Disabled widow(er) | 204,485 | 11,941 | 560 | 67 | 4,403 | 3,027 | 1,561 | 253 | 643 | 117 | 52 | 1,258 |
| Younger than 55 | 15,375 | 973 | 107 | 4 | 296 | 287 | 50 | 21 | 57 | 5 | 4 | 142 |
| 55–FRA | 189,110 | 10,968 | 453 | 63 | 4,107 | 2,740 | 1,511 | 232 | 586 | 112 | 48 | 1,116 |
| SOURCE: Authors' calculations using SSA records and MINT projections. | ||||||||||||
| NOTE: FRA = full retirement age. | ||||||||||||
| a. Natural, adoptive, or stepparent/stepchild. | ||||||||||||
| Recipient age | Recipients | Type of representative payee | |||||||||||
|---|---|---|---|---|---|---|---|---|---|---|---|---|---|
| Total | With representative payee | Parent a | Spouse | Child a | Grandparent | Other relative | Nonmental institution | Mental institution | Social agency | Public official | Financial organization | Other | |
| 2025 | |||||||||||||
| All adult recipients | 4,672,084 | 1,339,576 | 617,570 | 41,003 | 87,636 | 34,345 | 219,845 | 98,516 | 45,178 | 69,521 | 9,318 | 3,446 | 113,198 |
| 18–64 | 3,434,122 | 1,197,116 | 615,401 | 33,111 | 38,343 | 34,268 | 185,453 | 72,622 | 40,442 | 62,878 | 7,431 | 3,145 | 104,022 |
| 65–74 | 618,769 | 77,747 | 1,449 | 5,028 | 19,550 | 6 | 19,847 | 15,163 | 3,521 | 5,057 | 1,399 | 228 | 6,499 |
| 75 or older | 619,193 | 64,713 | 720 | 2,864 | 29,743 | 71 | 14,545 | 10,731 | 1,215 | 1,586 | 488 | 73 | 2,677 |
| 2035 | |||||||||||||
| All adult recipients | 4,901,093 | 1,369,479 | 622,510 | 42,115 | 98,035 | 34,635 | 225,836 | 102,424 | 45,803 | 70,396 | 9,502 | 3,490 | 114,733 |
| 18–64 | 3,460,522 | 1,206,320 | 620,132 | 33,365 | 38,638 | 34,532 | 186,879 | 73,181 | 40,753 | 63,361 | 7,488 | 3,170 | 104,821 |
| 65–74 | 596,121 | 74,901 | 1,396 | 4,844 | 18,834 | 6 | 19,120 | 14,608 | 3,392 | 4,872 | 1,348 | 220 | 6,261 |
| 75 or older | 844,450 | 88,258 | 982 | 3,906 | 40,563 | 97 | 19,837 | 14,635 | 1,658 | 2,163 | 666 | 100 | 3,651 |
| SOURCE: Authors' calculations using SSA records and MINT projections. | |||||||||||||
| a. Natural, adoptive, or stepparent/stepchild. | |||||||||||||
Notes
1 For more information on fee-for-service payees, see sections 205(j)(4), 205(j)(6)(A)(ii), 1631(a)(2)(D), and 1631(a)(2)(G)(i)(II) of the Social Security Act.
2 Although SSA always considered an individual's criminal history when determining suitability as a payee, the pilot program identified the specific felonies for which an applicant would be barred. A criminal record that included human trafficking, false imprisonment, kidnapping, rape/sexual offense, first degree homicide, robbery, fraud, fraud by scheme, theft of government funds/property, abuse/neglect, forgery, or identity theft would automatically bar an applicant from consideration.
3 For more information on the payee selection process, see section 205(j)(1) of the Social Security Act.
4 The administrative files used in MINT include the Detailed Earnings Record, the Summary Earnings Record, the Supplemental Security Record, the Master Beneficiary Record, and the Numerical Identifier (or Numident) file.
5 Our estimate of 8.2 million differs from the 8.6 million reported in GAO (2013) because GAO double-counted beneficiaries who were dually entitled for OASDI and SSI. GAO also included some beneficiaries who were coded as having a representative payee of “self.”
References
Ailshire, Jennifer A., Hiram Beltran-Sanchez, and Eileen M. Crimmins. 2015. “Becoming Centenarians: Disease and Functioning Trajectories of Older U.S. Adults as They Survive to 100.” Journals of Gerontology: Biological Sciences & Medical Sciences 70(2): 193–201.
Cutler, David M., Kaushik Ghosh, and Mary Beth Landrum. 2014. “Evidence for Significant Compression of Morbidity in the Elderly U.S. Population.” In Discoveries in the Economics of Aging, edited by David A. Wise, 21–80. Chicago, IL: University of Chicago Press.
Fries, James F. 2005. “The Compression of Morbidity.” The Milbank Quarterly 83(4): 801–823.
[GAO] Government Accountability Office. 2013. SSA Representative Payee Program: Addressing Long-term Challenges Requires a More Strategic Approach. Report No. GAO-13-473. Washington, DC: GAO.
Olshansky, S. Jay, Mark A. Rudberg, Bruce A. Carnes, Christine K. Cassel, and Jacob A. Brody. 1991. “Trading Off Longer Life for Worsening Health: The Expansion of Morbidity Hypothesis.” Journal of Aging and Health 3(2): 194–216.
Salomon, Joshua A., Haidong Wang, Michael K. Freeman, Theo Vos, Abraham D. Flaxman, Alan D. Lopez, and Christopher J. L. Murray. 2012. “Healthy Life Expectancy for 187 Countries, 1990–2010: A Systematic Analysis for the Global Burden Disease Study 2010.” The Lancet 380(9859): 2144–2162.
Smith, Karen E., Melissa M. Favreault, Barbara A. Butrica, and Philip Issa. 2010. Modeling Income in the Near Term, Version 6. Final report to the Social Security Administration. Washington, DC: Urban Institute Press.
[SSA] Social Security Administration. 2010. “Aged Beneficiaries in Need of Representative Payees.” OIG Report No. A-09-09-29002. Baltimore, MD: SSA, Office of the Inspector General. http://oig.ssa.gov/aged-beneficiaries-need-representative-payees.
———. 2014a. Annual Report on the Results of Periodic Representative Payee Site Reviews and Other Reviews, Fiscal Year 2013. Baltimore, MD: SSA. http://www.socialsecurity.gov/legislation/2013RepPayeeReport.pdf.
———. 2014b. Fast Facts and Figures About Social Security, 2014. SSA Publication No. 13-11785. Washington, DC: SSA. http://www.socialsecurity.gov/policy/docs/chartbooks/fast_facts/2014/index.html.