Poverty Among the Aged Population: The Role of Out-of-Pocket Medical Expenditures and Annuitized Assets in Supplemental Poverty Measure Estimates
Social Security Bulletin, Vol. 78 No. 1, 2018 (released February 2018)
We examine the extent to which the Supplemental Poverty Measure (SPM) overestimates the poverty rate of the aged population because it does not account for asset holdings. Following a conservative annuity approach, we use 2010 Health and Retirement Study data to estimate high and low bounds of potential annuitized asset withdrawals and then recalculate 2009 SPM poverty rates. Including annuitized asset principal in family resources reduces the estimated SPM poverty rate for the aged, especially among those who are in poverty because of medical out-of-pocket expenditures. For example, between 30.8 percent and 45.2 percent of the latter group would be reclassified as not SPM poor if they were to annuitize their financial assets. To better represent available family resources, poverty measurements for the aged should incorporate (at minimum) the conservative estimates of available assets produced by the bounded-annuity approach.
Koji Chavez is a postdoctoral sociology researcher at Washington University in St. Louis. Christopher Wimer is the co-director of the Center on Poverty and Social Policy (CPSP) at Columbia University. David Betson is a professor of economics and public policy at Notre Dame University. Lucas Manfield is a consultant of the CPSP at Columbia University.
Acknowledgments: The authors acknowledge the research support of the Center on Poverty and Inequality at Stanford University.
Contents of this publication are not copyrighted; any items may be reprinted, but citation of the Social Security Bulletin as the source is requested. The findings and conclusions presented in the Bulletin are those of the authors and do not necessarily represent the views of the Social Security Administration.
Introduction
| BLS | Bureau of Labor Statistics |
| CD | certificate of deposit |
| CPS | Current Population Survey |
| FCSU | food, clothing, shelter, and utilities |
| HRS | Health and Retirement Study |
| IRA | individual retirement account |
| MOOP | medical out-of-pocket [expenses] |
| OPM | official poverty measure |
| SPM | Supplemental Poverty Measure |
In 2011, the Census Bureau released its first report on the Supplemental Poverty Measure (SPM). That report (Short 2011) was the culmination of decades of work attempting to improve the official poverty measure (OPM), which has been used in federal statistics and research since the 1960s. Among other differences between the two measures, the SPM includes after-tax income and in-kind benefits as components of family resources and broadens the definition of “family unit” to include cohabiting couples as well as married ones. The SPM also attempts to account for health needs by subtracting families' medical out-of-pocket (MOOP) expenses from family resources. These changes result in a substantial difference in measured poverty, particularly among individuals aged 65 or older. According to the SPM, 15.9 percent of the aged were in poverty in 2010, nearly 7 percentage points higher than the OPM aged poverty rate of 9.0 percent. The difference in those poverty rates is almost exclusively due to the SPM's treatment of MOOP expenses as a nondiscretionary drain on a family's resources. After accounting for MOOP expenses, it seems the “golden years” are not as golden as the OPM suggests.
The dramatic difference in poverty rates that appears when MOOP expenses are subtracted from family resources has led scholars to question whether poverty among the aged is indeed as high as the SPM suggests. Suspicion has turned to whether the poverty measures adequately account for the ways families finance their MOOP—and other—expenses, with a specific focus on the use of assets. The OPM and SPM are both income-based measures that account for income derived from assets, but they do not address the principal that also could be used to finance current consumption.1 Some families, particularly those with high MOOP spending, may have significant asset holdings with which to finance necessary medical care. By ignoring family assets, poverty measures may misclassify as “poor” some families that have sufficient asset principal to meet their current spending needs. This may especially apply to the aged, whose measured incomes may not reflect the significant savings and other asset holdings many of them have accumulated over many years.
The goal of this article is to develop a conservative approach to incorporating asset principal into measures of family resources, and then to examine the resulting impact on SPM poverty rates among the aged. We first document the family asset holdings of aged persons who are identified as poor in the SPM to determine how many of them have holdings from which they may draw to help meet their medical and nonmedical expenses. We then develop a lower- and upper-bound annuity approach for incorporating asset principal (as reported for the previous year) into current family resources. The lower-bound annuity represents an extremely risk-averse strategy. It assumes that individuals expect to live 120 years and to extinguish their assets at the time of their death, and that they withdraw a fixed amount from their assets accordingly. The upper-bound annuity represents extremely favorable terms for the annuitant. It assumes that individuals receive an annuity from a hypothetical insurance firm that seeks to “break even” on individuals' assets left over after their deaths. Such an annuity represents an upper bound given that real insurance firms would offer lower withdrawal rates to compensate for taking on risk, to cover the costs of selling and administering the policies, and to profit. We then determine the reduction in the SPM poverty rate that results from the inclusion of annuitized assets, specifically among the aged who are “pushed” into poverty because of their MOOP expenditures. Finally, we contextualize the conservative changes to SPM poverty rates under the bounded-annuity approach by comparing them to the changes we would see in the SPM poverty rates if the aged were to consider all assets to be available to meet their needs. Overall, we find evidence that the SPM, by not incorporating a drawdown of asset principal, overestimates the aged poverty rate, especially among those classified as poor specifically because of MOOP expenditures.
Assets and MOOP Expenditures in the SPM
Drawing from asset principal is an important source of income for the aged. According to life-cycle savings models, individuals accumulate assets over their working lives with the intention of using not only the income derived from the assets but also a portion of the asset principal to meet their consumption needs during retirement (Gourinchas and Parker 2002). As the aged face high and continually increasing out-of-pocket expenditures for health insurance premiums and medical services (Meara, White, and Cutler 2004; Cutler, Rosen, and Vijan 2006; Hartman and others 2008; Paez, Zhao, and Hwang 2009), drawing from asset principal is particularly important to meet those needs (Marshall, McGarry, and Skinner 2011). From 2000 to 2010, Medicare beneficiaries' average annual MOOP expenses for services and premiums increased nearly $1,500, from $3,293 to $4,734 (Cubanski and others 2014). Medical expenses are even greater in the final years of life (Marshall, McGarry, and Skinner 2011). Based on a national sample of Medicare beneficiaries who died in the period 2002–2008, total MOOP expenses in their last 5 years of life averaged $38,688 in 2008 dollars (Kelley and others 2013). Evidence suggests that the aged accumulate assets in anticipation of future medical expenditures (De Nardi, French, and Jones 2010) and draw from their assets to cover health care costs along with other expenditures associated with poor health (Poterba, Venti, and Wise 2011).
The SPM accounts for MOOP expenditures by subtracting them from family resources.2 The SPM thereby estimates higher poverty rates among the aged than the OPM does, and the difference is almost exclusively because of the MOOP-expense subtraction (Bridges and Gesumaria 2013; Short 2011). In 2010, the SPM poverty rate for individuals aged 65 or older was 6.9 percentage points higher than the OPM rate (15.9 percent versus 9.0 percent). By itself, the subtraction of MOOP expenses from family resources accounted for a 7.0 percentage point increase in measured poverty, by far the largest effect (positive or negative) of any individual methodological change introduced by the SPM (Short 2011).
The SPM subtraction of MOOP expenses from family resources has been controversial because there is debate on the extent to which individuals may determine their spending levels. If MOOP expenditures are at least partially discretionary, the aged may elect to spend more on medical care than is truly necessary, thus overstating medical needs and “spending their way” into SPM-defined poverty. Some scholars argue that medical care is discretionary (Cogan 1995), and point to the relative well-being of some aged individuals in SPM-defined poverty to suggest that these families choose to spend as much as they do on medical care (Meyer and Sullivan 2012, 126).3
To the extent that MOOP expenses are nondiscretionary, subtracting them from family resources poses no problems. Indeed, scholars point to the relative price inelasticity of demand for medical care as evidence for the nondiscretionary nature of medical expenses (Newhouse and the Insurance Experiment Group 1993; Betson 2000). Furthermore, individuals respond to price only for specific forms of medical care, such as initial doctor's visits (Korenman and Remler 2013; Remler and Greene 2009); for other health care decisions, medical providers tend to have more control than do the individuals themselves (Wennberg, Fisher, and Skinner 2002).4 We will not resolve the debate in this article. Instead, we adhere to the current SPM guidelines for the treatment of medical expenditures in the measurement of poverty.
Because the SPM does not account for families' ability to draw from asset principal to supplement family resources, it is reasonable to ask whether the SPM overstates poverty among the aged. Furthermore, by combining the exclusion of asset principal with the subtraction of MOOP expenditures from family resources, the SPM may doubly overstate poverty among the aged who are classified as poor in the SPM but not in the OPM (Bavier 2006; Wimer and Manfield 2015). If the aged draw from their asset principal to cover their MOOP spending, the omission of asset principal from counted family resources calls into question whether the increase in poverty among the aged under the SPM, relative to that under the OPM, is “real.” Our goal is to incorporate asset principal into SPM-defined family resources to better represent the ability of the aged to finance their expenditures—in particular, their MOOP expenditures—and thus to more accurately measure poverty status.
Asset Principal in SPM Family Resources
There are two general strategies for incorporating asset principal into poverty measurement. The first strategy is to measure asset poverty and income poverty separately. Within the asset-poverty literature, families are considered “asset poor” if their assets alone (that is, independent of income) do not cover their needs (for example, they do not meet the OPM poverty threshold) over a short period such as 3 months (Caner and Wolff 2004; Haveman and Wolff 2004). Asset-poverty measures are best suited to determining the percentage of the population that cannot weather a sudden loss of income by drawing on asset principal alone. Although asset and income poverty measures are assessed separately, they may be combined in a joint poverty measure that considers families to be poor if they are in asset poverty and income poverty simultaneously (Radner and Vaughan 1987; Haveman and Wolff 2004; Gornick, Sierminska, and Smeeding 2009; Azpitarte 2012).
The second strategy for incorporating assets into poverty measurement is to rely on an income-based poverty measure, but to include a portion of asset principal in family resources. However, accurately estimating the size of this portion is crucial. The most generous estimates arise from an approach that assumes that families could draw down all available assets to meet their current needs, leaving no assets for use in later years. We call this the “rainy-day” approach. In practice, many aged people have accumulated assets as precautionary savings in anticipation of a major transitory expenditure, medical or otherwise, and then draw from their assets as needed (Poterba, Venti, and Wise 2011). Thus, the rainy-day approach may be realistic for estimating the asset principal of the aged, to the extent that family expenditures are transitory.
If the rainy-day approach provides the most generous estimate of assets to be included in family resources, what would be a reasonable conservative alterative? One promising approach is to estimate the amount the family would receive if they were to annuitize readily available assets (Weisbrod and Hansen 1968; Van den Bosch 1998; Short and Ruggles 2004–2005; Zagorsky 2004–2005; Brandolini, Magri, and Smeeding 2010). In this approach, a family is considered nonpoor if family resources, plus a hypothetical annuity from available assets, exceed the designated poverty threshold. This approach assumes that families are better off smoothing their consumption of assets as they age, and that they consequently plan on making equal-value withdrawals each year for the rest of their lives. Thus, the annuity approach asks whether a family would be in poverty in a given year if they were to withdraw assets in such a way that it would not affect future withdrawals. In practice, such a conservative annuity approach is more appropriate to the extent that family expenditures, such as MOOP costs, recur.
In this article, we incorporate asset principal into the SPM following a conservative annuity approach and expand on its previous applications by developing lower and upper bounds for the annuitized payment amounts. We discuss the calculation of the lower- and upper-bound annuity withdrawal rate below. To contextualize our bounded annuity approach, we compare the resulting SPM poverty rates with those that result from using the rainy-day approach, which assumes that the aged could exhaust all assets to meet current needs, as defined by the SPM poverty threshold.
We recognize that types of assets vary in the degree to which they are readily available. We thus use four definitions of available assets, with each of the first three categories subsumed by the category that follows it: (a) liquid assets, such as saving and checking accounts; (b) financial assets (liquid assets plus near-liquid assets such as individual retirement accounts [IRAs], stocks, bonds, and certificates of deposit [CDs]); (c) financial assets plus primary residence assets (the latter value estimated using a hypothetical reverse mortgage); and (d) all financial and real assets (the latter including second homes and other real estate).
Finally, any attempt to incorporate asset principal into poverty measurement requires an assumption about the extent to which families save assets to bequeath after death. In the annuity approach, Weisbrod and Hansen (1968) originally assumed exhaustion of assets at the expected end of life, and thus no bequests. To the other extreme, Wolff (1990) calculated annuities to be paid out like bond coupons, leaving principal assets unchanged. We argue that in practice, bequest motives likely influence the extent to which the aged draw assets down (Lockwood 2012). However, the approaches to asset inclusion described here are before-the-fact in that they ask whether the aged have sufficient available assets they could draw down, in a sustainable way, to cover needs unmet by income. Thus, we assume no bequests in our calculations. In other words, we do not consider a family to be poor if they have the means to be well off but choose not to draw their assets down (or spend their income) because of bequest motives.
Lower-Bound Annuity
For the lower-bound annuity withdrawal rate, we assume that individuals invest their financial assets with an average real rate of return i, and that this rate can be maintained over time.5 If we assume that an individual withdraws W dollars at the beginning of the year and that interest is collected at the end of the year, the balance of the asset accounts would be expressed as
where A0 is the value of the financial assets in the current year and A1 is the value of the financial assets at the end of the year. We assume that the individual wants the balance to go to zero (that is, no bequest) at the end of the year of his or her death. Consequently, the amount an individual could withdraw each year while alive would be expressed as
where D is the number of years the individual expects to live. Solving this equation for the withdrawal rate w*,
To construct a lower-bound withdrawal rate, we assume that individuals expect to live to age 120 and plan to deplete their assets at the time of their death. We assume an interest rate of 1.88 percent, which is 120 percent of the average federal midterm rate for 2001–2011. Because the Internal Revenue Service uses 120 percent of the federal midterm rate to calculate annual minimum IRA distributions, we use it as the benchmark interest rate for our calculations.6
Upper-Bound Annuity
The lower-bound calculation assumes that individuals will always receive a return of i on their investments. That assumption overlooks investment risk. One way to reduce both the personal risk of outliving one's funds and the investment risk is to purchase a fixed-payment annuity and thereby shift the risk to the insurance firm that issues the annuity. For the firm, the basic cost of the annuity is to make payments to an individual who buys an annuity policy for A0 dollars. The insurance firm invests the money collected from the policyholder and promises to make future annual payments until the policyholder dies.
How large are the payments our hypothetical firm can or will promise to the policyholder? Let us assume that the only cost to the firm is in making the promised annual payments for as long as the policyholder lives. When the annuitant dies, the firm pockets any remaining account balance. Neither the insurance firm nor the individual knows when the individual will die, but by selling a significant number of policies, the firm can limit its risk (this is an example of the central limit theorem). On some of the policies, the firm will profit; but on other policies, it will lose.
To determine how much the firm will, on average, make or lose from the sale of a policy, let us begin by constructing an account balance A for an individual who dies D years after taking out the policy, with the firm investing the premium funds at a rate i. The balance would be expressed as
In general, the asset value at the time of an annuitant's death will depend on how long he or she lives (D), what was paid for the annuity (A0), the rate of return (i) the insurer can get for the funds (we assume it is the same rate the annuitant can get, but it is most likely higher), and the cash flow rate the company has promised (w).
What cash flow rate will the firm offer? As a first approximation, if the firm assumes perfect competition in the annuity markets, it will offer a rate that generates an expected balance at the time of the policyholder's death that is equal to zero. This is called the actuarially fair cash flow rate (w**). For an initial payment of the insurance firm of A0 dollars, this is expressed as
where p d is the probability of dying d years into the future.
We use the actuarially fair cash flow rate w** of our hypothetical insurance firm as an upper-bound withdrawal rate. In practice, no firm would offer such a rate because it would not enable the firm to be compensated for taking on a risk that can't be hedged by selling numerous policies, to cover the costs of selling and administering the policies, and to profit; but such a calculation provides a useful upper bound. We again assume a 1.88 percent interest rate. We use life expectancy data derived from Internal Revenue Service mortality tables based on age and sex to calculate pd .7 For married or partnered couples, we compute individual withdrawal rates for each spouse or partner and apply the average to the couple.
Data
We use data from the 2010 Health and Retirement Study (HRS), a nationally representative survey of noninstitutionalized aged individuals and couples living in the United States. By focusing on a year shortly after the Great Recession, when asset values were compressed, we provide conservative estimates of the impact of including asset principal on SPM estimates. The HRS began in 1992 with a sample of individuals born during the period 1931–1941. HRS resurveys this original cohort every 2 years and periodically refreshes the sample with new cohorts to fill in gaps as members of the earlier cohorts age. The 2010 HRS (wave 10) data contain information for 13,591 noninstitutionalized Americans aged 56 or older. From that sample, we exclude 3,662 persons who were aged 56–64 in 2010 and an additional 226 persons who did not respond to HRS survey wave 9 in 2008.8 Those restrictions reduce the potential sample by 28.6 percent (26.9 percent because of age, 1.7 percent because of nonresponse) and leave us with 9,702 remaining observations.9
The HRS uses a number of data-collection innovations that make it preferable to other data sets for examining the financial well-being of older Americans. For example, to increase the accuracy of income and asset information, the HRS designates the individual who handles household finances to answer its finance-related questions. In addition, the HRS employs an “unfolding brackets” question sequence when respondents do not indicate an exact amount for an income or asset query. This methodology reduces the severity of distortion by replacing nonresponses with a relatively restricted range of values (for example, $2,500 to $5,000).10 The HRS further improves the accuracy of information on income derived from assets by asking for the income amount immediately after asking about the value of the assets themselves. Using this sequence is shown to reduce the problem of underreporting income from assets (Roemer 2000).11
Given that the SPM has not yet, to our knowledge, been implemented using HRS data, we must first ensure that we accurately account for the aged population who are in SPM poverty. To do this, we construct the SPM using HRS data and compare the results with those produced when using data from the Current Population Survey (CPS), which are typically used to construct the SPM.12 We make this comparison in the following section. Throughout our analysis, we focus on two mutually exclusive subgroups of the aged population that the SPM defines as poor. Both subgroups are unable to meet their MOOP expenses. Members of the first subgroup, those in “medical poverty,” still have sufficient resources to meet their nonmedical needs. Members of the second group, those in “nonmedical poverty,” do not. In other words, the group we call the “medical poor” would not be in SPM poverty were it not for their medical expenses.13
Medical and Nonmedical Poverty
We compare the OPM and the SPM poverty rates based on HRS and CPS data in Table 1. Relative to CPS data, HRS data reveal a lower medical poverty rate but a higher nonmedical poverty rate. What explains this discrepancy? We believe that the enhanced income data collection in the HRS results in its lower estimate of the medical poverty rate. In auxiliary analyses, we found similar distributions of MOOP expenses in the HRS and CPS data sets; therefore, the smaller percentage of the aged “pushed” into poverty by MOOP expenses in the HRS sample reflects the smaller percentage of the HRS sample who are classified as “near poor” before subtracting MOOP expenses from their family resources.14 On the other hand, we find that the nonmedical poverty rate is higher in the HRS because many aged persons in that sample live with family members (such as an adult child) for whom we have relatively little income information. Unlike its exhaustive collection of data on the respondent's income and assets, the HRS asks only a handful of questions that assess the income and assets of other family members.15 If we restrict the sample to aged persons not living with other family members, the HRS no longer overestimates nonmedical poverty rates relative to the CPS (6.6 percent and 7.7 percent, respectively; not shown). Although the HRS and CPS samples differ, we believe they are sufficiently similar for our purposes. With these caveats in mind, we examine the asset portfolios of different groups of aged HRS respondents in the context of the SPM.
| Measure | HRS | CPS | ||
|---|---|---|---|---|
| Poverty rate | Standard error | Poverty rate | Standard error | |
| OPM | 9.1 | 0.6 | 8.9 | 0.2 |
| SPM | 14.6 | 0.7 | 15.5 | 0.2 |
| Medical poor | 5.2 | 0.3 | 7.1 | 0.2 |
| Nonmedical poor | 9.4 | 0.6 | 8.5 | 0.2 |
| SOURCE: Authors' calculations using data from 2010 HRS (wave 10) and 2010 CPS. | ||||
| NOTES: Sample sizes: HRS = 9,702; CPS = 21,836. | ||||
| SPM total poverty rates do not necessarily equal the sum of rounded components. | ||||
Asset Holdings of the Aged Poor
We compare the asset holdings of the nonmedical and medical poor with those of the aged sample overall. We focus on two types of financial assets (liquid and near-liquid assets) and two types of real assets (primary-home and other real assets). Liquid assets include the value of deposit accounts such as checking, savings, and money market accounts. Near-liquid assets include the net values of (a) stocks, mutual funds, and investment trusts; (b) bonds and bond funds; (c) time deposits such as CDs, government savings bonds, and Treasury Bills (T-bills); (d) IRA or Keogh accounts; and (e) all other nonpension, nonliquid savings.16 Our valuation of primary-home assets, described below, follows a calculation recommended by O'Grady and Wunderlich (2012). Other real assets include the value of secondary homes and other real estate, minus the value of mortgages or other contracts on those properties. We do not include the net value of business or transportation assets such as cars, trucks, or recreational vehicles in other real assets.
We reduce the value of asset holdings by any applicable withdrawal penalties. We estimate a penalty of 6 months' interest for the withdrawal of CDs, government savings bonds, and T-bills.17 To estimate the value of assets in IRA or Keogh accounts, we subtract federal and state taxes (at the family's marginal tax rates) and assume that the entire account balance is taxable. We assume no early withdrawal penalties on IRA or Keogh accounts because all sample members are aged 65 or older. We also assume that the reported values of stocks, mutual funds, investment trusts, bonds, and bond funds already account for any withdrawal penalties. We are relatively confident in this assumption because the HRS asks respondents to report these values after having “paid off anything [they] owed on them.” We assume no withdrawal penalty for miscellaneous assets.
We approximate the value of primary-home assets by estimating the value of a hypothetical reverse mortgage. To determine reverse-mortgage eligibility and to estimate value, we follow the rules established by the Federal Housing Authority's reverse mortgage program, the Home Equity Conversion Mortgage.18 A family is eligible for a reverse mortgage if they own and live in their primary residence; if the residence is valued at greater than 40 percent of any mortgages or other home loans; and if the residence is not a mobile home, a retirement home, an assisted living residence, or in a nursing home. The value of the reverse mortgage equals the home value multiplied by a “Principal Limit Factor” published by the Department of Housing and Urban Development, minus the origination fees, closing fees, initial mortgage insurance premium, present-value set-aside for monthly administration fees, mandatory counseling fee, and any outstanding mortgages or home loans. We assign to eligible sample members a reverse mortgage amount if the calculated value is greater than zero. Appendix B presents a detailed description of the reverse mortgage calculation.
Table 2 provides the asset-holding rates among all aged persons and among the nonmedical and medical poor, as reported in the 2008 HRS (wave 9).19 Of the four asset categories of primary interest, liquid financial assets are the most prevalent (and, by definition, the most readily accessible). A majority of the nonmedical poor, 65.3 percent, have some liquid assets. A larger majority of the medical poor (86.8 percent) have liquid assets. Although majorities of those in SPM poverty possess liquid assets, the value of those assets is generally low, as we show later.
| Asset type | Overall | Nonmedical poor | Medical poor |
|---|---|---|---|
| Financial assets | 91.2 | 68.1 | 88.8 |
| Liquid assets | 88.2 | 65.3 | 86.8 |
| Near-liquid assets | 65.7 | 26.5 | 54.7 |
| Stocks | 31.2 | 10.5 | 19.3 |
| Bonds | 8.4 | 2.7 | 6.4 |
| CDs and other time deposits | 30.1 | 10.9 | 26.1 |
| IRA/Keogh accounts | 43.8 | 12.3 | 34.2 |
| Other savings | 18.5 | 5.5 | 10.3 |
| Liquid assets but no near-liquid assets | 25.5 | 41.6 | 34.1 |
| Real assets | 68.2 | 42.9 | 62.0 |
| Primary home | 60.5 | 38.6 | 57.3 |
| Other real assets | 25.5 | 9.0 | 18.1 |
| Second home | 15.4 | 6.2 | 10.2 |
| Other real estate | 15.3 | 3.9 | 10.9 |
| Real assets but no financial assets | 3.3 | 11.0 | 4.8 |
| Any financial or primary-home assets | 94.1 | 77.7 | 93.6 |
| Any financial or real assets | 94.5 | 79.1 | 93.7 |
| Sample size | 9,702 | 1,063 | 503 |
| SOURCE: Authors' calculations using data from 2008 HRS (wave 9). | |||
| NOTE: All differences between the nonmedical poor and the medical poor are statistically significant at the 0.05 level. | |||
The aged in SPM poverty may draw from near-liquid financial assets, if available. However, only 26.5 percent of the nonmedical poor have such assets. The medical poor fare better: 54.7 percent have near-liquid assets. The difference in financial asset-holding rates between the nonmedical and the medical poor is telling. Although 88.8 percent of the medical poor possess financial assets, only 68.1 percent of the nonmedical poor do. This suggests that, regardless of the value of financial assets available to those who hold them, nearly one-third of the nonmedical poor have no financial assets available to supplement their family income.
The aged may also draw from primary-home assets. For the aged population overall, primary-home assets are nearly as common as holdings of any near-liquid assets. Primary-home assets are held by 38.6 percent of the nonmedical poor and by 57.3 percent of the medical poor. Among the medical poor, 93.6 percent have either financial or primary-home assets from which they can draw, but only 77.7 percent of the nonmedical poor have this option.
The aged may also sell off other real assets, such as secondary homes, that are available. A surprising proportion of the SPM poor—specifically, the medical poor—have secondary homes or other real estate. Less surprising is that the proportions of aged persons holding these types of real assets are lower among the SPM poor than among the aged overall.
We now turn to the value of assets held by the aged in SPM poverty. Table 3 presents data on the distribution of liquid assets, financial assets (liquid or near-liquid), financial or primary-home assets, and all assets (financial or real) at selected deciles for the aged population overall and for those who are in nonmedical and medical poverty.20 Not surprisingly, as SPM resources increase, individuals are not only more likely to have assets, but the value of their holdings also increases.
| Percentile | Overall | Nonmedical poor | Medical poor |
|---|---|---|---|
| Liquid assets | |||
| 10th | 0 | 0 | 0 |
| 30th | 2,000 | 0 | 1,000 |
| 50th (median) | 8,000 | 300 | 5,000 |
| 70th | 20,000 | 2,000 | 18,000 |
| 90th | 85,000 | 16,700 | 55,000 |
| Average | 32,390 | 8,536 | 26,756 |
| Percentage with no holdings | 11.8 | 34.7 | 13.2 |
| All financial assets | |||
| 10th | 41 | 0 | 0 |
| 30th | 8,000 | 0 | 3,000 |
| 50th (median) | 58,875 | 500 | 20,000 |
| 70th | 195,150 | 5,700 | 105,000 |
| 90th | 638,985 | 100,800 | 361,866 |
| Average | 246,128 | 62,545 | 147,075 |
| Percentage with no holdings | 8.8 | 31.9 | 11.2 |
| All financial or primary-home assets | |||
| 10th | 500 | 0 | 200 |
| 30th | 32,577 | 150 | 15,676 |
| 50th (median) | 123,993 | 5,738 | 72,715 |
| 70th | 302,439 | 50,496 | 191,432 |
| 90th | 773,863 | 248,003 | 489,167 |
| Average | 311,597 | 98,312 | 202,536 |
| Percentage with no holdings | 5.9 | 22.3 | 6.4 |
| All financial or real assets | |||
| 10th | 539 | 0 | 205 |
| 30th | 40,699 | 200 | 20,000 |
| 50th (median) | 145,000 | 9,935 | 79,143 |
| 70th | 355,120 | 60,441 | 223,252 |
| 90th | 977,426 | 287,927 | 610,599 |
| Average | 416,649 | 114,145 | 236,923 |
| Percentage with no holdings | 5.5 | 20.9 | 6.3 |
| SOURCE: Authors' calculations using data from 2008 HRS (wave 9). | |||
Although 65.3 percent of the nonmedical poor have liquid financial assets, the average amount is modest ($8,536). The median amount ($300) is almost nonexistent, meaning that most of the nonmedical poor do not have sizable liquid assets to meet their needs. The addition of near-liquid assets does not substantially increase asset values for many of the nonmedical poor; half of them have no more than $500 in combined financial assets of any kind. If we also include primary-home assets, the nonmedical poor have an average of $98,312 in assets, and half of them have assets of less than $5,738.
The medical poor have greater asset holdings than the nonmedical poor have. At the 30th percentile, an individual in medical poverty has $1,000 in liquid assets, $3,000 in combined financial assets, and $15,676 in combined financial and primary-home assets. At the median, an individual in medical poverty has $5,000 in liquid assets, $20,000 in combined financial assets, and $72,715 in combined financial and primary-home assets—the latter value being more than 12 times the amount of combined financial and primary-home assets held by an aged individual in nonmedical poverty at the median.
Although many individuals in SPM poverty have few assets available, a small proportion—particularly among those in medical poverty—may have substantial assets from which they could draw to cover their needs.
Medical and Nonmedical Poverty After Including Annuitized Assets
We next assess the extent to which asset holdings of the aged could reasonably be included in their family resources under the bounded annuity approach. Both the lower- and upper-bound annuities in this approach are hypothetical. Recall that for the lower bound, we assume the annuity strategy of a highly risk-averse individual who withdraws assets with the expectation of complete asset exhaustion by age 120. For the upper bound, we assume that a hypothetical insurance firm distributes withdrawals based on the actuarially fair cash-flow rate; this firm is not compensated for taking on risk, has no costs (other than monthly or yearly withdrawals), and no profits. The “true” annuity amount is between these bounds.
Table 4 shows the upper- and lower-bound annuities we calculated for the nonmedical poor, the medical poor, and the aged population overall. We calculated annuities using (a) only liquid assets, (b) all financial assets, (c) all financial and primary-home assets, and (d) all financial and real assets. If the nonmedical poor were to annuitize only their liquid assets, the median value would be very low—between $9 and $20 annually. If they were to annuitize all financial assets, the median annuity would increase to between $17 and $37. Drawing from all financial and primary-home assets would increase the median annuity to between $209 and $462. Drawing from all assets would further increase the median annuity to between $296 and $616. The estimated annuities for the medical poor are much greater than those for the nonmedical poor. The median annuity drawn only from liquid assets for the medical poor would be between $167 and $386. The annuity would increase to between $707 and $1,557 if it were to be drawn from all financial assets, and to between $2,244 and $4,969 if it were to be drawn from all financial and primary-home assets.
| Potential annuity value | Overall | Nonmedical poor | Medical poor |
|---|---|---|---|
| Liquid assets | |||
| Lower bound a | 241 | 9 | 167 |
| Upper bound b | 514 | 20 | 386 |
| All financial assets | |||
| Lower bound a | 1,870 | 17 | 707 |
| Upper bound b | 3,998 | 37 | 1,557 |
| All financial and primary-home assets | |||
| Lower bound a | 3,978 | 209 | 2,244 |
| Upper bound b | 8,435 | 462 | 4,969 |
| All financial and real assets | |||
| Lower bound a | 4,576 | 296 | 2,703 |
| Upper bound b | 9,926 | 616 | 5,954 |
| SOURCE: Authors' calculations using data from 2008 HRS (wave 9). | |||
| NOTE: Annuitized asset values are estimated assuming a constant real interest rate of 1.88 percent. | |||
| a. The lower bound reflects a risk-averse annuitization strategy in which an individual withdraws assets gradually enough to avoid asset exhaustion before reaching age 120. | |||
| b. The upper bound reflects a successful high-risk, high-reward annuitization strategy in which an individual enters an annuity contract with a hypothetical insurance firm that distributes annual payments based on an actuarially fair cash-flow rate. The firm is assumed to be uncompensated for taking on risk, to have no costs other than annuity distributions, and to have no profits. | |||
We next recalculate the 2009 SPM poverty rates with the inclusion of calculated asset annuity values. Because we assume that the aged withdraw and then annuitize available assets, we (a) include estimated annuity values in family income, (b) exclude HRS-reported 2009 income from assets in our annuity calculations (to avoid double counting), and (c) recalculate taxes to reflect the effects of these changes in family income. If estimated annuities include primary-home assets, our tax recalculations assume that the annuitant no longer pays interest on primary-home mortgages because all existing mortgages and home loans on the primary residence must be paid off before one can receive a reverse mortgage. If estimated annuities include secondary homes and real estate other than the primary residence, we assume these assets have been sold, meaning that the annuitant no longer receives rent from, nor pays real estate taxes on, these properties. Finally, we assume that families do not annuitize assets if doing so results in a net loss to family resources.
The nonmedical poor can use annuitized assets to pay for either nonmedical needs or MOOP expenses. After including asset annuities in family resources, the nonmedical poor may remain classified as nonmedical poor (that is, still unable to afford either their nonmedical needs or their MOOP expenses), may be reclassified as medical poor (that is, able to afford their nonmedical needs but not their MOOP expenses), or may be reclassified as not SPM poor. For the medical poor, the only question is whether they remain classified as medical poor after the inclusion of annuitized assets or become reclassified as not SPM poor. Table 5 presents the percentage distributions of the nonmedical and medical poor by whether (and how) they are reclassified when different types of annuitized assets are counted as part of family resources.
| Potential annuity value and asset category | Nonmedical poor | Medical poor | |||||
|---|---|---|---|---|---|---|---|
| Total | If assets are included | Total | If assets are included | ||||
| Same | Medical poor | Not SPM poor | Same | Not SPM poor | |||
| Percentage distribution | |||||||
| Lower bound a | |||||||
| Liquid assets | 100.0 | 96.2 | 2.8 | 1.0 | 100.0 | 89.0 | 11.0 |
| All financial assets | 100.0 | 88.7 | 4.9 | 6.4 | 100.0 | 69.2 | 30.8 |
| All financial and primary-home assets | 100.0 | 80.1 | 7.2 | 12.7 | 100.0 | 55.5 | 44.5 |
| All financial and real assets | 100.0 | 78.3 | 7.7 | 13.9 | 100.0 | 53.1 | 46.9 |
| Upper bound b | |||||||
| Liquid assets | 100.0 | 93.2 | 2.9 | 3.9 | 100.0 | 82.1 | 17.9 |
| All financial assets | 100.0 | 83.2 | 5.2 | 11.6 | 100.0 | 54.8 | 45.2 |
| All financial and primary-home assets | 100.0 | 70.5 | 6.3 | 23.2 | 100.0 | 40.0 | 60.0 |
| All financial and real assets | 100.0 | 68.7 | 6.3 | 25.0 | 100.0 | 37.5 | 62.5 |
| Standard error | |||||||
| Lower bound a | |||||||
| Liquid assets | . . . | 0.7 | 0.7 | 0.4 | . . . | 1.7 | 1.7 |
| All financial assets | . . . | 1.7 | 1.0 | 1.2 | . . . | 2.9 | 2.9 |
| All financial and primary-home assets | . . . | 1.7 | 1.0 | 1.5 | . . . | 2.6 | 2.6 |
| All financial and real assets | . . . | 1.7 | 1.1 | 1.5 | . . . | 2.7 | 2.7 |
| Upper bound b | |||||||
| Liquid assets | . . . | 1.0 | 0.7 | 0.8 | . . . | 2.0 | 2.0 |
| All financial assets | . . . | 1.9 | 0.9 | 1.6 | . . . | 2.8 | 2.8 |
| All financial and primary-home assets | . . . | 2.1 | 0.9 | 1.7 | . . . | 2.7 | 2.7 |
| All financial and real assets | . . . | 2.1 | 1.0 | 1.8 | . . . | 2.9 | 2.9 |
| SOURCE: Authors' calculations using data from 2010 HRS (wave 10). | |||||||
| NOTES: Annuitized asset values are estimated assuming a constant real interest rate of 1.88 percent.
Rounded components of percentage distributions do not necessarily sum to 100.0.
. . . = not applicable.
|
|||||||
| a. The lower bound reflects a risk-averse annuitization strategy in which an individual withdraws assets gradually enough to avoid asset exhaustion before reaching age 120. | |||||||
| b. The upper bound reflects a successful high-risk, high-reward annuitization strategy in which an individual enters an annuity contract with a hypothetical insurance firm that distributes annual payments based on an actuarially fair cash-flow rate. The firm is assumed to be uncompensated for taking on risk, to have no costs other than annuity distributions, and to have no profits. | |||||||
Recall that in our sample, 9.4 percent of the aged overall are in nonmedical SPM poverty (Table 1). Table 5 shows that if annuities from liquid financial assets alone were included in family resources, between 93.2 percent and 96.2 percent of the aged in nonmedical poverty would retain that classification. However, 2.8–2.9 percent of them would be reclassified as medical poor. The remaining 1.0–3.9 percent of the nonmedical poor would be reclassified as not SPM poor. If annuities from all financial assets were included in family resources, 83.2–88.7 percent of the nonmedical poor would retain that classification, 4.9–5.2 percent would be reclassified as medical poor, and 6.4–11.6 percent would no longer be considered SPM poor. Finally, if annuities based on available financial and primary-home assets were included, 70.5–80.1 percent of the nonmedical poor would remain classified as such, 6.3–7.2 percent would be reclassified as medical poor, and 12.7–23.2 percent would be reclassified as not SPM poor.
The inclusion of annuities, particularly the inclusion of annuities from all financial and primary-home assets, has a much larger influence on the measurement of medical poverty. The medical poor comprise 5.2 percent of the aged population (Table 1). If annuities from liquid assets alone were included, 11.0–17.9 percent of the aged medical poverty population would no longer be considered SPM poor (Table 5). If annuities from all financial assets were included, 30.8–45.2 percent of this group would no longer be classified as SPM poor. If annuities from financial and primary-home assets were included, 44.5–60.0 percent would no longer be categorized as SPM poor. The effect of counting financial and primary-home assets is larger for the medical poor than for the nonmedical poor for two reasons. First, as noted earlier, the aged who are in medical poverty have, on average, more financial assets than do the nonmedical poor, meaning that their withdrawal amounts, whether lower- or upper-bound, are larger. Second, necessary expenses for the medical poor tend to be lower than those for the nonmedical poor because the medical poor, by definition, have their nonmedical needs met by their SPM resources.
Table 6 shows the SPM poverty rates for the aged with the inclusion of asset principal using our annuity method. Including liquid-asset annuities in estimated family resources would leave 8.8–9.1 percent of the aged population classified as nonmedical poor and 4.5–4.8 percent classified as medical poor. The overall SPM aged poverty rate would decrease slightly, from 14.6 percent to 13.3–13.9 percent, a 0.7 to 1.3 percentage point decrease. The reduction in the SPM poverty rate would be greater with the inclusion of all financial assets. Among the aged population, 7.9–8.4 percent would be in nonmedical poverty, and 3.3–4.0 percent would be in medical poverty. The overall SPM aged poverty rate would decrease from 14.6 percent to 11.2–12.4 percent, representing a decline of 2.2 to 3.4 percentage points. If the aged were to annuitize financial and primary-home assets, 6.7–7.6 percent of them would be in nonmedical poverty, 2.7–3.5 percent would be in medical poverty, and the overall SPM aged poverty rate would decrease by 3.5 to 5.3 percentage points to 9.3–11.1 percent. The inclusion of annuities from all financial and real assets would decrease SPM poverty rates only slightly more.
| Potential annuity value and asset category | Overall | Nonmedical poor | Medical poor |
|---|---|---|---|
| Poverty rate | |||
| Excluding annuitized assets | 14.6 | 9.4 | 5.2 |
| Including annuitized assets | |||
| Lower bound a | |||
| Liquid assets | 13.9 | 9.1 | 4.8 |
| All financial assets | 12.4 | 8.4 | 4.0 |
| All financial and primary-home assets | 11.1 | 7.6 | 3.5 |
| All financial and real assets | 10.9 | 7.4 | 3.5 |
| Upper bound b | |||
| Liquid assets | 13.3 | 8.8 | 4.5 |
| All financial assets | 11.2 | 7.9 | 3.3 |
| All financial and primary-home assets | 9.3 | 6.7 | 2.7 |
| All financial and real assets | 9.0 | 6.5 | 2.5 |
| Standard error | |||
| Excluding annuitized assets | 0.6 | 0.6 | 0.3 |
| Including annuitized assets | |||
| Lower bound a | |||
| Liquid assets | 0.7 | 0.6 | 0.3 |
| All financial assets | 0.6 | 0.6 | 0.3 |
| All financial and primary-home assets | 0.6 | 0.5 | 0.3 |
| All financial and real assets | 0.6 | 0.5 | 0.3 |
| Upper bound b | |||
| Liquid assets | 0.6 | 0.5 | 0.3 |
| All financial assets | 0.6 | 0.5 | 0.3 |
| All financial and primary-home assets | 0.5 | 0.5 | 0.2 |
| All financial and real assets | 0.5 | 0.5 | 0.2 |
| SOURCE: Authors' calculations using data from 2010 HRS (wave 10). | |||
| NOTES: Annuitized asset values are estimated assuming a constant real interest rate of 1.88 percent.
Rounded nonmedical and medical poverty rates do not necessarily sum to overall poverty rate.
|
|||
| a. The lower bound reflects a risk-averse annuitization strategy in which an individual withdraws assets gradually enough to avoid asset exhaustion before reaching age 120. | |||
| b. The upper bound reflects a successful high-risk, high-reward annuitization strategy in which an individual enters an annuity contract with a hypothetical insurance firm that distributes annual payments based on an actuarially fair cash-flow rate. The firm is assumed to be uncompensated for taking on risk, to have no costs other than annuity distributions, and to have no profits. | |||
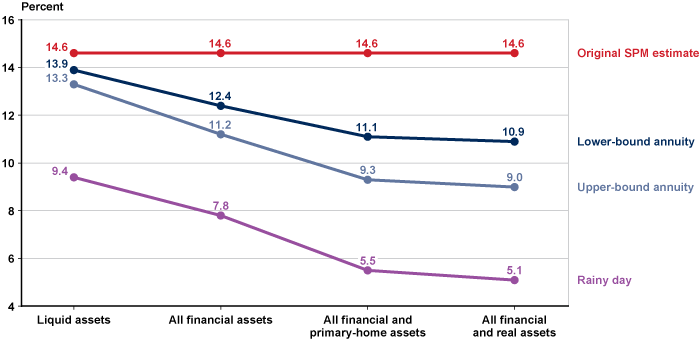
The SPM Under the Bounded Annuity and Rainy-Day Approaches
To contextualize our bounded annuity approach, which presents conservative estimates of the portions of assets from which the aged might draw to meet expenses, we compare its SPM poverty-rate results with those estimated using the rainy-day approach, in which the aged may draw all of their assets down to meet current needs. Chart 1 displays the results. The rainy-day SPM poverty rate would be 9.4 percent for aged individuals who drew from liquid assets only, 7.8 percent for those who drew from all financial assets, 5.5 percent for those who drew from financial and primary-home assets, and 5.1 percent for those who drew from all financial and real assets. Across all configurations of available assets, the rainy-day approach decreases the SPM poverty rate by an average of 3.7 percentage points (standard deviation = 0.3) more than the upper-bound annuity approach. Although the rainy-day approach likely overstates the effect of asset holdings, the bounded annuity approach may understate it; the actual effect of asset holdings is likely between the two.
SPM poverty rates for the population aged 65 or older, 2009: Original estimate and recalculations under three alternative methodologies, by asset category included in estimated family resources
Sensitivity Analyses
In this section, we discuss sensitivity aspects of two major assumptions in our annuity calculations: first, that individuals expect to live to age 120; and second, of a constant real interest rate of 1.88 percent.
The lower-bound annuity calculations assume that individuals expect to live to age 120. Our decision to use age 120 to represent an extremely risk-averse life expectancy is arbitrary. Because the purpose of a lower bound is to delineate the least return to asset annuitization, we decided to err on the side of extreme risk aversion. To assuage concerns that a life expectancy of age 120 is too risk averse, we also calculate changes to the SPM poverty rate using ages 110 and 100 as the life expectancies for the lower-bound annuity calculations. Table 7 shows the effects of these alternative life expectancies on the nonmedical and medical poor in terms of whether and how they are reclassified when annuitized asset values are included in family resources, and Table 8 shows how the alternative life expectancies affect SPM poverty rate estimates. When including annuities from all financial and real assets, an assumed life expectancy of age 110 decreases the lower-bound SPM poverty rate by 0.4 percentage points, from 10.9 percent (Table 6) to 10.5 percent (Table 8), and a life expectancy of age 100 decreases the lower-bound SPM poverty rate by 1.0 percentage point (to 9.9 percent). Thus, even a 20-year difference in life expectancy (from 120 to 100) changes the lower-bound SPM poverty rate by only 1.0 percentage point.
| Definition and asset category | Nonmedical poor | Medical poor | |||||
|---|---|---|---|---|---|---|---|
| Total | If assets are included | Total | If assets are included | ||||
| Same | Medical poor | Not SPM poor | Same | Not SPM poor | |||
| Percentage distribution | |||||||
| Life expectancy = 100 | |||||||
| Liquid assets | 100.0 | 94.9 | 2.9 | 2.3 | 100.0 | 84.2 | 15.8 |
| All financial assets | 100.0 | 85.5 | 5.4 | 9.1 | 100.0 | 61.6 | 38.4 |
| All financial and primary-home assets | 100.0 | 74.3 | 7.9 | 17.8 | 100.0 | 47.2 | 52.8 |
| All financial and real assets | 100.0 | 72.6 | 7.9 | 19.5 | 100.0 | 45.6 | 54.4 |
| Life expectancy = 110 | |||||||
| Liquid assets | 100.0 | 95.5 | 3.3 | 1.3 | 100.0 | 87.3 | 12.7 |
| All financial assets | 100.0 | 87.4 | 5.2 | 7.4 | 100.0 | 65.9 | 34.1 |
| All financial and primary-home assets | 100.0 | 78.4 | 7.4 | 14.2 | 100.0 | 51.4 | 48.6 |
| All financial and real assets | 100.0 | 76.6 | 7.9 | 15.5 | 100.0 | 49.2 | 50.8 |
| Standard error | |||||||
| Life expectancy = 100 | |||||||
| Liquid assets | . . . | 0.8 | 0.6 | 0.5 | . . . | 1.9 | 1.9 |
| All financial assets | . . . | 1.7 | 0.9 | 1.3 | . . . | 2.8 | 2.8 |
| All financial and primary-home assets | . . . | 1.8 | 1.0 | 1.6 | . . . | 2.5 | 2.5 |
| All financial and real assets | . . . | 1.8 | 1.0 | 1.6 | . . . | 2.5 | 2.5 |
| Life expectancy = 110 | |||||||
| Liquid assets | . . . | 0.8 | 0.7 | 0.4 | . . . | 1.9 | 1.9 |
| All financial assets | . . . | 1.7 | 1.0 | 1.2 | . . . | 2.9 | 2.9 |
| All financial and primary-home assets | . . . | 1.7 | 0.9 | 1.5 | . . . | 2.5 | 2.5 |
| All financial and real assets | . . . | 1.7 | 1.1 | 1.5 | . . . | 2.6 | 2.6 |
| SOURCE: Authors' calculations using data from 2010 HRS (wave 10). | |||||||
| NOTES: Annuitized asset values are estimated assuming a constant real interest rate of 1.88 percent.
Rounded components of percentage distributions do not necessarily sum to 100.0.
. . . = not applicable.
|
|||||||
| Definition and asset category | Overall | Nonmedical poor | Medical poor |
|---|---|---|---|
| Poverty rate | |||
| Excluding annuitized assets | 14.6 | 9.4 | 5.2 |
| Including annuitized assets | |||
| Life expectancy = 100 | |||
| Liquid assets | 13.6 | 9.0 | 4.6 |
| All financial assets | 11.8 | 8.1 | 3.7 |
| All financial and primary-home assets | 10.2 | 7.0 | 3.2 |
| All financial and real assets | 9.9 | 6.9 | 3.1 |
| Life expectancy = 110 | |||
| Liquid assets | 13.8 | 9.0 | 4.8 |
| All financial assets | 12.1 | 8.2 | 3.9 |
| All financial and primary-home assets | 10.7 | 7.4 | 3.3 |
| All financial and real assets | 10.5 | 7.2 | 3.3 |
| Standard error | |||
| Excluding annuitized assets | 0.6 | 0.6 | 0.3 |
| Including annuitized assets | |||
| Life expectancy = 100 | |||
| Liquid assets | 0.7 | 0.6 | 0.3 |
| All financial assets | 0.6 | 0.5 | 0.3 |
| All financial and primary-home assets | 0.5 | 0.5 | 0.2 |
| All financial and real assets | 0.5 | 0.4 | 0.2 |
| Life expectancy = 110 | |||
| Liquid assets | 0.7 | 0.6 | 0.3 |
| All financial assets | 0.6 | 0.5 | 0.3 |
| All financial and primary-home assets | 0.5 | 0.5 | 0.2 |
| All financial and real assets | 0.5 | 0.5 | 0.2 |
| SOURCE: Authors' calculations using data from 2010 HRS (wave 10). | |||
| NOTES: Annuitized asset values are estimated assuming a constant real interest rate of 1.88 percent.
Rounded nonmedical and medical poverty rates do not necessarily sum to overall poverty rate.
|
|||
There is also a degree of arbitrariness in our selection of a constant real interest rate, despite our attempt to approach the issue systematically. To address the potential arbitrariness, we calculate changes to the SPM if we estimate annuity values based on constant real interest rates as low as 0.5 percent and as high as 4.0 percent. Tables 9 and 10 repeat Tables 5 and 6 with the assumed interest rate of 0.5 percent and Tables 11 and 12 do the same with the assumed interest rate of 4.0 percent. When including annuities from all financial and real assets, a real interest rate of 0.5 percent increases the lower-bound SPM poverty rate by 0.5 percentage points, from 10.9 percent (Table 6) to 11.4 percent (Table 10), and increases the upper-bound SPM poverty rate by 0.2 percentage points from 9.0 percent (Table 6) to 9.2 percent (Table 10). A real interest rate of 4.0 percent (Table 12) decreases the lower-bound SPM poverty rate by 0.8 percentage points (from 10.9 percent to 10.1 percent), and decreases the upper bound by 0.2 percentage points (from 9.0 percent to 8.8 percent). Again, major changes in the assumed real interest rate have surprisingly minimal effects on SPM poverty rates.
| Potential annuity value and asset category | Nonmedical poor | Medical poor | |||||
|---|---|---|---|---|---|---|---|
| Total | If assets are included | Total | If assets are included | ||||
| Same | Medical poor | Not SPM poor | Same | Not SPM poor | |||
| Percentage distribution | |||||||
| Lower bound a | |||||||
| Liquid assets | 100.0 | 96.6 | 2.6 | 0.8 | 100.0 | 89.8 | 10.2 |
| All financial assets | 100.0 | 90.1 | 5.7 | 4.2 | 100.0 | 72.5 | 27.5 |
| All financial and primary-home assets | 100.0 | 82.6 | 8.4 | 9.0 | 100.0 | 59.9 | 40.1 |
| All financial and real assets | 100.0 | 81.2 | 8.9 | 9.8 | 100.0 | 57.1 | 42.9 |
| Upper bound b | |||||||
| Liquid assets | 100.0 | 93.7 | 2.4 | 3.8 | 100.0 | 82.1 | 17.9 |
| All financial assets | 100.0 | 83.5 | 5.2 | 11.3 | 100.0 | 55.2 | 44.8 |
| All financial and primary-home assets | 100.0 | 70.9 | 7.0 | 22.1 | 100.0 | 41.5 | 58.5 |
| All financial and real assets | 100.0 | 69.1 | 6.9 | 24.1 | 100.0 | 40.1 | 59.9 |
| Standard error | |||||||
| Lower bound a | |||||||
| Liquid assets | . . . | 0.7 | 0.6 | 0.4 | . . . | 1.7 | 1.7 |
| All financial assets | . . . | 1.5 | 1.2 | 0.9 | . . . | 2.8 | 2.8 |
| All financial and primary-home assets | . . . | 1.5 | 1.1 | 1.1 | . . . | 2.7 | 2.7 |
| All financial and real assets | . . . | 1.6 | 1.2 | 1.2 | . . . | 2.8 | 2.8 |
| Upper bound b | |||||||
| Liquid assets | . . . | 0.9 | 0.5 | 0.8 | . . . | 2.0 | 2.0 |
| All financial assets | . . . | 1.9 | 0.9 | 1.6 | . . . | 2.9 | 2.9 |
| All financial and primary-home assets | . . . | 2.1 | 1.1 | 1.8 | . . . | 2.7 | 2.7 |
| All financial and real assets | . . . | 2.1 | 1.0 | 1.8 | . . . | 2.7 | 2.7 |
| SOURCE: Authors' calculations using data from 2010 HRS (wave 10). | |||||||
| NOTES: Rounded components of percentage distributions do not necessarily sum to 100.0.
. . . = not applicable.
|
|||||||
| a. The lower bound reflects a risk-averse annuitization strategy in which an individual withdraws assets gradually enough to avoid asset exhaustion before reaching age 120. | |||||||
| b. The upper bound reflects a successful high-risk, high-reward annuitization strategy in which an individual enters an annuity contract with a hypothetical insurance firm that distributes annual payments based on an actuarially fair cash-flow rate. The firm is assumed to be uncompensated for taking on risk, to have no costs other than annuity distributions, and to have no profits. | |||||||
| Potential annuity value and asset category | Overall | Nonmedical poor | Medical poor |
|---|---|---|---|
| Poverty rate | |||
| Excluding annuitized assets | 14.6 | 9.4 | 5.2 |
| Including annuitized assets | |||
| Lower bound a | |||
| Liquid assets | 14.0 | 9.1 | 4.9 |
| All financial assets | 12.8 | 8.5 | 4.3 |
| All financial and primary-home assets | 11.7 | 7.8 | 3.9 |
| All financial and real assets | 11.4 | 7.7 | 3.8 |
| Upper bound b | |||
| Liquid assets | 13.3 | 8.8 | 4.5 |
| All financial assets | 11.2 | 7.9 | 3.3 |
| All financial and primary-home assets | 9.5 | 6.7 | 2.8 |
| All financial and real assets | 9.2 | 6.5 | 2.7 |
| Standard error | |||
| Excluding annuitized assets | 0.6 | 0.6 | 0.3 |
| Including annuitized assets | |||
| Lower bound a | |||
| Liquid assets | 0.7 | 0.6 | 0.3 |
| All financial assets | 0.7 | 0.6 | 0.3 |
| All financial and primary-home assets | 0.6 | 0.5 | 0.3 |
| All financial and real assets | 0.6 | 0.5 | 0.3 |
| Upper bound b | |||
| Liquid assets | 0.7 | 0.5 | 0.3 |
| All financial assets | 0.6 | 0.5 | 0.3 |
| All financial and primary-home assets | 0.5 | 0.5 | 0.2 |
| All financial and real assets | 0.5 | 0.5 | 0.2 |
| SOURCE: Authors' calculations using data from 2010 HRS (wave 10).
Rounded nonmedical and medical poverty rates do not necessarily sum to overall poverty rate.
|
|||
| a. The lower bound reflects a risk-averse annuitization strategy in which an individual withdraws assets gradually enough to avoid asset exhaustion before reaching age 120. | |||
| b. The upper bound reflects a successful high-risk, high-reward annuitization strategy in which an individual enters an annuity contract with a hypothetical insurance firm that distributes annual payments based on an actuarially fair cash-flow rate. The firm is assumed to be uncompensated for taking on risk, to have no costs other than annuity distributions, and to have no profits. | |||
| Potential annuity value and asset category | Nonmedical poor | Medical poor | |||||
|---|---|---|---|---|---|---|---|
| Total | If assets are included | Total | If assets are included | ||||
| Same | Medical poor | Not SPM poor | Same | Not SPM poor | |||
| Percentage distribution | |||||||
| Lower bound a | |||||||
| Liquid assets | 100.0 | 95.0 | 3.4 | 1.6 | 100.0 | 85.6 | 14.4 |
| All financial assets | 100.0 | 86.1 | 5.7 | 8.2 | 100.0 | 63.8 | 36.2 |
| All financial and primary-home assets | 100.0 | 76.1 | 7.6 | 16.3 | 100.0 | 48.6 | 51.4 |
| All financial and real assets | 100.0 | 74.1 | 7.9 | 18.0 | 100.0 | 46.7 | 53.3 |
| Upper bound b | |||||||
| Liquid assets | 100.0 | 92.7 | 3.2 | 4.1 | 100.0 | 81.5 | 18.5 |
| All financial assets | 100.0 | 82.8 | 4.5 | 12.6 | 100.0 | 53.7 | 46.3 |
| All financial and primary-home assets | 100.0 | 69.2 | 6.0 | 24.7 | 100.0 | 39.3 | 60.7 |
| All financial and real assets | 100.0 | 67.4 | 6.1 | 26.5 | 100.0 | 36.8 | 63.2 |
| Standard error | |||||||
| Lower bound a | |||||||
| Liquid assets | . . . | 0.8 | 0.7 | 0.5 | . . . | 1.9 | 1.9 |
| All financial assets | . . . | 1.8 | 1.0 | 1.2 | . . . | 2.9 | 2.9 |
| All financial and primary-home assets | . . . | 1.9 | 1.1 | 1.7 | . . . | 2.6 | 2.6 |
| All financial and real assets | . . . | 2.0 | 1.2 | 1.7 | . . . | 2.7 | 2.7 |
| Upper bound b | |||||||
| Liquid assets | . . . | 1.0 | 0.7 | 0.8 | . . . | 2.1 | 2.1 |
| All financial assets | . . . | 2.0 | 0.8 | 1.8 | . . . | 2.8 | 2.8 |
| All financial and primary-home assets | . . . | 2.1 | 0.8 | 1.8 | . . . | 2.6 | 2.6 |
| All financial and real assets | . . . | 2.2 | 0.8 | 1.9 | . . . | 2.9 | 2.9 |
| SOURCE: Authors' calculations using data from 2010 HRS (wave 10). | |||||||
| NOTES: Rounded components of percentage distributions do not necessarily sum to 100.0.
. . . = not applicable.
|
|||||||
| a. The lower bound reflects a risk-averse annuitization strategy in which an individual withdraws assets gradually enough to avoid asset exhaustion before reaching age 120. | |||||||
| b. The upper bound reflects a successful high-risk, high-reward annuitization strategy in which an individual enters an annuity contract with a hypothetical insurance firm that distributes annual payments based on an actuarially fair cash-flow rate. The firm is assumed to be uncompensated for taking on risk, to have no costs other than annuity distributions, and to have no profits. | |||||||
| Potential annuity value and asset category | Overall | Nonmedical poor | Medical poor |
|---|---|---|---|
| Poverty rate | |||
| Excluding annuitized assets | 14.6 | 9.4 | 5.2 |
| Including annuitized assets | |||
| Lower bound a | |||
| Liquid assets | 13.7 | 9.0 | 4.7 |
| All financial assets | 12.0 | 8.1 | 3.8 |
| All financial and primary-home assets | 10.4 | 7.2 | 3.2 |
| All financial and real assets | 10.1 | 7.0 | 3.1 |
| Upper bound b | |||
| Liquid assets | 13.2 | 8.7 | 4.5 |
| All financial assets | 11.0 | 7.8 | 3.2 |
| All financial and primary-home assets | 9.1 | 6.5 | 2.6 |
| All financial and real assets | 8.8 | 6.4 | 2.5 |
| Standard error | |||
| Excluding annuitized assets | 0.6 | 0.6 | 0.3 |
| Including annuitized assets | |||
| Lower bound a | |||
| Liquid assets | 0.7 | 0.6 | 0.3 |
| All financial assets | 0.6 | 0.5 | 0.3 |
| All financial and primary-home assets | 0.5 | 0.5 | 0.2 |
| All financial and real assets | 0.5 | 0.5 | 0.2 |
| Upper bound b | |||
| Liquid assets | 0.7 | 0.5 | 0.3 |
| All financial assets | 0.6 | 0.5 | 0.3 |
| All financial and primary-home assets | 0.5 | 0.5 | 0.2 |
| All financial and real assets | 0.5 | 0.5 | 0.2 |
| SOURCE: Authors' calculations using data from 2010 HRS (wave 10).
Rounded nonmedical and medical poverty rates do not necessarily sum to overall poverty rate.
|
|||
| a. The lower bound reflects a risk-averse annuitization strategy in which an individual withdraws assets gradually enough to avoid asset exhaustion before reaching age 120. | |||
| b. The upper bound reflects a successful high-risk, high-reward annuitization strategy in which an individual enters an annuity contract with a hypothetical insurance firm that distributes annual payments based on an actuarially fair cash-flow rate. The firm is assumed to be uncompensated for taking on risk, to have no costs other than annuity distributions, and to have no profits. | |||
Conclusion
How many of the aged in the United States are in poverty, and how many of those individuals are in poverty because of MOOP spending? The OPM is not equipped to answer those questions. However, the SPM, by accounting for MOOP expenditures, indicates that a much greater share of the aged population lives in poverty than is estimated by the OPM. When poverty calculations account for MOOP expenses, the “golden years” seem not as golden as had been thought.
The substantial difference between the OPM and SPM poverty rates for the aged has led scholars to question the approach with which the SPM accounts for MOOP expenditures, and specifically the extent to which individuals may be able to cover medical and other expenses. Central to this debate is the treatment of assets, especially for aged persons, who may have accumulated substantial asset holdings specifically for retirement. The aged may use those assets to finance living expenses, yet the SPM does not incorporate asset holdings into its poverty estimates. By not accounting for asset principal, does the SPM overestimate the proportion of the aged population living in poverty, specifically those who are poor because of MOOP expenses?
In this article, we used a lower- and upper-bound annuity approach to incorporate asset principal into SPM family resource estimates, assuming that aged persons draw down their asset principal through consistent yearly withdrawals (annuities) with no planned asset bequests after death. To do so, we first determined the extent to which the aged in SPM poverty have asset holdings to draw from. In general, aged persons who are in medical poverty (meaning that they are able to cover basic living expenses but unable to cover MOOP expenses without falling into poverty) have more financial and real asset holdings than those in nonmedical poverty have. We then calculated lower and upper bounds for potential annuitized asset withdrawals. For the lower bound, we assumed that individuals expect to live to age 120 and withdraw a fixed amount each year to extinguish their assets upon their death. For the upper bound, we assumed that individuals receive fixed annuity distributions from a hypothetical insurance firm that plans to break even on the individuals' assets after their death. We recalculated family resources with the inclusion of annuitized withdrawals based on liquid financial assets, all financial assets, financial and primary-home assets, and all financial and real assets, and reported the subsequent changes in estimated SPM poverty rates.
We found that by including annuitized assets in estimated family resources, the proportion of the aged population that is considered to be in medical poverty would be significantly smaller. Specifically, if their financial assets were annuitized, between 30.8 percent and 45.2 percent of the aged who are classified as medical poor would be reclassified as not SPM poor, and the overall SPM aged poverty rate would decrease by 2.2 to 3.4 percentage points. If primary-home assets were also annuitized, between 44.5 percent and 60.0 percent of the aged in medical poverty would be reclassified as not SPM poor, and the SPM poverty rate would decrease by 3.5 to 5.3 percentage points. The 2009 official poverty rate for the aged in the HRS was 9.1 percent. With financial and primary-residence assets included in estimated family resources, the recalculated SPM poverty rate is slightly higher than the OPM rate, suggesting that the SPM drastically overstates poverty among the aged by accounting for MOOP expenditures yet ignoring asset principal.
The bounded annuity approach assumes that aged persons prioritize a sustained drawdown of asset principal over the rest of their lives rather than meeting their current needs. As a result, the bounded annuity approach is a conservative estimate of the value of the assets to be included in family resources. In reality, many aged persons are likely to draw down their asset principal in response to a health-related or other financial shock (Poterba, Venti, and Wise 2011). If the shock is large enough, they may draw down their assets in a lump sum. Our rainy-day approach reflects such a circumstance. Although the bounded annuity and rainy-day approaches represent two opposing strategies for including assets in income-based poverty measurement, we suggest the bounded annuity approach as more appropriate for researchers who desire a conservative estimate of the portion of asset holdings to include in family resources.
These analyses have some important limitations. Although the HRS provides detailed information on the assets and income of the aged, information on the assets and income of family members with whom the aged live is less accurate. About 23.2 percent of the aged in the HRS sample live with other family members, meaning that our conclusions may underestimate the effect of including annuitized assets on the SPM poverty rate for the entire aged population if those who live with other family members have substantially lower asset holdings than do those who do not live with other family members. On the other hand, our calculations using HRS data may overstate SPM poverty and thus overstate the effect of including asset annuities on SPM poverty status. To assuage these latter concerns, in Tables 13 and 14 we recalculate Tables 5 and 6 to show the SPM poverty-rate effects of including annuitized asset values in estimated family resources if we restrict the sample to aged persons who do not live with other family members (that is, the subgroup for whom we have the most reliable income and asset data). The substantive results hold in this restricted sample; when annuitized assets are included in family resources, similar percentages of the aged in medical poverty are reclassified as not SPM poor, and we find a similar percentage point decrease in the SPM poverty rate. However, future research should seek to better understand the impact of including asset principal on SPM poverty estimates, particularly among the aged who live with other family members.
| Potential annuity value and asset category | Nonmedical poor | Medical poor | |||||
|---|---|---|---|---|---|---|---|
| Total | If assets are included | Total | If assets are included | ||||
| Same | Medical poor | Not SPM poor | Same | Not SPM poor | |||
| Percentage distribution | |||||||
| Lower bound a | |||||||
| Liquid assets | 100.0 | 94.4 | 4.1 | 1.6 | 100.0 | 89.6 | 10.4 |
| All financial assets | 100.0 | 82.2 | 8.2 | 9.6 | 100.0 | 69.3 | 30.7 |
| All financial and primary-home assets | 100.0 | 72.3 | 10.0 | 17.7 | 100.0 | 55.8 | 44.2 |
| All financial and real assets | 100.0 | 69.8 | 10.5 | 19.7 | 100.0 | 53.9 | 46.1 |
| Upper bound b | |||||||
| Liquid assets | 100.0 | 89.9 | 4.1 | 6.0 | 100.0 | 82.4 | 17.6 |
| All financial assets | 100.0 | 74.4 | 7.7 | 17.9 | 100.0 | 54.1 | 45.9 |
| All financial and primary-home assets | 100.0 | 61.3 | 8.8 | 29.9 | 100.0 | 39.4 | 60.6 |
| All financial and real assets | 100.0 | 59.7 | 8.3 | 32.0 | 100.0 | 37.5 | 62.5 |
| Standard error | |||||||
| Lower bound a | |||||||
| Liquid assets | . . . | 1.2 | 1.2 | 0.6 | . . . | 1.9 | 1.9 |
| All financial assets | . . . | 2.8 | 1.8 | 2.0 | . . . | 3.0 | 3.0 |
| All financial and primary-home assets | . . . | 2.8 | 1.5 | 2.4 | . . . | 3.0 | 3.0 |
| All financial and real assets | . . . | 2.8 | 1.7 | 2.4 | . . . | 3.2 | 3.2 |
| Upper bound b | |||||||
| Liquid assets | . . . | 1.7 | 1.2 | 1.4 | . . . | 2.1 | 2.1 |
| All financial assets | . . . | 3.0 | 1.5 | 2.5 | . . . | 3.0 | 3.0 |
| All financial and primary-home assets | . . . | 3.1 | 1.5 | 2.5 | . . . | 2.9 | 2.9 |
| All financial and real assets | . . . | 3.1 | 1.5 | 2.6 | . . . | 3.1 | 3.1 |
| SOURCE: Authors' calculations using data from 2010 HRS (wave 10). | |||||||
| NOTES: Rounded components of percentage distributions do not necessarily sum to 100.0.
. . . = not applicable.
|
|||||||
| a. The lower bound reflects a risk-averse annuitization strategy in which an individual withdraws assets gradually enough to avoid asset exhaustion before reaching age 120. | |||||||
| b. The upper bound reflects a successful high-risk, high-reward annuitization strategy in which an individual enters an annuity contract with a hypothetical insurance firm that distributes annual payments based on an actuarially fair cash-flow rate. The firm is assumed to be uncompensated for taking on risk, to have no costs other than annuity distributions, and to have no profits. | |||||||
| Potential annuity value and asset category | Overall | Nonmedical poor | Medical poor |
|---|---|---|---|
| Poverty rate | |||
| Excluding annuitized assets | 12.2 | 6.6 | 5.6 |
| Including annuitized assets | |||
| Lower bound a | |||
| Liquid assets | 11.5 | 6.2 | 5.3 |
| All financial assets | 9.9 | 5.4 | 4.5 |
| All financial and primary-home assets | 8.6 | 4.8 | 3.8 |
| All financial and real assets | 8.3 | 4.6 | 3.7 |
| Upper bound b | |||
| Liquid assets | 10.8 | 5.9 | 4.9 |
| All financial assets | 8.5 | 4.9 | 3.6 |
| All financial and primary-home assets | 6.8 | 4.0 | 2.8 |
| All financial and real assets | 6.6 | 3.9 | 2.7 |
| Standard error | |||
| Excluding annuitized assets | 0.7 | 0.5 | 0.4 |
| Including annuitized assets | |||
| Lower bound a | |||
| Liquid assets | 0.7 | 0.5 | 0.4 |
| All financial assets | 0.6 | 0.4 | 0.4 |
| All financial and primary-home assets | 0.5 | 0.4 | 0.3 |
| All financial and real assets | 0.5 | 0.4 | 0.3 |
| Upper bound b | |||
| Liquid assets | 0.7 | 0.5 | 0.4 |
| All financial assets | 0.5 | 0.4 | 0.3 |
| All financial and primary-home assets | 0.4 | 0.4 | 0.3 |
| All financial and real assets | 0.4 | 0.4 | 0.3 |
| SOURCE: Authors' calculations using data from 2010 HRS (wave 10). | |||
| a. The lower bound reflects a risk-averse annuitization strategy in which an individual withdraws assets gradually enough to avoid asset exhaustion before reaching age 120. | |||
| b. The upper bound reflects a successful high-risk, high-reward annuitization strategy in which an individual enters an annuity contract with a hypothetical insurance firm that distributes annual payments based on an actuarially fair cash-flow rate. The firm is assumed to be uncompensated for taking on risk, to have no costs other than annuity distributions, and to have no profits. | |||
The SPM makes a number of updates to the OPM, yet its accuracy can still be improved. In this article, we address a specific problem: how to incorporate asset principal into family resource estimates, given its importance to the well-being of the aged. Following a conservative approach to asset annuitization, we show that if the aged were to draw from their asset principal in a consistent way, the SPM poverty rate, and in particular the medical poverty rate, would be substantially lower. This finding suggests that the SPM, as currently measured, overstates the poverty rate of the aged, yet it may be improved by including a portion of asset principal in family resource estimates as calculated using a bounded annuity approach.
Appendix A: Calculating SPM Poverty Rates Using HRS Data
The SPM defines a “family unit” as all persons living at the same address who are related by marriage, blood, or adoption, plus any unrelated children cared for by the family and any cohabitants and their children (Short 2011). SPM family units are easily identified in the HRS, as unmarried partners are treated the same as spouses. About 3 percent of respondents in the HRS data are unmarried partners.
Construction of the Poverty Threshold
A family is considered to be poor if the value of their total resources is less than a threshold amount. Since the 1960s, OPM thresholds have been based on the cost of food and updated for inflation (Fisher 1998). By contrast, the SPM threshold is based on contemporary expenditures for a core basket of goods chosen to reflect actual family expenditures on all necessities, rather than focusing only on nutritional requirements (Johnson, Rogers, and Tan 2001).21 The SPM thresholds represent combined family expenditures for food, clothing, shelter, and utilities (FCSU) and a small additional amount to cover other necessary expenses such as household supplies and personal care items. The thresholds are updated over time as spending levels change.
The Bureau of Labor Statistics (BLS) uses 5 years of quarterly Consumer Expenditure Survey data to calculate the FCSU expenditures of families in the 30th through 36th percentiles. BLS uses the average of these FCSU expenditures to produce the yearly SPM thresholds for consumer units with two children. BLS calculates separate poverty thresholds by housing tenure (homeowners with mortgages, homeowners without mortgages, and renters).22 In 2009, the SPM threshold for a two-adult, two-child family was $24,450 for homeowners with a mortgage, $20,590 for homeowners without a mortgage, and $24,301 for renters.23 We adjust for different family types using a three-parameter scale developed by Betson (1996) and used by the Census Bureau. Table A-1 presents those parameters.
| Family unit type | Equation |
|---|---|
| One or two adults | (Number of adults)0.5 |
| Single parent | (Number of adults + [0.8 × first child] + [0.5 × number of other children])0.7 |
| All others | (Number of adults + [0.5 × number of other children])0.7 |
| SOURCE: Betson (1996). | |
After adjusting for family size and composition, we then adjust the shelter and utility portion of the poverty thresholds to account for geographic differences in housing costs, following a procedure described in Renwick (2011). The geographic adjustment of the housing and utility portion of the SPM thresholds is
where MGRD2B is the median gross rent for a “decent” 2-bedroom unit; HousingShare is the percentage of the threshold reserved for housing and utility expenses; NF is the normalization factor; i is state of residence; n denotes the entire United States; j is either the specific metro area, “other” metro area, or “other” nonmetro area; and t represents housing tenure. The normalization factor ensures that the average geographic threshold adjustment is equal to 1, meaning that the average poverty threshold is not affected by geographic adjustment.
We use American Community Survey (ACS) data for 2006–2010 to compute the median gross rent for a 2-bedroom unit for specific metro areas, unidentified metro areas by state, and unidentified nonmetro areas by state.24 We follow Census Bureau practice by restricting gross rents to 2-bedroom apartments with complete kitchen and plumbing facilities. Because the HRS restricted-use geographic data are available at the county level, we use a Census Bureau metro area/county crosswalk to merge the ACS metro-level cost data to the HRS data.
Construction of Family Resources
Family resources include all cash income plus in-kind benefits that the family may use to meet their FCSU needs, minus MOOP expenditures, work and childcare expenditures, child support expenditures, and taxes (Short 2011).
Family income. HRS collects data from individual respondents on earnings in the form of wage and salary income, bonuses, overtime pay, commissions, tips, earnings from a second job, military reserve earnings, professional practice or trade income, and self-employment earnings. Individual HRS respondents also report income from pensions and annuities; Social Security disabled-worker, retired-worker, and spouse or survivor benefits; Supplemental Security Income; unemployment and worker's compensation benefits; and veteran's benefits. From couples, HRS collects data on income from welfare, food stamps, business or farm income (if not counted in self-employment income), gross rent, and interest from dividends, bonds, checking and savings accounts, and CDs. Finally, HRS respondent couples are asked to report the combined sum of all other income to account for “private disability insurance payments, consulting fees, rent from your home or second home, odd jobs, and so forth,” and from “an inheritance, a trust fund, or an insurance settlement.” We also include recurring payments the family receives from children or other relatives living outside of the household.
HRS collects information on work earnings for each family member in the household, and includes a catch-all question for all other income for all family members in the household. We replicate the technique described in St. Clair and others (2011) to impute missing values.
In-kind benefits. The SPM counts the following five sources of in-kind benefits in its definition of resources: the Supplemental Nutrition Assistance Program (SNAP, formerly known as food stamps); the Special Supplemental Nutrition Program for Women, Infants, and Children (WIC); housing subsidy programs; free and reduced-price school lunch programs; and the Low Income Home Energy Assistance Program (LIHEAP). In the HRS, only SNAP benefits and housing subsidies are reported. Therefore, we lack data on WIC, school lunch programs, and LIHEAP. We assume that the lack of data on WIC and on participation in school lunch programs is unproblematic given the age of our sample. We also view the absence of data on LIHEAP benefits as unproblematic given that LIHEAP benefits make no practical difference in poverty rates (Short 2011). About 4 percent of respondents in our sample live in subsidized housing. To approximate the value of their housing subsidies, we subtract rental payments from the shelter and utilities portion of the poverty threshold. The HRS does not collect information on receipt of government rental subsidies for respondents who do not reside in public housing complexes. However, our analyses of CPS data reveal that more than 90 percent of government-supported housing benefits received by individuals older than 65 came in the form of public housing.
MOOP expenditures. HRS collects information on out-of-pocket expenditures for prescription drugs and each of the following services: hospital visits, nursing home care, doctor visits, dental care, outpatient surgery, home health care, and use of special facilities.25 Respondents report those MOOP expenses for the period since their previous interview, which for most respondents occurred 2 years prior. We divide the amount reported for the reference period by the number of years to approximate MOOP expenses in the previous calendar year.
MOOP expenditures also include health insurance premiums. HRS collects data on the amounts paid by each respondent in premiums for Medicare Advantage, Medicare Part D, and each of up to three other health care plans, as well as for premiums for long-term care coverage. Unlike the reference period for HRS questions on medical services, the period for premiums refers to current payment amounts. We assume that the respondent paid a similar premium in the previous calendar year.26 Similar to its questions on income, the HRS uses an unfolding-brackets methodology to narrow the range of MOOP expenses (both for insurance premiums and for medical services) in following up on initial-nonresponse items.
For aged individuals with Medicare Part B coverage, the premium is deducted from their Social Security income. Short (2011) found it particularly difficult to determine Part B premiums, given that some CPS respondents reported their gross Social Security income (before the Part B premium was deducted) and others did not. This is not an issue in the HRS, as all respondents are asked to report net Social Security income received (that is, after the Part B premium deduction).
Work-related expenditures. In 2009, the median weekly amount of work-related expenditures for earners aged 18 or older was $33.00, according to the Survey of Income and Program Participation (SIPP). In accordance with National Academy of Sciences panel recommendations, we estimated respondents' work-related expenditures by multiplying the number of weeks worked by 85 percent of the median weekly expenditure. HRS asks working respondents for the number of weeks usually worked per year in primary and secondary jobs. Ninety-nine percent of these respondents know the total weeks worked. We categorize the remaining working respondents by work status (full-time, part-time, and no answer) and impute the number of weeks worked based on the mean number of weeks worked for full-time, part-time, and all workers in similar years of CPS data. If a respondent holds two jobs, we calculate work expenditures for both.
Childcare expenditures. We assume that all families with children younger than 15 (and with no nonworking family members older than 21, who could presumably provide childcare in the home) incur childcare expenses. To approximate the amounts, we multiply a “base amount” of 85 percent of the childcare expenses for female-headed households reported in SIPP for spring 2010 by the number of weeks worked by the worker with fewest weeks, subject to a cap of the annual earnings of the household's lowest earner.
Taxes. The amount of taxes paid are not reported to the HRS. Consequently, we impute taxes for each taxpayer using the TAXSIM (v9) simulation software from the National Bureau of Economic Research. We assume that all married respondents file jointly and that partnered or single respondents file separately. We simulate taxes paid in the year prior to the interview. For the majority of respondents, this refers to 2009; however, a handful of respondents were interviewed at the beginning of 2011, making their simulated tax payments for 2010.
The TAXSIM (v9) software uses 21 components to estimate federal and state tax liabilities: tax year, state, marital status, number of dependent exemptions, number of taxpayers aged 66 or older in the family unit, wage and salary income of taxpayer, wage and salary income of spouse, dividend income, other property income, taxable pensions, gross Social Security benefits, other nontaxable transfer income, rent paid, real estate taxes paid, other itemized deductions (including preference shares of medical expenses), child care expenses, unemployment compensation, number of dependents younger than 17, other deductions (including deductible medical expenses not previously included, home mortgage interest, and charitable contributions), short-term capital gains or losses, and long-term capital gains or losses. We do not include reported taxable IRA distributions in the “other property income” category, nor do we include short- or long-term capital gains or losses.
Appendix B: Home Equity Conversion Mortgage Calculation
We calculate the amount available to a family from a hypothetical reverse mortgage as the initial principal limit (described below) minus origination fees, closing fees, initial mortgage insurance premium, the present value of a set-aside for monthly administration fees, a mandatory counseling fee, and any mortgages or home loans on the property. We follow procedures described in Warshawsky and Zohrabyan (2016).
We determine the initial principal limit by multiplying the lesser of the home value or $625,500 by a Principal Limit Factor.27 That factor, which is published on the Department of Housing and Urban Development website, is a function of the expected mortgage interest rate (that is, the sum of the 10-year constant-term Treasury rate and an average lender's margin, plus an ongoing mortgage insurance premium) and the age of the asset holder.28 In 2009, the average 10-year constant-term Treasury rate was 3.26 percent. We assume an average lender's margin of 2.5 percent and an ongoing mortgage insurance premium of 1.25 percent.
From the initial principal limit, we subtract financing fees (origination fees, closing fees, initial mortgage insurance premium), the present value of the set-aside amount for monthly administration fees, and any outstanding mortgages and home loans. Origination fees equal 2 percent of the home value if less than $200,000, and 1 percent of the value if above $200,000, with a lower limit of $2,500 and an upper limit of $6,000. To approximate closing fees, we use the formula derived by Warshawsky and Zohrabyan (2016):
We assume an initial mortgage insurance premium of 2.5 percent if mortgages and home loans equal 33 percent of the home value or more, and 0.5 percent of the home value otherwise. We calculate the present value of a set-aside amount for monthly administrative fees, assuming a monthly payment of $35 until the asset holder reaches age 100, discounted at the expected rate of 7.01 percent (3.26 + 2.5 + 1.25). We assume a mandatory counseling fee of $125.
Notes
1 Some scholars argue that consumption-based poverty measures are more appropriate than income-based measures for capturing well-being (Meyer and Sullivan 2003, 2011, 2012). The argument is three-pronged: (1) conceptually, consumption-based measures better capture the standard of living for those who draw on their assets to smooth consumption or who have access to credit; (2) consumption-based measures better capture well-being empirically, especially among those with few resources (see Brewer, Goodman, and Leicester 2006); and (3) consumption is more accurately reported than income for disadvantaged families (however, see Bavier 2006). The comparative analysis of consumption-based and income-based poverty measures is an important topic for ongoing research.
2 The SPM definition of family resources differs from that of the OPM in other ways as well. Those ways include (a) the addition of the market value of in-kind benefits, (b) the subtraction of other nondiscretionary expenses such as work-related and childcare costs, and (c) an accounting of the impact of income and payroll taxes. The SPM poverty thresholds are (a) based on current consumer expenditures on food, clothing, shelter, and utilities, plus a small amount for other necessary expenses; (b) adjusted according to a family's housing tenure (renters, homeowners with mortgages, and homeowners without mortgages); and (c) geographically adjusted to account for cost of living differences across the United States. The SPM family unit includes cohabiting unmarried partners and partners' children. These definitions were the culmination of decades of debate on how to improve the OPM (for example, Citro and Michael 1995; National Research Council 2005; and Interagency Technical Working Group on Developing a Supplemental Poverty Measure 2010).
3 Scholars also find that the MOOP-expense subtraction does not improve the prediction of material hardship (Levy 2009; Meyer and Sullivan 2012).
4 Beyond this debate, the subtraction of MOOP expenditures from family resources solves a practical problem because the alternative approach of including expected medical needs in the poverty threshold presents technical difficulties (Bavier 2006; Korenman and Remler 2013). Furthermore, subtracting MOOP expenditures from family resources records the actual amount spent; even if MOOP expenditures are discretionary, the resulting drain on family resources is real (Betson 2000).
5 This is a significant assumption for two reasons. First, interest rates fluctuate over time, and rates differ depending on where assets are held. Second, past returns are a good predictor of future returns. We assume we know the future returns on the person's assets.
6 The midterm rate is based on the 1-month average of market yields from obligations of maturities of 3 to 9 years. Federal midterm rates can be found at https://apps.irs.gov/app/picklist/list/federalRates.html.
7 For the underlying mortality data, see Internal Revenue Service (2017).
8 The average family resources of HRS wave 9 respondents did not differ significantly from those of nonrespondents ($46,192 and $42,412, respectively; p = 0.15, two-tailed t-test).
9 One observation was removed because it was the lone observation in its sampling stratum.
10 For instance, if the financial respondent does not know or refuses to indicate the value of an income or asset, HRS asks: “Would it be less than $2,000, $2,000, or more than $2,000?” If the respondent answers more than $2,000, HRS asks: “Would it be less than $5,000, more than $5,000, or what?” This process continues until the “true” amount is confined to a fairly limited income or asset bracket.
11 For more advantages of the HRS, see Juster and others (2007).
12 HRS and CPS samples are similar; the main difference between the surveys is HRS's better collection of family income data. A detailed comparison of the HRS and the CPS samples in terms of their demographic and social characteristics, family income, family MOOP expenditures, and SPM family resources prior to the subtraction of MOOP expenses is available on request (kchavez@wustl.edu). Appendix A provides a detailed description of the construction of the SPM using HRS data.
13 Aged persons in nonmedical poverty possess family resources of less than the SPM poverty threshold before MOOP expenses are subtracted, while the family resources of those in medical poverty equal or exceed the threshold before MOOP expenses are subtracted.
14 A “near-poor” family has resources of at least 100 percent but less than 150 percent of the SPM poverty threshold.
15 To assess job-related income of each family member, HRS asks the financial respondent: “About how much money did [the family member] earn from all jobs in [last calendar year]?” To assess all other income of family members, HRS asks the financial respondent: “Not including job income, about how much in total did other members of your family living (here/there) receive in [last calendar year] from Social Security, pensions, welfare, interest, gifts, or anything else, (before taxes and other deductions)?”
16 We do not include employer pensions in near-liquid assets for the annuity process because of high survey nonresponse for pension amounts. However, 2009 reported income from pensions is included in all calculations.
17 Respondents report only the combined value of these assets. We assume the penalty for early withdrawal of these assets is equal to the average penalty for early CD withdrawal (see http://www.bankrate.com/finance/cd/cd-early-withdrawal-penalties-sock-1.aspx).
18 Warshawsky and Zohrabyan (2016) provide a detailed examination of the use of reverse mortgages to enhance retirement security.
19 Unlike the HRS income questions, which refer to the previous calendar year, asset questions refer to the time of the survey.
20 The asset distributions for the aged in nonmedical poverty are surprisingly similar to those for the aged in OPM poverty. Among the aged in OPM poverty, the average value of liquid assets is $7,979, the median value is $200, and 36.2 percent have no holdings. The average value of financial assets is $56,428, the median value is $224, and 34.5 percent have no holdings. The average value of any financial or primary-home assets is $88,947, the median value is $6,106, and 23.6 percent have no holdings
21 The SPM eliminates age-based differences in poverty thresholds, another significant change affecting the aged population.
22 For details on the BLS procedures, see http://www.bls.gov/pir/spmhome.htm#threshold.
23 For a detailed discussion of the BLS thresholds, see Garner (2010).
24 We downloaded these data from the Integrated Public Use Microdata Series website (Ruggles and others 2015).
25 The Center for the Study of Aging at the RAND Corporation provides imputations for missing MOOP expenditure values.
26 We cap premiums at the 99th percentile.
27 The Housing and Economic Recovery Act of 2008 raised the Home Equity Conversion Mortgage limit to $625,500.
28 We use the age of the younger individual for married or partnered couples.
References
Azpitarte, Francisco. 2012. “Measuring Poverty Using Both Income and Wealth: A Cross-Country Comparison between the U.S. and Spain.” Review of Income and Wealth 58(1): 24–50.
Bavier, Richard. 2006. “Misclassification in an Experimental Poverty Measure.” Monthly Labor Review 129(6): 46–55.
Betson, David M. 1996. “‘Is Everything Relative?' The Role of Equivalence Scales in Poverty Measurement.” Census Bureau Supplemental Poverty Measure Working Paper. https://www.census.gov/library/working-papers/1996/demo/betson-02.html.
———. 2000. “Response to Bavier's Critique of the NRC Panel's Recommendations.” Census Bureau Supplemental Poverty Measure Working Paper. https://www.census.gov/library/working-papers/2000/demo/betson-01.html.
Brandolini, Andrea, Silvia Magri, and Timothy M. Smeeding. 2010. “Asset-Based Measurement of Poverty.” Journal of Policy Analysis and Management 29(2): 267–284.
Brewer, Mike, Alisa Goodman, and Andrew Leicester. 2006. Household Spending in Britain: What Can It Teach Us about Poverty? Bristol, UK: University of Bristol Policy Press.
Bridges, Benjamin, and Robert V. Gesumaria. 2013. “The Supplemental Poverty Measure (SPM) and the Aged: How and Why the SPM and Official Poverty Estimates Differ.” Social Security Bulletin 73(4): 49–69.
Caner, Asena, and Edward N. Wolff. 2004. “Asset Poverty in the United States, 1984–99: Evidence from the Panel Study of Income Dynamics.” Review of Income and Wealth 50(4): 493–518.
Citro, Constance F., and Robert T. Michael, editors. 1995. Measuring Poverty: A New Approach. Washington DC: The National Academies Press.
Cogan, John. 1995. “Dissent.” In Measuring Poverty: A New Approach, edited by Constance F. Citro and Robert T. Michael (385–390). Washington DC: The National Academies Press.
Cubanski, Juliette, Christina Swoope, Anthony Damico, and Tricia Neuman. 2014. “How Much Is Enough? Out-of-Pocket Spending Among Medicare Beneficiaries: A Chartbook.” Menlo Park, CA: Henry J. Kaiser Family Foundation. http://kff.org/medicare/report/how-much-is-enough-out-of-pocket-spending-among-medicare-beneficiaries-a-chartbook/.
Cutler, David M., Allison B. Rosen, and Sandeep Vijan. 2006. “The Value of Medical Spending in the United States, 1960–2000.” The New England Journal of Medicine 355(9): 920–927.
De Nardi, Mariacristina, Eric French, and John B. Jones. 2010. “Why Do the Elderly Save? The Role of Medical Expenses.” Journal of Political Economy 118(1): 39–75.
Fisher, Gordon M. 1998. “Setting American Standards of Poverty: A Look Back.” Focus 19(2): 47–52.
Garner, Thesia I. 2010. “Supplemental Poverty Measure Thresholds: Laying the Foundation.” Washington, DC: Department of Labor, Bureau of Labor Statistics.
Gornick, Janet C., Eva Sierminska, and Timothy M. Smeeding. 2009. “The Income and Wealth Packages of Older Women in Cross-National Perspective.” Journal of Gerontology: Social Sciences 64B: 402–414.
Gourinchas, Pierre-Olivier, and Jonathan A. Parker. 2002. “Consumption Over the Life Cycle.” Econometrica 70(1): 47–89.
Hartman, Micah, Aaron Catlin, David Lassman, Jonathan Cylus, and Stephen Heffler. 2008. “U.S. Health Spending by Age, Selected Years Through 2004.” Health Affairs 27(1): w1–12.
Haveman, Robert, and Edward N. Wolff. 2004. “The Concept and Measurement of Asset Poverty: Levels, Trends and Composition for the U.S., 1983–2001.” Journal of Economic Inequality 2(2): 145–169.
Interagency Technical Working Group on Developing a Supplemental Poverty Measure. 2010. Observations from the Interagency Technical Working Group on Developing a Supplemental Poverty Measure. Washington, DC: Census Bureau.
Internal Revenue Service. 2017. “Actuarial Tables.” https://www.irs.gov/retirement-plans/actuarial-tables.
Johnson, David S., John M. Rogers, and Lucilla Tan. 2001. “A Century of Family Budgets in the United States.” Monthly Labor Review 124(5): 28–45.
Juster, Thomas F., Honggao Cao, Mick Couper, Daniel H. Hill, Michael Hurd, Joseph P. Lutpon, Michael Perry, and James P. Smith. 2007. “Enhancing the Quality of Data on the Measurement of Income and Wealth.” MRRC Working Paper No. 2007-151. Ann Arbor, MI: University of Michigan Retirement Research Center.
Kelley, Amy S., Kathleen McGarry, Sean Fahle, Samuel M. Marshall, Qingling Du, and Jonathan S. Skinner. 2013. “Out-of-Pocket Spending in the Last Five Years of Life.” Journal of General Internal Medicine 28(2): 304–309.
Korenman, Sanders, and Dahlia Remler. 2013. “Rethinking Elderly Poverty: Time for a Health Inclusive Poverty Measure?” NBER Working Paper No. 18900. Cambridge, MA: National Bureau of Economic Research. http://www.nber.org/papers/w18900.
Levy, Helen. 2009. “Income, Material Hardship, and the Use of Public Programs among the Elderly.” MRRC Working Paper No. 2009-208. Ann Arbor, MI: University of Michigan Retirement Research Center. https://deepblue.lib.umich.edu/handle/2027.42/64462.
Lockwood, Lee M. 2012. “Bequest Motives and the Annuity Puzzle.” Review of Economic Dynamics 15(2): 226–243.
Marshall, Samuel, Kathleen McGarry, and Jonathan S. Skinner. 2011. “The Risk of Out-of-Pocket Health Care Expenditure at the End of Life.” In Explorations in the Economics of Aging, edited by David A. Wise (101–128). Chicago, IL: University of Chicago Press.
Meara, Ellen, Chapin White, and David M. Cutler. 2004. “Trends in Medical Spending by Age, 1963–2000.” Health Affairs 23(4): 176–183.
Meyer, Bruce D., and James X. Sullivan. 2003. “Measuring the Well-Being of the Poor Using Income and Consumption.” NBER Working Paper No. 9760. Cambridge, MA: National Bureau of Economic Research. http://www.nber.org/papers/w9760.
———. 2011. “Viewpoint: Further Results on Measuring the Well-Being of the Poor Using Income and Consumption.” The Canadian Journal of Economics 44(1): 52–87.
———. 2012. “Identifying the Disadvantaged: Official Poverty, Consumption Poverty, and the New Supplemental Poverty Measure.” The Journal of Economic Perspectives 26(3): 111–136.
National Research Council. 2005. Experimental Poverty Measures: Summary of a Workshop. Washington DC: The National Academies Press.
Newhouse, Joseph P., and the Insurance Experiment Group. 1993. Free for All? Lessons from the RAND Health Insurance Experiment. Cambridge, MA: Harvard University Press.
O'Grady, Michael J., and Gooloo S. Wunderlich, editors. 2012. Medical Care Economic Risk: Measuring Financial Vulnerability from Spending on Medical Care. Panel on Measuring Medical Care Risk in Conjunction with the New Supplemental Income Poverty Measure. Washington, DC: The National Academies Press.
Paez, Kathryn Anne, Lan Zhao, and Wenke Hwang. 2009. “Rising Out-of-Pocket Spending for Chronic Conditions: A Ten-Year Trend.” Health Affairs 28(1): 15–25.
Poterba, James, Steven Venti, and David Wise. 2011. “The Composition and Drawdown of Wealth in Retirement.” Journal of Economic Perspectives 25(4): 95–118.
Radner, Daniel B., and Denton R. Vaughan. 1987. “Wealth, Income, and the Economic Status of Aged Households.” In International Comparisons of the Distribution of Household Wealth, edited by Edward N. Wolff. New York, NY: Oxford University Press.
Remler, Dahlia K., and Jessica Greene. 2009. “Cost-Sharing: A Blunt Instrument.” Annual Review of Public Health 30(1): 293–311.
Renwick, Trudi. 2011. “Geographic Adjustments of Supplemental Poverty Measure Thresholds: Using the American Community Survey Five-Year Data on Housing Costs.” SEHSD Working Paper No. 2011-21. Washington, DC: Census Bureau, Social, Economic, and Housing Statistics Division.
Roemer, Marc I. 2000. “Assessing the Quality of the March Current Population Survey and the Survey of Income and Program Participation Income Estimates, 1990–1996.” Washington, DC: Census Bureau, Social, Economic, and Housing Statistics Division.
Ruggles, Steven, Katie Genadek, Ronald Goeken, Josiah Grover, and Matthew Sobek. 2015. “Integrated Public Use Microdata Series: Version 5.0 [Machine-readable Database].” Minneapolis, MN: University of Minnesota. https://usa.ipums.org.
Short, Kathleen C. 2011. The Research Supplemental Poverty Measure: 2010. Census Bureau, Current Population Reports, P60-241. Washington, DC: Census Bureau.
Short, Kathleen C., and Patricia Ruggles. 2004–2005. “Experimental Measures of Poverty and Net Worth: 1996.” Journal of Income Distribution 13(3–4): 8–21.
St. Clair, Patricia, Delia Bugliari, Nancy Campbell, Sandy Chien, Orla Hyden, Michael Hurd, Regan Main, Angela Miu, Mike Moldoff, Constantijn Panis, Philip Pantoja, Afshin Rastegar, Susann Rohwedder, Marian Oshiro, and Julie Zissimopoulos. 2011. RAND HRS Data Documentation, Version L. Santa Monica, CA: RAND Corporation. http://www.rand.org/content/dam/rand/www/external/labor/aging/dataprod/randhrsL.pdf.
Van den Bosch, Karel. 1998. “Poverty and Assets in Belgium.” Review of Income and Wealth 44(2): 215–228.
Warshawsky, Mark J., and Tatevik Zohrabyan. 2016. “Retire on the House: The Use of Reverse Mortgages to Enhance Retirement Security.” Cambridge, MA: Massachusetts Institute of Technology Center on Finance and Policy.
Weisbrod, Burton A., and W. Lee Hansen. 1968. “An Income-Net Worth Approach to Measuring Economic Welfare.” American Economic Review 58(5): 1315–1329.
Wennberg, John E., Elliott S. Fisher, and Jonathan S. Skinner. 2002. “Geography and the Debate over Medicare Reform.” Health Affairs supplemental web exclusive w96–114.
Wimer, Christopher, and Lucas Manfield. 2015. “Elderly Poverty in the United States in the 21st Century: Exploring the Role of Assets in the Supplemental Poverty Measure.” CRR Working Paper No. 2015-29. Chestnut Hill, MA: Center for Retirement Research, Boston College.
Wolff, Edward N. 1990. “Wealth Holdings and Poverty Status in the U.S.” Review of Income and Wealth 36(2): 143–165.
Zagorsky, Jay L. 2004–2005. “Measuring Poverty Using Both Income and Wealth.” Journal of Income Distribution 13(3–4): 22–40.