Annual Statistical Report on the Social Security Disability Insurance Program, 2002
Charts
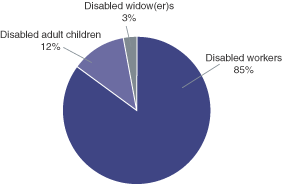
In December 2002, about 6.5 million people received disability benefits as disabled workers, disabled widow(er)s, or disabled adult children. The majority (85 percent) were disabled workers, 12 percent were disabled adult children, and 3 percent were disabled widow(er)s.
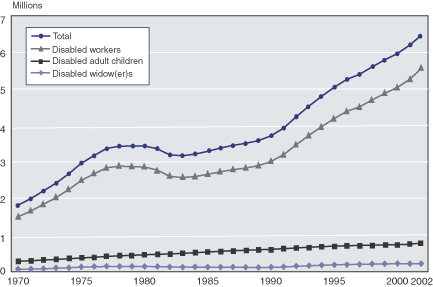
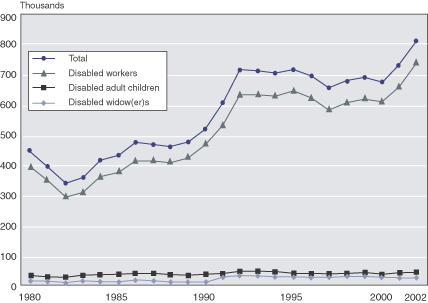
The number of disabled workers grew steadily until 1978, declined slightly until 1983, started to increase again in 1984, and began to increase more rapidly beginning in 1990. The growth in the 1980s and 1990s was the result of demographic changes, a recession, and legislative changes. The number of disabled adult children has grown slightly, and the number of disabled widow(er)s has remained fairly level. In 2002, over 5.5 million disabled workers, about 745,000 disabled adult children, and over 207,000 disabled widow(er)s received disability benefits.
| Year | Total | Disabled workers | Disabled widow(er)s | Disabled adult children |
|---|---|---|---|---|
| 1970 | 1.81 | 1.49 | 0.05 | 0.27 |
| 1971 | 1.99 | 1.65 | 0.06 | 0.29 |
| 1972 | 2.20 | 1.83 | 0.06 | 0.31 |
| 1973 | 2.42 | 2.02 | 0.08 | 0.32 |
| 1974 | 2.67 | 2.24 | 0.09 | 0.34 |
| 1975 | 2.96 | 2.49 | 0.11 | 0.36 |
| 1976 | 3.17 | 2.67 | 0.12 | 0.38 |
| 1977 | 3.37 | 2.84 | 0.13 | 0.40 |
| 1978 | 3.43 | 2.88 | 0.13 | 0.42 |
| 1979 | 3.44 | 2.87 | 0.13 | 0.44 |
| 1980 | 3.44 | 2.86 | 0.13 | 0.45 |
| 1981 | 3.36 | 2.78 | 0.12 | 0.46 |
| 1982 | 3.19 | 2.60 | 0.12 | 0.47 |
| 1983 | 3.17 | 2.57 | 0.11 | 0.49 |
| 1984 | 3.21 | 2.60 | 0.11 | 0.51 |
| 1985 | 3.29 | 2.66 | 0.11 | 0.53 |
| 1986 | 3.38 | 2.73 | 0.11 | 0.55 |
| 1987 | 3.45 | 2.79 | 0.11 | 0.56 |
| 1988 | 3.51 | 2.83 | 0.10 | 0.57 |
| 1989 | 3.58 | 2.90 | 0.10 | 0.59 |
| 1990 | 3.71 | 3.01 | 0.10 | 0.60 |
| 1991 | 3.93 | 3.19 | 0.11 | 0.62 |
| 1992 | 4.24 | 3.47 | 0.13 | 0.64 |
| 1993 | 4.53 | 3.73 | 0.15 | 0.66 |
| 1994 | 4.80 | 3.96 | 0.16 | 0.67 |
| 1995 | 5.04 | 4.19 | 0.17 | 0.69 |
| 1996 | 5.26 | 4.39 | 0.18 | 0.70 |
| 1997 | 5.40 | 4.51 | 0.19 | 0.70 |
| 1998 | 5.61 | 4.70 | 0.19 | 0.71 |
| 1999 | 5.80 | 4.88 | 0.20 | 0.72 |
| 2000 | 5.97 | 5.04 | 0.20 | 0.73 |
| 2001 | 6.21 | 5.27 | 0.20 | 0.74 |
| 2002 | 6.49 | 5.54 | 0.21 | 0.74 |
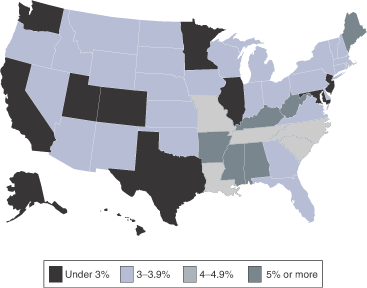
Disabled beneficiaries aged 18-64 in current payment status accounted for about 3.5 percent of the population aged 18-64 in the United States. In 12 states, they represented less than 3 percent of the state population. The states with the highest rates of disabled beneficiaries--5 percent or more--were Alabama, Arkansas, Kentucky, Maine, Mississippi, and West Virginia.
| State | Percent |
|---|---|
| United States | 3.5 |
| Alabama | 5.8 |
| Alaska | 2.2 |
| Arizona | 3.3 |
| Arkansas | 5.9 |
| California | 2.5 |
| Colorado | 2.4 |
| Connecticut | 3.2 |
| Delaware | 3.7 |
| District of Columbia | 2.6 |
| Florida | 3.8 |
| Georgia | 3.6 |
| Hawaii | 2.3 |
| Idaho | 3.2 |
| Illinois | 2.9 |
| Indiana | 3.7 |
| Iowa | 3.4 |
| Kansas | 3.1 |
| Kentucky | 6.0 |
| Louisiana | 4.3 |
| Maine | 5.3 |
| Maryland | 2.6 |
| Massachusetts | 3.7 |
| Michigan | 3.9 |
| Minnesota | 2.8 |
| Mississippi | 6.1 |
| Missouri | 4.4 |
| Montana | 3.6 |
| Nebraska | 3.1 |
| Nevada | 3.0 |
| New Hampshire | 3.6 |
| New Jersey | 2.9 |
| New Mexico | 3.6 |
| New York | 3.5 |
| North Carolina | 4.6 |
| North Dakota | 3.0 |
| Ohio | 3.6 |
| Oklahoma | 3.9 |
| Oregon | 3.2 |
| Pennsylvania | 3.8 |
| Rhode Island | 4.2 |
| South Carolina | 4.9 |
| South Dakota | 3.3 |
| Tennessee | 4.9 |
| Texas | 2.6 |
| Utah | 2.0 |
| Vermont | 3.9 |
| Virginia | 3.4 |
| Washington | 2.9 |
| West Virginia | 7.1 |
| Wisconsin | 3.2 |
| Wyoming | 3.0 |
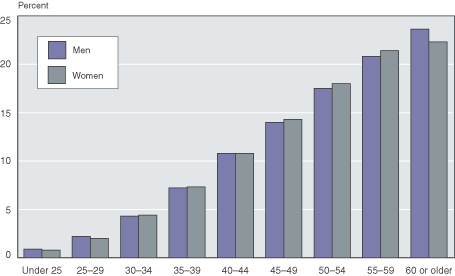
The percentage of disabled-worker beneficiaries increases with age for both men and women. In December 2002, the largest percentage of disabled-worker beneficiaries were aged 60 or older. Disability benefits convert to retirement benefits when the worker reaches full retirement age, which is ages 65-67 depending on the year of birth.
The average monthly benefit for disabled-worker beneficiaries is higher than that paid to disabled widow(er)s or disabled adult children. The reason for the difference is that disabled workers receive 100 percent of the primary insurance amount (PIA), compared with 71.5 percent for disabled widow(er)s and 50 percent for disabled adult children (if the worker is disabled or retired) or 75 percent (if the worker is deceased).
Because men have traditionally had higher earnings than women, their monthly benefit is higher. This is most obvious in the disabled-worker group. Benefits for disabled widow(er)s and disabled adult children are dependents' benefits, so their monthly benefit is a function of the worker's earnings. Therefore, a disabled widow's average benefit tends to be higher than that of a disabled widower because a male worker's earnings are higher than a female worker's. Benefit amounts are about the same for men and women in the disabled adult children group.
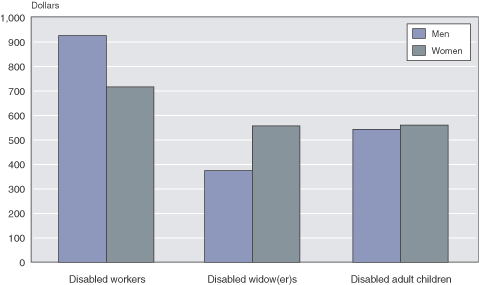
| Beneficiary | Men | Women |
|---|---|---|
| Disabled workers | 935.6 | 708.7 |
| Disabled widow(er)s | 384.7 | 553.0 |
| Disabled adult children | 548.1 | 553.2 |
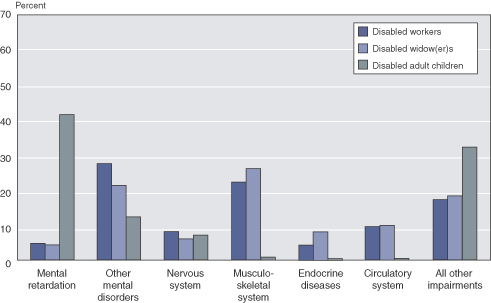
The impairment on which disability is based varies with the type of beneficiary. In December 2002, other mental disorders was the primary reason disabled workers received benefits; diseases of the musculoskeletal system was the leading cause of disability among disabled widow(er)s; and mental retardation was the predominant reason for disability among disabled adult children.
| Diagnostic group | Disabled workers |
Disabled widow(er)s |
Disabled adult children |
|---|---|---|---|
| Mental retardation | 5.2 | 4.7 | 43.6 |
| Other mental disorders | 28.1 | 21.8 | 13.0 |
| Nervous system and sense organs | 9.6 | 7.0 | 8.6 |
| Musculoskeletal system and connective tissue | 23.9 | 26.8 | 0.6 |
| Endocrine, nutritional, and metabolic diseases | 4.3 | 9.5 | 0.4 |
| Circulatory system | 10.1 | 10.8 | 0.4 |
| All other impairments | 18.9 | 19.4 | 33.2 |
The total number of awards decreased from 1980 through 1982, started to rise in 1983, and began to increase more rapidly in 1990. Awards for disabled-worker benefits have been most pronounced and drive the overall pattern shown in the total line. They increased from a low of 297,131 in 1982 to 636,637 in 1992, were relatively flat from 1992 through 2000, and started to increase again in 2001. There were 730,383 worker awards in 2002. Other awards have risen at a much slower rate. Awards to disabled adult children have gradually increased from 33,470 in 1980 to 46,589 in 2002. Awards to disabled widow(er)s have risen from just over 16,000 in 1980 to 28,339 in 2002.
| Year | Total | Disabled workers | Disabled widow(er)s | Disabled adult children |
|---|---|---|---|---|
| 1980 | 446.08 | 397.00 | 16.00 | 33.00 |
| 1981 | 396.55 | 352.00 | 14.00 | 31.00 |
| 1982 | 338.28 | 297.00 | 12.00 | 29.00 |
| 1983 | 359.60 | 312.00 | 14.00 | 34.00 |
| 1984 | 415.59 | 362.00 | 17.00 | 36.00 |
| 1985 | 433.54 | 377.00 | 17.00 | 39.00 |
| 1986 | 475.81 | 417.00 | 18.00 | 41.00 |
| 1987 | 471.91 | 416.00 | 16.00 | 40.00 |
| 1988 | 463.52 | 409.00 | 15.00 | 39.00 |
| 1989 | 477.75 | 426.00 | 15.00 | 37.00 |
| 1990 | 522.17 | 468.00 | 15.00 | 39.00 |
| 1991 | 607.11 | 536.00 | 30.00 | 41.00 |
| 1992 | 716.88 | 637.00 | 33.00 | 47.00 |
| 1993 | 714.32 | 635.00 | 32.00 | 47.00 |
| 1994 | 706.26 | 632.00 | 30.00 | 44.00 |
| 1995 | 718.70 | 646.00 | 30.00 | 43.00 |
| 1996 | 693.53 | 624.00 | 29.00 | 41.00 |
| 1997 | 654.66 | 587.00 | 29.00 | 39.00 |
| 1998 | 677.47 | 608.00 | 29.00 | 40.00 |
| 1989 | 691.89 | 620.00 | 30.00 | 42.00 |
| 2000 | 675.60 | 611.00 | 28.00 | 37.00 |
| 2001 | 732.70 | 662.00 | 27.00 | 44.00 |
| 2002 | 805.31 | 730.00 | 28.00 | 47.00 |
Average monthly benefits for new awards tend to be higher than those paid to beneficiaries who are already on the rolls (see Chart 5). The exception is payments to newly awarded adult children, whose benefits are slightly lower than those paid to adult children who are already on the rolls.
The average monthly benefit awarded to disabled workers is higher than that awarded to disabled widow(er)s or disabled adult children. The reason for the difference is that disabled workers receive 100 percent of the primary insurance amount, compared with 71.5 percent for disabled widow(er)s and 50 percent for disabled adult children (if the worker is disabled or retired) or 75 percent (if the worker is deceased).
Because men have traditionally had higher earnings than women, their monthly benefit is higher. This is most obvious in the disabled-worker group. Benefits for disabled widow(er)s and disabled adult children are dependents' benefits, so their monthly benefit is a function of the worker's earnings. Therefore, a disabled widow's average benefit tends to be higher than that of a disabled widower because a male worker's earnings are higher than a female worker's. Benefit amounts are about the same for men and women in the disabled adult children group.
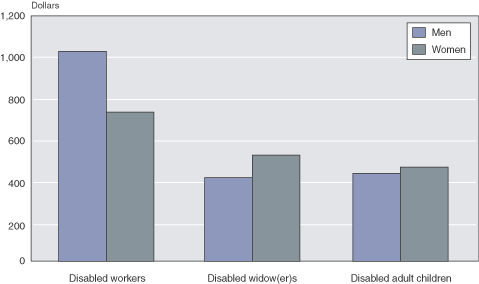
| Beneficiary | Men | Women |
|---|---|---|
| Disabled workers | 1,021.70 | 753.90 |
| Disabled widow(er)s | 411.40 | 572.20 |
| Disabled adult children | 425.40 | 434.00 |
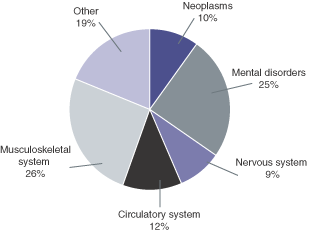
In 2002, 730,383 disabled workers were awarded benefits. The primary impairment was diseases of the musculoskeletal system and connective tissue (26 percent), 25 percent had a mental disorder, 12 percent had circulatory problems, 10 percent had neoplasms, 9 percent had a disease of the nervous system or sense organs, and 19 percent had other impairments.
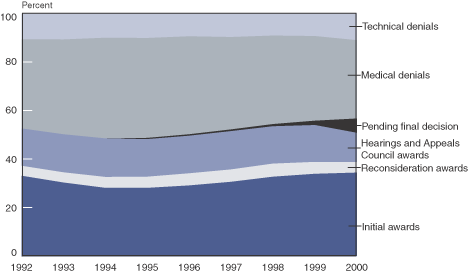
The final award rate for disabled-worker applicants has varied over time, averaging about 51 percent for claims filed from 1992 through 2000. The percentage of applicants awarded benefits at the initial claims level averaged 31 percent over the same period and ranged from a high of about 34 percent to a low of 28 percent. The percentages of applicants awarded at the reconsideration and hearing levels are relatively constant, averaging 5 percent and 15 percent, respectively. Denied disability claims have averaged about 48 percent.
| Year | Technical denials |
Medical denials |
Pending final decision |
Hearings and Appeals Council awards |
Reconsideration awards |
Initial awards |
|---|---|---|---|---|---|---|
| 1992 | 10.6 | 36.8 | 0.0 | 15.4 | 4.1 | 33.1 |
| 1993 | 10.7 | 39.1 | 0.0 | 15.7 | 4.2 | 30.3 |
| 1994 | 10.0 | 41.4 | 0.0 | 15.9 | 4.5 | 28.1 |
| 1995 | 10.1 | 41.7 | 0.0 | 15.6 | 4.6 | 28.1 |
| 1996 | 9.4 | 40.5 | 0.5 | 15.5 | 5.0 | 29.1 |
| 1997 | 9.7 | 38.2 | 0.5 | 15.9 | 5.1 | 30.6 |
| 1998 | 9.0 | 36.8 | 0.4 | 15.6 | 5.4 | 32.7 |
| 1999 | 9.3 | 35.5 | 0.7 | 15.7 | 4.9 | 33.9 |
| 2000 | 11.0 | 33.3 | 1.7 | 15.2 | 4.4 | 34.4 |
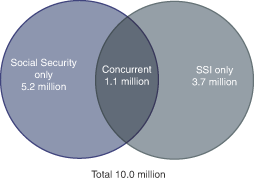
In December 2002, about 10 million people under age 65 received benefits on the basis of disability. About 52 percent (5.2 million persons) received benefits from the Social Security program only, 37 percent (3.7 million persons) received benefits from SSI only, and 11 percent (1.1 million persons) received benefits from both programs. This total excludes 65,456 disabled adult children and 743,800 blind and disabled SSI recipients who are aged 65 or older.
Disabled workers have varying levels of education and tend to be less educated than the general U.S. population. Twenty-five percent of disabled-worker beneficiaries have less than a high school education, 39 percent have a high school education, 27 percent have some college education, and 9 percent have a college or postgraduate level of education.
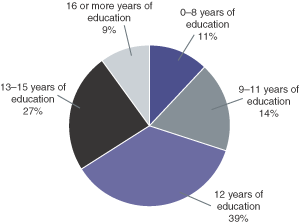
| Education level | Percent |
|---|---|
| 0–8 years of education | 11 |
| 9–11 years of education | 14 |
| 12 years of education | 39 |
| 13–15 years of education | 27 |
| 16 or more years of education | 9 |
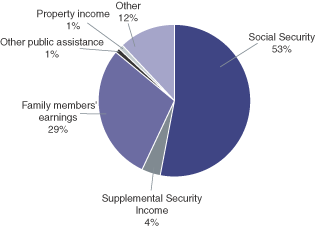
Social Security benefits are the primary source of income for disabled-worker families. About 53 percent of their income comes from Social Security, 29 percent from family members' earnings, 4 percent from Supplemental Security Income, and only 1 percent from other public assistance.