Annual Statistical Report on the Social Security Disability Insurance Program, 2025
Beneficiaries Who Have Filed for Workers' Compensation or Public Disability Benefits
In December 2025, approximately 337,000 disabled workers on the Social Security Disability Insurance program had filed for workers' compensation or public disability benefits. Disability payments from private sources, such as private pension or insurance benefits, do not affect Social Security disability benefits, but workers' compensation and other public disability benefits may reduce them. Workers' compensation is paid to a worker because of a job-related injury or illness. It may be paid by federal or state workers' compensation agencies or employers or by insurance companies on behalf of employers.
Other public disability benefits that may affect Social Security disability benefits are those paid by a federal, state, or local government for disabling medical conditions that are not job related. Examples are civil service disability benefits, military disability benefits, state temporary disability benefits, and state or local government retirement benefits that are based on disability. Persons who receive Social Security disability benefits and one of the following types of public benefits will not have their Social Security disability benefit reduced:
- Veterans Administration benefits;
- State and local government benefits, if Social Security taxes were deducted from earnings; or
- Supplemental Security Income.
The total amount received from workers' compensation or other public disability benefits and Social Security disability benefits cannot exceed 80 percent of the worker's average current earnings before he or she became disabled. The monthly Social Security disability benefit includes benefits payable to family members. If the total amount of these benefits exceeds 80 percent of average current earnings, the excess amount is deducted from the Social Security benefit. The benefit is reduced until the month the worker reaches full retirement age or the month the other benefits stop, whichever comes first.
Example
Before becoming disabled, the worker's average current earnings were $4,000 a month. The disabled worker, his or her spouse, and their two children would be eligible to receive a total of $2,200 a month in Social Security disability benefits. However, the disabled worker also receives $2,000 a month from workers' compensation. Because the total amount of benefits received ($4,200) is more than $3,200 (80 percent of average current earnings), the family's Social Security disability benefits will be reduced by $1,000.
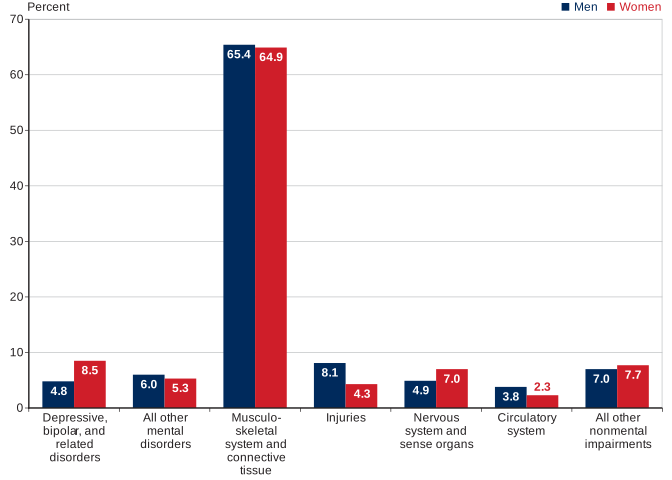
Among disabled workers who are also receiving workers' compensation or public disability benefits, a disease of the musculoskeletal system and connective tissue was the primary diagnosis in December 2025. Depressive, bipolar, and related disorders were the second leading disabling condition for women. Injuries were the second leading disabling condition for men. A disorder of the nervous system and sense organs was the third most common disability. All other impairments were fairly evenly split between men and women.
| Diagnostic group | Men | Women |
|---|---|---|
| Depressive, bipolar, and related disorders | 4.8 | 8.5 |
| All other mental disorders | 6.0 | 5.3 |
| Musculoskeletal system and connective tissue | 65.4 | 64.9 |
| Injuries | 8.1 | 4.3 |
| Nervous system and sense organs | 4.9 | 7.0 |
| Circulatory system | 3.8 | 2.3 |
| All other nonmental impairments | 7.0 | 7.7 |
| Reason | Total | Workers | Spouses and children | |||
|---|---|---|---|---|---|---|
| Number | Percent | Number | Percent | Number | Percent | |
| All disabled beneficiaries and dependents | 386,221 | 100.0 | 337,364 | 100.0 | 48,857 | 100.0 |
| With offset | ||||||
| Receipt of— | ||||||
| Workers' compensation only | ||||||
| Black Lung | 280 | 0.1 | 201 | 0.1 | 79 | 0.2 |
| Harbor Workers and Longshoremen | 159 | (L) | 124 | (L) | 35 | 0.1 |
| Federal employees | 3,138 | 0.8 | 2,738 | 0.8 | 400 | 0.8 |
| State | 46,940 | 12.2 | 37,778 | 11.2 | 9,162 | 18.8 |
| Public disability only | ||||||
| Federal | 236 | 0.1 | 208 | 0.1 | 28 | 0.1 |
| State | 8,231 | 2.1 | 7,195 | 2.1 | 1,036 | 2.1 |
| Local | 405 | 0.1 | 344 | 0.1 | 61 | 0.1 |
| Workers' compensation and public disability | 387 | 0.1 | 337 | 0.1 | 50 | 0.1 |
| Social Security Disability Insurance (reverse offset) | 24,738 | 6.4 | 21,500 | 6.4 | 3,238 | 6.6 |
| Without offset | ||||||
| High average current earnings | 254,157 | 65.8 | 224,427 | 66.5 | 29,730 | 60.9 |
| Entitlement to workers' compensation or public disability benefits is pending | 47,550 | 12.3 | 42,512 | 12.6 | 5,038 | 10.3 |
| SOURCE: Social Security Administration, Workers' Compensation and Public Disability Benefit file, 100 percent data. | ||||||
| NOTE: (L) = less than 0.05 percent. | ||||||
| CONTACT: statistics@ssa.gov. | ||||||
| State or area | Total | Workers | Spouses and children | |||
|---|---|---|---|---|---|---|
| Number | Percent | Number | Percent | Number | Percent | |
| All areas | 386,221 | 100.0 | 337,364 | 100.0 | 48,857 | 100.0 |
| Alabama | 6,864 | 1.8 | 5,821 | 1.7 | 1,043 | 2.1 |
| Alaska | 228 | 0.1 | 209 | 0.1 | 19 | (L) |
| Arizona | 4,666 | 1.2 | 4,116 | 1.2 | 550 | 1.1 |
| Arkansas | 3,241 | 0.8 | 2,779 | 0.8 | 462 | 0.9 |
| California | 44,460 | 11.5 | 39,598 | 11.7 | 4,862 | 10.0 |
| Colorado | 3,799 | 1.0 | 3,385 | 1.0 | 414 | 0.8 |
| Connecticut | 3,875 | 1.0 | 3,422 | 1.0 | 453 | 0.9 |
| Delaware | 1,338 | 0.3 | 1,201 | 0.4 | 137 | 0.3 |
| District of Columbia | 170 | (L) | 162 | (L) | 8 | (L) |
| Florida | 19,972 | 5.2 | 17,525 | 5.2 | 2,447 | 5.0 |
| Georgia | 13,828 | 3.6 | 12,121 | 3.6 | 1,707 | 3.5 |
| Hawaii | 1,167 | 0.3 | 991 | 0.3 | 176 | 0.4 |
| Idaho | 1,657 | 0.4 | 1,446 | 0.4 | 211 | 0.4 |
| Illinois | 11,144 | 2.9 | 9,749 | 2.9 | 1,395 | 2.9 |
| Indiana | 3,294 | 0.9 | 2,847 | 0.8 | 447 | 0.9 |
| Iowa | 3,342 | 0.9 | 2,944 | 0.9 | 398 | 0.8 |
| Kansas | 1,769 | 0.5 | 1,500 | 0.4 | 269 | 0.6 |
| Kentucky | 8,994 | 2.3 | 7,613 | 2.3 | 1,381 | 2.8 |
| Louisiana | 5,384 | 1.4 | 4,571 | 1.4 | 813 | 1.7 |
| Maine | 3,263 | 0.8 | 2,874 | 0.9 | 389 | 0.8 |
| Maryland | 2,868 | 0.7 | 2,559 | 0.8 | 309 | 0.6 |
| Massachusetts | 11,866 | 3.1 | 10,300 | 3.1 | 1,566 | 3.2 |
| Michigan | 17,065 | 4.4 | 14,701 | 4.4 | 2,364 | 4.8 |
| Minnesota | 5,519 | 1.4 | 4,840 | 1.4 | 679 | 1.4 |
| Mississippi | 3,769 | 1.0 | 3,186 | 0.9 | 583 | 1.2 |
| Missouri | 6,420 | 1.7 | 5,635 | 1.7 | 785 | 1.6 |
| Montana | 1,106 | 0.3 | 989 | 0.3 | 117 | 0.2 |
| Nebraska | 1,012 | 0.3 | 899 | 0.3 | 113 | 0.2 |
| Nevada | 2,207 | 0.6 | 2,001 | 0.6 | 206 | 0.4 |
| New Hampshire | 2,641 | 0.7 | 2,312 | 0.7 | 329 | 0.7 |
| New Jersey | 9,181 | 2.4 | 7,911 | 2.3 | 1,270 | 2.6 |
| New Mexico | 1,820 | 0.5 | 1,626 | 0.5 | 194 | 0.4 |
| New York | 52,597 | 13.6 | 45,461 | 13.5 | 7,136 | 14.6 |
| North Carolina | 16,452 | 4.3 | 14,527 | 4.3 | 1,925 | 3.9 |
| North Dakota | 393 | 0.1 | 351 | 0.1 | 42 | 0.1 |
| Ohio | 8,977 | 2.3 | 7,949 | 2.4 | 1,028 | 2.1 |
| Oklahoma | 4,243 | 1.1 | 3,749 | 1.1 | 494 | 1.0 |
| Oregon | 3,678 | 1.0 | 3,272 | 1.0 | 406 | 0.8 |
| Pennsylvania | 27,597 | 7.1 | 24,145 | 7.2 | 3,452 | 7.1 |
| Rhode Island | 2,227 | 0.6 | 1,945 | 0.6 | 282 | 0.6 |
| South Carolina | 10,189 | 2.6 | 8,961 | 2.7 | 1,228 | 2.5 |
| South Dakota | 622 | 0.2 | 546 | 0.2 | 76 | 0.2 |
| Tennessee | 8,080 | 2.1 | 7,041 | 2.1 | 1,039 | 2.1 |
| Texas | 6,997 | 1.8 | 5,990 | 1.8 | 1,007 | 2.1 |
| Utah | 939 | 0.2 | 808 | 0.2 | 131 | 0.3 |
| Vermont | 853 | 0.2 | 733 | 0.2 | 120 | 0.2 |
| Virginia | 6,811 | 1.8 | 5,903 | 1.7 | 908 | 1.9 |
| Washington | 6,622 | 1.7 | 5,848 | 1.7 | 774 | 1.6 |
| West Virginia | 2,628 | 0.7 | 2,172 | 0.6 | 456 | 0.9 |
| Wisconsin | 5,671 | 1.5 | 4,941 | 1.5 | 730 | 1.5 |
| Wyoming | 427 | 0.1 | 369 | 0.1 | 58 | 0.1 |
| Outlying areas | ||||||
| Puerto Rico | 11,515 | 3.0 | 10,234 | 3.0 | 1,281 | 2.6 |
| Other a | 57 | (L) | 47 | (L) | 10 | (L) |
| Foreign countries | 717 | 0.2 | 539 | 0.2 | 178 | 0.4 |
| SOURCE: Social Security Administration, Workers' Compensation and Public Disability Benefit file, 100 percent data. | ||||||
| NOTES: Distribution is by state or other area of residence, not by the state paying benefits. | ||||||
| (L) = less than 0.05 percent. | ||||||
| a. Includes American Samoa, Guam, Northern Mariana Islands, and U.S. Virgin Islands. | ||||||
| CONTACT: statistics@ssa.gov. | ||||||
| Diagnostic group | Total, all ages | Under 35 | 35–39 | 40–44 | 45–49 | 50–54 | 55–59 | 60–FRA |
|---|---|---|---|---|---|---|---|---|
| Number | ||||||||
| Total | 337,364 | 2,326 | 3,187 | 7,378 | 15,094 | 34,055 | 79,479 | 195,845 |
| Congenital anomalies | 194 | 8 | 4 | 9 | 9 | 34 | 40 | 90 |
| Endocrine, nutritional, and metabolic diseases | 3,413 | 21 | 29 | 73 | 118 | 357 | 849 | 1,966 |
| Infectious and parasitic diseases | 1,420 | 15 | 18 | 23 | 61 | 136 | 295 | 872 |
| Injuries | 22,261 | 309 | 382 | 885 | 1,316 | 2,486 | 5,139 | 11,744 |
| Mental disorders | ||||||||
| Autism spectrum disorders | 71 | (X) | (X) | (X) | 5 | 7 | 6 | 10 |
| Developmental disorders | 66 | 6 | 5 | 4 | 4 | 4 | 14 | 29 |
| Childhood and adolescent disorders not elsewhere classified | 30 | (X) | (X) | (X) | 5 | 7 | 4 | 7 |
| Intellectual disorders | 1,797 | 43 | 24 | 54 | 89 | 166 | 459 | 962 |
| Depressive, bipolar, and related disorders | 21,001 | 192 | 202 | 545 | 1,056 | 2,426 | 4,903 | 11,677 |
| Neurocognitive disorders | 6,640 | 77 | 139 | 284 | 476 | 820 | 1,546 | 3,298 |
| Schizophrenia spectrum and other psychotic disorders | 3,117 | 235 | 116 | 190 | 262 | 344 | 627 | 1,343 |
| Other mental disorders | 7,663 | 141 | 214 | 392 | 713 | 1,023 | 1,779 | 3,401 |
| Neoplasms | 5,528 | 139 | 115 | 201 | 347 | 695 | 1,230 | 2,801 |
| Diseases of the— | ||||||||
| Blood and blood-forming organs | 257 | 17 | 6 | 13 | 27 | 31 | 53 | 110 |
| Circulatory system | 10,751 | 68 | 95 | 168 | 408 | 979 | 2,604 | 6,429 |
| Digestive system | 1,764 | 27 | 37 | 89 | 117 | 194 | 409 | 891 |
| Genitourinary system | 2,830 | 132 | 111 | 158 | 250 | 425 | 705 | 1,049 |
| Musculoskeletal system and connective tissue | 220,073 | 400 | 1,178 | 3,309 | 8,026 | 20,764 | 52,360 | 134,036 |
| Nervous system and sense organs | 19,343 | 385 | 398 | 742 | 1,331 | 2,192 | 4,364 | 9,931 |
| Respiratory system | 4,818 | 22 | 29 | 77 | 172 | 428 | 1,118 | 2,972 |
| Skin and subcutaneous tissue | 307 | 5 | 10 | 16 | 24 | 32 | 58 | 162 |
| Other | 171 | 3 | 6 | 4 | 15 | 24 | 42 | 77 |
| Unknown | 3,849 | 45 | 60 | 137 | 263 | 481 | 875 | 1,988 |
| Percent | ||||||||
| Total | 100.0 | 100.0 | 100.0 | 100.0 | 100.0 | 100.0 | 100.0 | 100.0 |
| Congenital anomalies | 0.1 | 0.3 | 0.1 | 0.1 | 0.1 | 0.1 | 0.1 | (L) |
| Endocrine, nutritional, and metabolic diseases | 1.0 | 0.9 | 0.9 | 1.0 | 0.8 | 1.0 | 1.1 | 1.0 |
| Infectious and parasitic diseases | 0.4 | 0.6 | 0.6 | 0.3 | 0.4 | 0.4 | 0.4 | 0.4 |
| Injuries | 6.6 | 13.3 | 12.0 | 12.0 | 8.7 | 7.3 | 6.5 | 6.0 |
| Mental disorders | ||||||||
| Autism spectrum disorders | (L) | (X) | (X) | (X) | (L) | (L) | (L) | (L) |
| Developmental disorders | (L) | 0.3 | 0.2 | 0.1 | (L) | (L) | (L) | (L) |
| Childhood and adolescent disorders not elsewhere classified | (L) | (X) | (X) | (X) | (L) | (L) | (L) | (L) |
| Intellectual disorders | 0.5 | 1.8 | 0.8 | 0.7 | 0.6 | 0.5 | 0.6 | 0.5 |
| Depressive, bipolar, and related disorders | 6.2 | 8.3 | 6.3 | 7.4 | 7.0 | 7.1 | 6.2 | 6.0 |
| Neurocognitive disorders | 2.0 | 3.3 | 4.4 | 3.8 | 3.2 | 2.4 | 1.9 | 1.7 |
| Schizophrenia spectrum and other psychotic disorders | 0.9 | 10.1 | 3.6 | 2.6 | 1.7 | 1.0 | 0.8 | 0.7 |
| Other mental disorders | 2.3 | 6.1 | 6.7 | 5.3 | 4.7 | 3.0 | 2.2 | 1.7 |
| Neoplasms | 1.6 | 6.0 | 3.6 | 2.7 | 2.3 | 2.0 | 1.5 | 1.4 |
| Diseases of the— | ||||||||
| Blood and blood-forming organs | 0.1 | 0.7 | 0.2 | 0.2 | 0.2 | 0.1 | 0.1 | 0.1 |
| Circulatory system | 3.2 | 2.9 | 3.0 | 2.3 | 2.7 | 2.9 | 3.3 | 3.3 |
| Digestive system | 0.5 | 1.2 | 1.2 | 1.2 | 0.8 | 0.6 | 0.5 | 0.5 |
| Genitourinary system | 0.8 | 5.7 | 3.5 | 2.1 | 1.7 | 1.2 | 0.9 | 0.5 |
| Musculoskeletal system and connective tissue | 65.2 | 17.2 | 37.0 | 44.8 | 53.2 | 61.0 | 65.9 | 68.4 |
| Nervous system and sense organs | 5.7 | 16.6 | 12.5 | 10.1 | 8.8 | 6.4 | 5.5 | 5.1 |
| Respiratory system | 1.4 | 0.9 | 0.9 | 1.0 | 1.1 | 1.3 | 1.4 | 1.5 |
| Skin and subcutaneous tissue | 0.1 | 0.2 | 0.3 | 0.2 | 0.2 | 0.1 | 0.1 | 0.1 |
| Other | 0.1 | 0.1 | 0.2 | 0.1 | 0.1 | 0.1 | 0.1 | (L) |
| Unknown | 1.1 | 1.9 | 1.9 | 1.9 | 1.7 | 1.4 | 1.1 | 1.0 |
| SOURCE: Social Security Administration, Workers' Compensation and Public Disability Benefit file, 100 percent data. | ||||||||
| NOTE: FRA = full retirement age; (L) = less than 0.05 percent; (X) = suppressed to avoid disclosing information about particular individuals. | ||||||||
| CONTACT: statistics@ssa.gov. | ||||||||
| Diagnostic group | Total | Men | Women | |||
|---|---|---|---|---|---|---|
| Number | Percent | Number | Percent | Number | Percent | |
| All disabled workers | 337,364 | 100.0 | 204,639 | 100.0 | 132,725 | 100.0 |
| Congenital anomalies | 194 | 0.1 | 112 | 0.1 | 82 | 0.1 |
| Endocrine, nutritional, and metabolic diseases | 3,413 | 1.0 | 1,901 | 0.9 | 1,512 | 1.1 |
| Infectious and parasitic diseases | 1,420 | 0.4 | 1,108 | 0.5 | 312 | 0.2 |
| Injuries | 22,261 | 6.6 | 16,519 | 8.1 | 5,742 | 4.3 |
| Mental disorders | ||||||
| Autism spectrum disorders | 71 | (L) | 58 | (L) | 13 | (L) |
| Developmental disorders | 66 | (L) | 41 | (L) | 25 | (L) |
| Childhood and adolescent disorders not elsewhere classified | 30 | (L) | 22 | (L) | 8 | (L) |
| Intellectual disorders | 1,797 | 0.5 | 1,325 | 0.6 | 472 | 0.4 |
| Depressive, bipolar, and related disorders | 21,001 | 6.2 | 9,755 | 4.8 | 11,246 | 8.5 |
| Neurocognitive disorders | 6,640 | 2.0 | 4,837 | 2.4 | 1,803 | 1.4 |
| Schizophrenia spectrum and other psychotic disorders | 3,117 | 0.9 | 2,063 | 1.0 | 1,054 | 0.8 |
| Other mental disorders | 7,663 | 2.3 | 3,989 | 1.9 | 3,674 | 2.8 |
| Neoplasms | 5,528 | 1.6 | 2,882 | 1.4 | 2,646 | 2.0 |
| Diseases of the— | ||||||
| Blood and blood-forming organs | 257 | 0.1 | 138 | 0.1 | 119 | 0.1 |
| Circulatory system | 10,751 | 3.2 | 7,755 | 3.8 | 2,996 | 2.3 |
| Digestive system | 1,764 | 0.5 | 1,069 | 0.5 | 695 | 0.5 |
| Genitourinary system | 2,830 | 0.8 | 1,931 | 0.9 | 899 | 0.7 |
| Musculoskeletal system and connective tissue | 220,073 | 65.2 | 133,869 | 65.4 | 86,204 | 64.9 |
| Nervous system and sense organs | 19,343 | 5.7 | 10,069 | 4.9 | 9,274 | 7.0 |
| Respiratory system | 4,818 | 1.4 | 2,857 | 1.4 | 1,961 | 1.5 |
| Skin and subcutaneous tissue | 307 | 0.1 | 161 | 0.1 | 146 | 0.1 |
| Other | 171 | 0.1 | 98 | (L) | 73 | 0.1 |
| Unknown | 3,849 | 1.1 | 2,080 | 1.0 | 1,769 | 1.3 |
| SOURCE: Social Security Administration, Workers' Compensation and Public Disability Benefit file, 100 percent data. | ||||||
| NOTE: (L) = less than 0.05 percent. | ||||||
| CONTACT: statistics@ssa.gov. | ||||||