Analysis of Benefit Estimates Shown in the Social Security Statement
The Social Security Statement is one of the Social Security Administration's (SSA's) most important ways to communicate with the public. Because a worker's complete lifetime earnings are unknown at the time his or her Statement is prepared, SSA estimates his or her future benefits by using the worker's historical earnings to project future earnings until retirement. Prior literature has examined the accuracy of benefit estimates shown in the Statement; however, there have not been efforts to test the accuracy of alternative methods of estimating retirement benefits. This paper documents a study by SSA's Office of Retirement and Disability Policy of the accuracy of the current Statement estimation method, the current method's assumption that 2 years of zero earnings predict no future earnings, and the accuracy of potential alternative methods of projecting earnings and benefits. Using administrative data from the Continuous Work History Sample (CWHS), the paper finds that the Statement's current estimation method performs as well as or better than any of the other methods tested. The paper concludes with recommendations for the Social Security Statement.
This Briefing Paper includes contributions from Gayle Reznik, Brian Alleva, Jae Song, Mark Sarney, and Anya Olsen, with helpful comments from Glenn Springstead, Barbara Smith, Jason Fichtner, and the Office of the Chief Actuary.
Briefing papers are unedited papers prepared to answer questions from Social Security Administration (SSA) senior managers and inform them on Social Security–related topics. The findings and conclusions presented do not necessarily represent the views of SSA.
Introduction
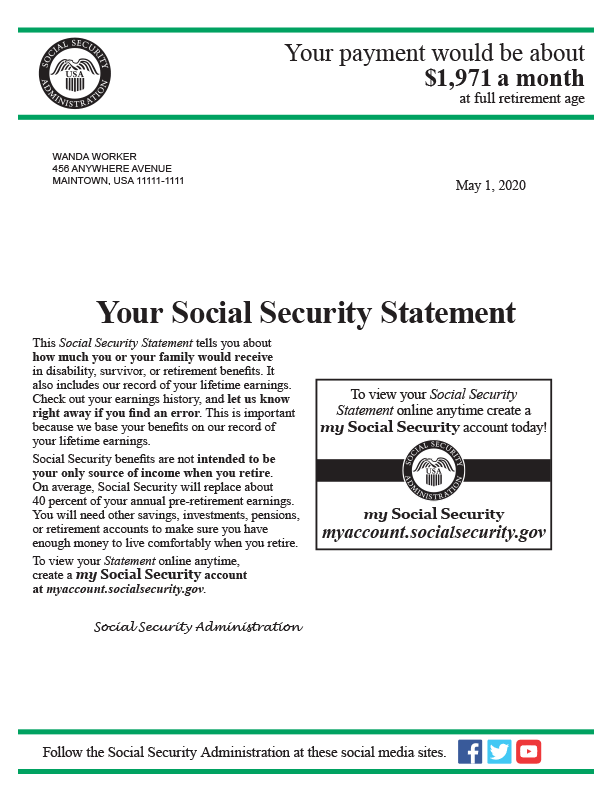
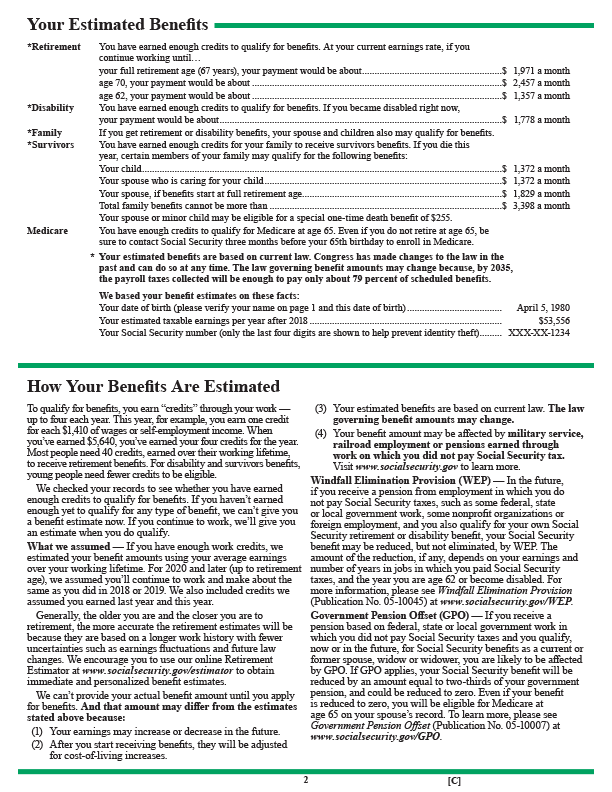
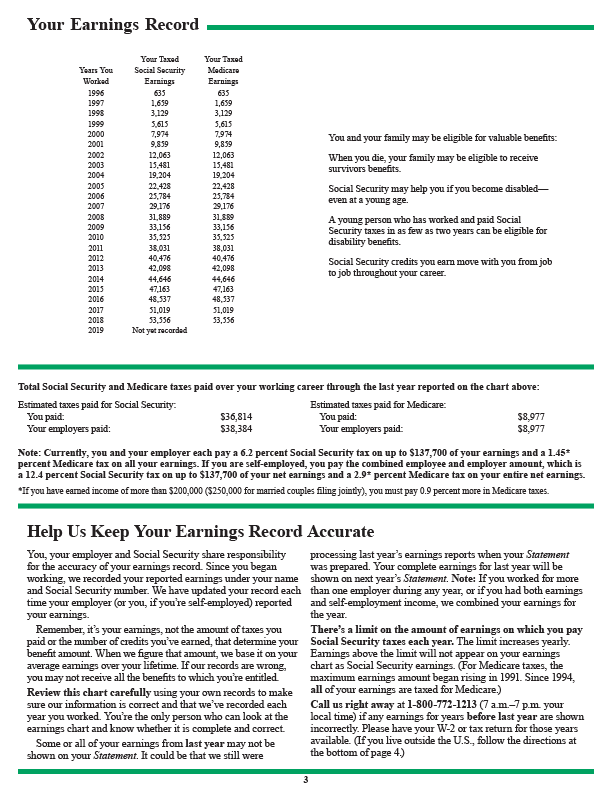
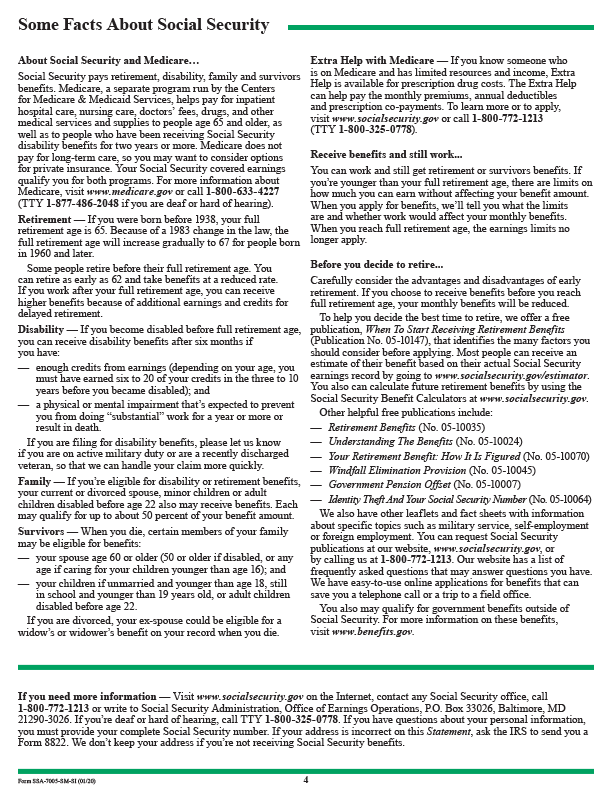
The Social Security Statement is one of the Social Security Administration's (SSA's) most important ways to communicate with the public. The Statement provides millions of American workers with their earnings record; their estimated retirement and disability benefits; their dependents' estimated survivor benefits; and general program information. The Statement has three main purposes: to inform workers about their Social Security benefits, to help workers plan for their financial future, and to ensure that workers' earnings records are accurate. The agency mails about 15 million paper Statements annually to individuals aged 60 or older who are not receiving benefits and do not have an online my Social Security account. The Statement is available online to individuals aged 18 or older who set up a my Social Security account.1 As of June 2020, more than 50 million individuals have established online accounts.
Since the agency began mailing the Statement in 1995, it has undergone a number of minor changes in appearance and content (Smith and Couch 2014). While the Statement has changed slightly to reflect updated information, SSA also has received a number of suggestions on how to improve the Statement from oversight entities including the Government Accountability Office (GAO) and the Social Security Advisory Board (SSAB). For example, GAO (2005) suggested showing the personalized benefit information first, using graphics to aid reader comprehension, and providing information to help recipients understand Social Security's contribution to their retirement income. SSAB (2009) suggested a number of enhancements to the Statement, including ways to improve the appearance (presenting more white space, more graphics, and less text), language (using less bureaucratic and more neutral language), and benefit estimates (improving the retired-worker benefit estimates particularly for younger workers, women, and lower-income workers). In particular, SSAB (2009) recommended that SSA “consider experimenting with and evaluating alternative assumptions and projection methods, including those used by the Office of the Chief Actuary in projecting future benefits for the Trustees Report.”
SSA's Agency Strategic Plan for fiscal years 2018–2022 includes an objective to “modernize the Social Security Statement to increase the public's understanding of our programs” (SSA 2018). Toward that objective, the agency's Office of Retirement and Disability Policy (ORDP) responded to SSAB's recommendation to experiment with and evaluate alternative assumptions and projection methods in hopes of improving the benefit estimates in the Statement. ORDP completed a number of analyses to assess the accuracy of the current Statement estimation method and to evaluate alternative assumptions and projection methods.
This Briefing Paper begins with a description of the current method the agency uses to estimate future benefits for the Statement and then briefly reviews previous studies that have assessed earnings projections and benefit estimates in the Statement. It then describes the data source used for the ORDP study, the Continuous Work History Sample (CWHS), and each of the three analyses ORDP conducted. These analyses comprise an examination of earnings among workers with 2 consecutive years of zero earnings, an evaluation of the accuracy of the current Statement estimation method, and an attempt to find an alternative projection methodology that would improve the accuracy of the retirement benefit estimate. These alternatives included looking back at more than the 2 most recent years for earnings, assuming no future earnings, using scaled-worker earnings profiles, using machine-learning computer modeling methods, and using complex regression models. The paper concludes with a summary of ORDP's findings and possible next steps the agency could take to improve the public's understanding of their future benefit estimates.
Current Statement Method of Estimating Benefits
The Statement provides personalized estimates of future retirement benefits for fully insured workers; that is, workers who have earned 40 credits in Social Security–covered work. Covered employment refers to jobs for which employers submit payroll-tax deductions to the Internal Revenue Service (IRS) and report annual wages to SSA to determine a worker's eligibility for Social Security benefits and the amount of those benefits. Taxable wages are wage and salary earnings in covered employment equal to or less than an annually adjusted threshold amount called the taxable maximum.2 In 2020, a worker earns one credit for each $1,410 of wages or self-employment income in Social Security–covered work, up to a maximum of four credits each year.3
SSA estimates future benefits according to current Social Security program and benefit-calculation rules. Social Security benefits are based on a worker's lifetime earnings in Social Security–covered employment. The benefit computation accounts for covered earnings up to each year's maximum taxable amount. Annual earnings are indexed—based on the national average wage index (AWI)—to the year the worker reaches age 60, 2 years before the age of first eligibility, to ensure that benefits reflect the general rise in the standard of living that occurred during the worker's career.4 The highest 35 years of wage-indexed earnings are averaged to compute the worker's average indexed monthly earnings (AIME) and then the worker's AIME is used to calculate the primary insurance amount (PIA).5 The PIA is the initial benefit amount before any adjustments for either early or delayed retirement, subsequent cost-of-living adjustments, or other offsets such as the retirement earnings test or Government Pension Offset.
Because a worker's complete lifetime earnings are unknown until the worker applies for Social Security benefits, SSA estimates benefits for the Statement by projecting the worker's future earnings until retirement.6 SSA uses the worker's past earnings (wage-indexed to the year 2 years prior to Statement receipt) to project future earnings by assuming that the worker continues to earn the same amount as in the year prior to the year of Statement receipt. If there were no earnings in the prior year, then SSA assumes that future earnings are the same as the earnings in the year 2 years prior to the year of Statement receipt. If there were no earnings in both of the 2 years prior to the year of Statement receipt, then SSA assumes no future earnings. For example, consider Jane, a worker with earnings in 2019 of $50,000. For her 2020 Statement, SSA estimates her future benefits by assuming she earns $50,000 in 2020, 2021, and all future years until retirement. If Jane had no earnings in 2019, then SSA assumes that her future earnings will be the same as her earnings in 2018 (2 years prior to her year of Statement receipt). If Jane had no earnings in both of the 2 years prior to Statement receipt, then SSA estimates her benefits assuming that she will have no future earnings. In other words, if Jane did not have any earnings in 2018 and 2019, then the benefit estimate in her 2020 Statement is based on the assumption that she earns $0 in 2020, 2021, and all future years until retirement.
The Statement emphasizes that the actual benefit a worker will receive may differ from the estimated benefit because of a number of factors. In the Statement's own wording (see Appendix A),
The actual benefit amount…may differ from the estimates…because:
- Your earnings may increase or decrease in the future.
- After you start receiving benefits, they will be adjusted for cost-of-living increases.
- Your estimated benefits are based on current law. The law governing benefit amounts may change.
- Your benefit amount may be affected by military service, railroad employment or pensions earned through work on which you did not pay Social Security tax.
In addition, the Statement asserts that benefit estimates are more accurate for older workers who are closer to retirement. One of this paper's goals is to examine that assertion.
Literature Review
Previous studies have evaluated the accuracy of the method SSA currently uses to estimate retirement benefits for the Social Security Statement. Springstead, Weaver, and Fichtner (2008) used the Modeling Income in the Near Term (MINT) microsimulation model to assess the accuracy of the Statement's estimation methodology. The authors found that the accuracy of benefit estimates increased with the recipient's age, and that this finding generally held across birth cohorts. They found that median differences between the Statement benefit estimates and the PIA at retirement is highest among workers at younger ages, for women, and for lower earners. Finally, they noted that estimates were less accurate for persons with zero earnings in the 2 years prior to the Statement, who were projected to have no future earnings.
SSAB, in their 2009 report, conducted a formal empirical analysis of the Statement's retirement benefit projections with assistance from SSA's Office of the Chief Actuary and Office of Retirement Policy. Also using MINT, SSAB found that, on average, the benefit estimates improved as the worker approached retirement age. SSAB noted that the projections were less accurate for younger workers than for older workers, for women than for men, and for lower-wage workers than for higher-wage workers. SSAB found that the assumption of constant real earnings used in the Statement yields fairly accurate results for men and for older workers, but is less realistic for younger workers, who would expect to see real earnings grow over time. The report questioned the assumption that a worker with 2 consecutive years with no earnings would have no future earnings, noting it was particularly unrealistic for workers under age 50. SSAB found that projected benefits were less accurate for these workers than for any other group, and the benefits for which they would actually become eligible were the most underestimated.
While Springstead, Weaver, and Fichtner (2008) and SSAB (2009) focused on the accuracy of benefit estimates in the Statement, other studies have tried to understand how best to predict future earnings. These other studies might reveal alternative projection methods that SSA could adopt in place of the current method. For example, Kim, Tamborini, and Sakamoto (2018) used Survey of Income and Program Participation (SIPP) data linked to longitudinal tax records to determine which of several variables best predicted 20-year long-term earnings for a sample of workers aged 25 to 45 in 1990. The authors found that 1 year of cross-sectional earnings (measured in 1990) is more predictive of workers' subsequent 20-year cumulative earnings than their demographics, educational attainment, and occupation. The authors found this to be true for both men and women.
Guvenen and others (2019) used administrative data from SSA's Master Earnings File (MEF) covering 1978–2013 and survey data from the Panel Study of Income Dynamics (PSID) to analyze the distributions of earnings and changes in earnings over workers' entire working lives and then to estimate earnings processes. The authors found that the distribution of earnings growth is not symmetric, with most individuals experiencing very small changes, while changes for a small, but nonnegligible, number are extremely large. In addition, they found that increases in earnings for higher-earning individuals are temporary, whereas declines are persistent, with the opposite being true for low earners. In terms of predicting earnings, the authors importantly noted that “the variation in earnings dynamics over the life cycle and by recent earnings are so large that it is an open question whether existing models can be quantitatively consistent.”
The analysis that follows builds upon the previous literature in both assessing the accuracy of SSA's current method of producing benefit estimates for the Statement and in testing various alternative projection methods to estimate future earnings and benefits. The findings of this analysis align closely with the results of previous research in these areas.
Data
For this project, we used wage and salary data from the 2015 CWHS file. The CWHS is an analytical master file created from 1 percent samples of the Master Beneficiary Record (MBR) and the Master Earnings File (MEF), both of which SSA uses to administer the Old-Age, Survivors, and Disability Insurance (OASDI) programs. To maintain the CWHS's 1 percent sample size, each year SSA adds the earnings records associated with a random selection of newly issued Social Security numbers. The records of deceased workers remain in the CWHS, allowing researchers to study the annual wages of entire birth cohorts over time. When needed, SSA updates the CWHS earnings records for adjustments and corrections to the MEF.
The CWHS includes data on Social Security taxable wages in covered employment since 1951.7 Since 1978, the CWHS has included records on annual wages in noncovered employment and earnings exceeding the annual maximum taxable amount.8 For this analysis, only covered earnings were of interest.
Analysis
Profile of workers with 2 consecutive years of no earnings
We started by examining the assumption that a person who does not work in the 2 years prior to the year of the Statement will have no future earnings. We used CWHS earnings records of workers born in 1933–1953 who had a year of earnings followed by at least 2 consecutive years of no earnings and who lived to at least age 62.9 We include all earners in this analysis, regardless of OASDI insured status.
First, we identified men and women who had earnings in any of the 5 years following 2 consecutive years with no earnings, by age (in 5-year intervals: ages 25–29, 30–34, 35–39, 40–44, 45–49, and 50–54) in which both of the no-earnings years occurred.10 For these individuals, we calculated:
- the percentages who had any earnings during the next 5 years,
- the number of years in which they had earnings during the next 5 years,
- the 5-year median annual earnings of those who had any earnings during the next 5 years, and
- annual earnings at the 10th, 25th, 50th, 75th, and 90th percentiles for those who had any earnings during the next 5 years.
Table 1 shows the percentages and median earnings.11 We also computed mean earnings in the years immediately before 2 consecutive years of zero earnings (Table 2).
| Age in zero-earnings years a | Percent with earnings | Median annual earnings (2015 $) | ||
|---|---|---|---|---|
| Men | Women | Men | Women | |
| 25–29 | 69 | 68 | 6,641 | 4,155 |
| 30–34 | 65 | 64 | 6,364 | 4,235 |
| 35–39 | 61 | 63 | 5,983 | 4,420 |
| 40–44 | 56 | 57 | 5,863 | 4,183 |
| 45–49 | 51 | 49 | 5,570 | 3,724 |
| 50–54 | 45 | 41 | 4,974 | 3,049 |
| Source: 2015 CWHS (1933–1953 birth cohorts). | ||||
| a. Sample includes only workers whose zero-earnings years took place within an age group. | ||||
| Age in zero-earnings years a | In the 2 years before zero-earnings years | In the year before zero-earnings years | ||
|---|---|---|---|---|
| Men | Women | Men | Women | |
| 25–29 | 12,760 | 10,725 | 10,568 | 8,232 |
| 30–34 | 15,694 | 9,809 | 13,035 | 7,710 |
| 35–39 | 17,416 | 9,248 | 14,928 | 7,549 |
| 40–44 | 18,252 | 9,318 | 15,538 | 7,720 |
| 45–49 | 18,485 | 10,074 | 15,361 | 8,084 |
| 50–54 | 20,291 | 11,794 | 16,505 | 9,092 |
| Source: 2015 CWHS (1933–1953 birth cohorts). | ||||
| a. Sample includes only workers whose zero-earnings years took place within an age group. | ||||
Next, we measured the career-average annual earnings through age 62 of men and women following 2 consecutive years with no earnings. For these individuals, we counted:
- the percentages who had any earnings through age 62,
- the number of years in which they had earnings through age 62,
- mean annual earnings of those who had any earnings through age 62, and
- annual earnings at the 10th, 25th, 50th, 75th, and 90th percentiles for those who had any earnings through age 62.
Table 3 shows the percentages and mean annual earnings.
| Age in zero-earnings years a | Percent with earnings | Mean annual earnings (2015 $) | ||
|---|---|---|---|---|
| Men | Women | Men | Women | |
| 25–29 | 82 | 90 | 22,586 | 15,016 |
| 30–34 | 78 | 90 | 17,319 | 14,676 |
| 35–39 | 78 | 87 | 15,448 | 12,613 |
| 40–44 | 74 | 78 | 14,038 | 10,286 |
| 45–49 | 69 | 65 | 13,147 | 8,481 |
| 50–54 | 55 | 49 | 11,529 | 7,147 |
| Source: 2015 CWHS (1933–1953 birth cohorts). | ||||
| a. Sample includes only workers whose zero-earnings years took place within an age group. | ||||
The tables indicate that most workers who experience 2 consecutive years of zero earnings return to having earnings in later years. This is particularly true for younger workers and women in Table 3. Therefore, we concluded that the Statement's assumption that workers with 2 consecutive years of zero earnings do not subsequently resume work is not accurate for many workers. In addition, we hypothesized that more accurate benefit estimates are possible if we use earnings from more than 2 years in the past to project future earnings for those with 2 consecutive years of zero earnings.
Accuracy of current and alternative estimation methods
Next, we investigated the accuracy of SSA's current method of estimating future benefits and evaluated alternative projection methods. The accuracy of the different methods was measured by whether a benefit estimate was within a specific percentage (plus or minus) of the actual benefit. The actual benefit and the estimated benefits are expressed as the worker's PIA, the basic benefit before any adjustments. For each worker, the actual PIA was calculated using actual career earnings through age 61 and the PIA formula bend points in effect for the year the worker reached age 62.12 We calculated the estimated benefits for the current Statement method, as well as each alternative method, using the worker's earnings history up to the year before he or she received the Statement (hereafter referred to as the “Statement age”), the given method of projecting future earnings, and the PIA formula bend points in effect in the year of Statement receipt.13
In order to make the benefit estimates calculated at different ages in different years comparable, the actual-PIA computations were deflated by the AWI back to each Statement age.14 For example, the estimated benefit calculated at Statement age 30 would be based on wage indexing up to age 28, while the actual PIA would index earnings up to age 60 and then be deflated by the AWI back to age 28. Deflating the actual PIA puts that amount on par with the estimated benefit calculated at Statement age 30.
Accuracy of the current Statement method
The CWHS sample for this part of the project consisted of workers born 1940 to 1946 who lived to at least age 62.15,16 In 2015, members of this sample were aged 69–75, so their entire pre-retirement earnings history was known and any corrections to past earnings would have already been made. As a reminder, the current estimation method projects future earnings by assuming the most recent annual earnings level will continue in each future year until age 62. If earnings were zero in the most recent year, annual earnings from 2 years earlier are projected as future earnings.
Table 4 shows our findings on the accuracy of the current Statement estimation method compared to the actual PIA for workers receiving a Statement at ages 25, 30, 35, 40, 45, 50, and 55. Results are shown for five different thresholds of accuracy.
| Statement age | Percentage of projections accurate to within— | ||||
|---|---|---|---|---|---|
| 5% | 10% | 15% | 20% | 25% | |
| 25 | 7 | 14 | 20 | 27 | 32 |
| 30 | 14 | 25 | 34 | 41 | 46 |
| 35 | 23 | 38 | 45 | 50 | 55 |
| 40 | 31 | 45 | 54 | 61 | 65 |
| 45 | 40 | 57 | 66 | 73 | 77 |
| 50 | 55 | 71 | 79 | 84 | 87 |
| 55 | 74 | 86 | 90 | 92 | 93 |
| Source: 2015 CWHS (1940–1946 birth cohorts). | |||||
| Note: Includes workers in insured and non-insured status as of Statement age. | |||||
In general, and not surprisingly, we found that the current Statement method was less accurate for younger Statement recipients and that accuracy increased with recipient age. For example, just 14 percent of the benefit estimates were within 10 percent of the actual PIA for Statement recipients aged 25, compared with 86 percent for Statement recipients aged 55. This pattern held across all five accuracy thresholds.
Table 5 shows the percentage of projected benefits estimated using the current Statement method that were accurate to within 10 percent for various subgroups and at different Statement ages. We compared estimated benefits to the actual PIA for men, women, low earners, high earners, insured workers, and workers who were not fully insured (that is, with fewer than 40 credits at Statement receipt). Low earners and high earners were defined as those in the bottom and top AIME quintiles, respectively.
| Statement age | All | Sex | Earnings level | Insured status | |||
|---|---|---|---|---|---|---|---|
| Men | Women | Low | High | Insured | Not insured | ||
| 25 | 14 | 16 | 11 | 11 | 14 | 20 | 13 |
| 30 | 25 | 33 | 17 | 25 | 40 | 35 | 15 |
| 35 | 38 | 51 | 25 | 35 | 81 | 47 | 23 |
| 40 | 45 | 55 | 35 | 44 | 82 | 51 | 32 |
| 45 | 57 | 66 | 48 | 52 | 88 | 61 | 43 |
| 50 | 71 | 79 | 64 | 61 | 94 | 75 | 56 |
| 55 | 86 | 91 | 81 | 70 | 100 | 90 | 68 |
| Source: 2015 CWHS (1940–1946 birth cohorts). | |||||||
| Note: Includes workers in insured and non-insured status as of Statement age. | |||||||
We found that the retirement-benefit estimates in the Statement are less accurate for younger workers, non-insured workers, women, and workers with lower lifetime earnings. For example, even among the oldest Statement recipients in Table 5, those aged 55, only 70 percent of low earners had benefit estimates that were within 10 percent of their actual benefit, compared with 100 percent of high earners.17
Table 6 reports the percentage distribution of benefit estimates that underestimate, overestimate, and accurately project the actual PIA to within 10 percent.
| Statement age | Benefit underestimated | Accurate estimate | Benefit overestimated |
|---|---|---|---|
| 25 | 65 | 14 | 20 |
| 30 | 54 | 25 | 19 |
| 35 | 39 | 38 | 21 |
| 40 | 32 | 45 | 23 |
| 45 | 23 | 57 | 20 |
| 50 | 13 | 71 | 15 |
| 55 | 6 | 86 | 7 |
| Source: 2015 CWHS (1940–1946 birth cohorts). | |||
| Note: Includes workers in insured and non-insured status as of Statement age. | |||
We found that most of the inaccurate benefit estimates for younger Statement recipients are underestimates, and as recipient age increases, the percentage of underestimates declines. Among Statement recipients aged 55, the percentages of overestimates and underestimates are both under 10 percent.18
Accuracy of alternative methods I: Alternative Earnings Assumptions
We used the same CWHS sample and actual-PIA computations to evaluate several alternatives to the Statement's method for projecting earnings.19 We discuss only the methods that were the most successful or provided noteworthy results. The alternative methods follow three general approaches.
The first approach adjusted the projected earnings of workers with 2 consecutive years of zero earnings prior to the year of Statement receipt. The current method projects no future earnings for such workers. We tested an alternative (called the Three Zero method) in which projected future annual earnings for these individuals are equal to their earnings in the year before the 2 zero-earning years. A variation (the Average Three method) assumed that future annual earnings would equal the average of the 3 years of earnings before Statement receipt, regardless of whether any or all of them were zeroes.
The second approach used the SSA Chief Actuary's scaled-worker earning profiles to project earnings.20 The thinking here was that a straight-line assumption that the previous year's earnings will continue may not be an accurate representation of the arc of lifetime earnings, where the highest earning years typically occur in middle age and then taper off as retirement approaches. We tested several iterations combining a given year of earnings and a given scaled-worker earnings profile in the projection. The most accurate of those, the Raw Scaled method, used the scaled-worker earnings paths to estimate future earnings and is presented here.21 These earnings paths are based on all workers at a given age, whether they work at that age or not.
The third approach projected no future earnings and counted only accrued earnings. This method (Accrual) essentially assumes that the worker will never work again. It also highlights the accuracy gained or lost by using the last year of earnings as the projected earnings.
Table 7 shows that the current Statement method is at least as accurate as each of the alternative methods at the accuracy threshold of plus or minus 5 percent at almost every Statement age. For younger recipients, the Three Zero and Average Three methods come closest to the current method, which is expected because they are only slight variations. The Raw Scaled method is more inaccurate for younger workers, but slightly outperforms the current method for recipients aged 55. The Accrual method is the least accurate, which indicates that the contribution of future earnings to actual benefits is substantial. The one Statement age for which the current method is not the most accurate is 55. The Raw Scaled method is accurate for 76 percent of these recipients, compared with 74 percent under the current method.
| Statement age | Current Statement method | Three Zero method | Average Three method | Raw Scaled method | Accrual method |
|---|---|---|---|---|---|
| 25 | 7 | 7 | 6 | 4 | 3 |
| 30 | 14 | 14 | 11 | 7 | 6 |
| 35 | 23 | 23 | 17 | 10 | 9 |
| 40 | 31 | 31 | 22 | 16 | 13 |
| 45 | 40 | 40 | 28 | 25 | 18 |
| 50 | 55 | 55 | 39 | 50 | 25 |
| 55 | 74 | 74 | 55 | 76 | 47 |
| Source: 2015 CWHS (1940–1946 birth cohorts). | |||||
| Note: Includes workers in insured and non-insured status as of Statement age. | |||||
Table 8 shows that the current method is more accurate than the alternatives even when the accuracy threshold is relaxed to plus or minus 10 percent. With this less stringent threshold, greater percentages of Statement recipients receive an accurate projection at each successively older age, reaching 86 percent under the current method at age 55. The current method is at least as accurate at Statement ages 25 through 50 as the other methods. The Three Zero method is almost as accurate, but never surpasses the current method's accuracy rate. Again, the Raw Scaled method is accurate for a slightly larger proportion of the population than the current method for recipients aged 55, 87 percent versus 86 percent.
| Statement age | Current Statement method | Three Zero method | Average Three method | Raw Scaled method | Accrual method |
|---|---|---|---|---|---|
| 25 | 14 | 13 | 12 | 7 | 4 |
| 30 | 25 | 24 | 21 | 9 | 8 |
| 35 | 38 | 37 | 31 | 14 | 11 |
| 40 | 45 | 44 | 35 | 23 | 16 |
| 45 | 57 | 56 | 44 | 44 | 21 |
| 50 | 71 | 71 | 56 | 69 | 36 |
| 55 | 86 | 86 | 70 | 87 | 68 |
| Source: 2015 CWHS (1940–1946 birth cohorts). | |||||
| Note: Includes workers in insured and non-insured status as of Statement age. | |||||
The results indicate that the last year of earnings may be the most accurate representation of future earnings. This is consistent with Kim, Tamborini, and Sakamoto (2018). The much lower accuracy of the Accrual and Raw Scaled alternative methods for younger Statement recipients indicates that assuming no future earnings, or assuming a career earnings trajectory observed in the aggregate, do not adequately predict the future course of individual career earnings. As such, we concluded that these relatively simple alternative earnings projection methods do not significantly improve the results over the current Statement method.22
Accuracy of alternative methods II: Complex Models
The final stage of the project was to explore whether more complex alternative projection methodologies could more accurately estimate the future benefit than the current method does. We tried two general approaches. The first was to employ various machine-learning methods, in which computer programs autonomously develop a model or models and continually revise them through repeated simulations and analyses.23 The second was to conduct a series of regressions. Both approaches attempted to project earnings and benefits using the information available to SSA when estimating benefits in the Statement, such as age, sex, insured status, and current and past earnings. We anticipated that such methods, which incorporate additional information, would improve the accuracy of the current method and the alternative methods reviewed above, which rely on earnings records alone.
The machine-learning methods we tested against the current Statement method included decision trees, neural networks, polynomial regressions, and k-nearest neighbors (kNN). As before, the assessed metric was the accuracy of the estimated benefit against the actual PIA at different accuracy thresholds for different Statement ages. We used the CWHS 1936–1954 birth cohorts for this analysis.
We started by estimating the benefits for a test population of Statement recipients aged 40. Using each machine-learning method, we first predicted two separate target variables needed to compute the estimated benefit: (1) the number of future years with earnings (through age 61) that would be included in the highest 35 years of earnings, and (2) the average of those years' earnings. We predicted these target variables from a number of input variables derived from the earnings at all ages prior to Statement receipt. With the two predicted target values and actual earnings in years prior to Statement receipt, we calculated the benefit for each model for the entire test population, as well as by insured status and by sex.
We found that all machine-learning models generally underperformed the current method. However, each model marginally outperformed the current method at a few accuracy thresholds and for very small subsets of the population. No one model could be considered generally superior to all others, but for computational considerations, the kNN method was chosen for continued testing at the other Statement recipient ages. Table 9 summarizes the kNN model results for men and women at the plus or minus 10 percent accuracy threshold.
| Statement age | Current Statement method | k-nearest neighbor |
|---|---|---|
| All | ||
| 25 | 15 | 18 |
| 30 | 26 | 25 |
| 35 | 37 | 32 |
| 40 | 49 | 41 |
| 45 | 60 | 54 |
| 50 | 74 | 71 |
| 55 | 88 | 87 |
| Men | ||
| 25 | 17 | 24 |
| 30 | 33 | 34 |
| 35 | 47 | 43 |
| 40 | 59 | 54 |
| 45 | 68 | 66 |
| 50 | 81 | 81 |
| 55 | 92 | 92 |
| Women | ||
| 25 | 13 | 13 |
| 30 | 19 | 16 |
| 35 | 28 | 21 |
| 40 | 39 | 29 |
| 45 | 53 | 43 |
| 50 | 68 | 62 |
| 55 | 84 | 83 |
| Source: 2015 CWHS (1936–1954 birth cohorts). | ||
| Note: Includes workers in insured and non-insured status as of Statement age. | ||
The only kNN model results that outperformed the current estimation method were for the youngest Statement recipients, aged 25. However, the accuracy of the kNN model, as with all models, increases with recipient age, as the number of future earnings years to predict decreases. Thus, the kNN model's greater accuracy for Statement recipients aged 25 may have occurred by chance, as both models performed poorly for that age, with its greatest potential variability of results.
We evaluated the results for subsets of the population, including workers with differing numbers of earnings years, average lifetime earnings, and insured status. As was somewhat expected from earlier results, the machine-learning methods were most accurate for workers with consistently high earnings histories (that is, for workers with more years of earnings and higher lifetime earnings), whether or not they outperformed the current Statement method for those workers. We also found that the kNN model performed better for fully insured workers than for those not fully insured, regardless of Statement age.
In hindsight, it should not be surprising that the machine-learning methods performed no better than the current method. For a continuous target such as the future-earnings variables, machine-learning methods are essentially sophisticated statistical functions that rely on regressions over the supplied training data to compute the expected value of the target. Such methods are not dramatically different from the current method, which assumes that future earnings (and by extension, the PIA) are linearly correlated with recent earnings.24
In conclusion, we found that machine-learning methods do not appear to be promising replacements for the current method. Such methods are not straightforward to implement and require the specification of numerous parameters, each of which needs to be adjusted through trial and error to achieve better performance. With enough experimentation, it might be possible to find implementations that outperform the current method overall, but such effort does not guarantee an improvement significant enough to justify its adoption for the Statement. As such, we concluded that none of the machine-learning models we tested performed at a level that would qualify them to replace the current method.
The second alternative projection methodologies we tested were static and dynamic individual-level and group-level regressions, which we used to estimate future earnings, the AIME, and the PIA (with and without predicted future earnings).25 The dynamic models were no more accurate than the static models, so we focus here on the static-regression results. Some of the controls included the number of years worked since age 16 and in the last 5 years, total accumulated earnings since age 16 and in the last 5 years, annual average earnings since age 16 and in the last 5 years, age at labor market entry, wage level, age of first earnings, sex, and place of birth. We used the CWHS 1950–1954 birth cohorts for this analysis.
First, we estimated static individual-level regression models to project earnings profiles starting at different Statement ages, using earnings from when the individual started working until Statement receipt and age when the individual started working. Based on prior literature on projecting earnings, we tried linear, quadratic (t2), and cubic (t3) time trend variations of the model, where t is the time trend variable, to see which variation would better project earnings and estimate benefits. We found that at younger Statement receipt ages, the linear model overestimated the PIA and that the quadratic and cubic models respectively overestimated and underestimated the PIA (not shown).
Then we estimated static group-level regression models, similar to the individual-level models except with group-level age-earnings profiles aggregated by time-invariant characteristics such as sex and place of birth. As before, we tried linear, quadratic, and cubic time trend variations of the model. The results were similar to the individual-level regression models in that the linear model overestimated the PIA and the quadratic and cubic models respectively overestimated and underestimated the PIA for younger Statement recipients (not shown).
In addition, we estimated the PIA as a function of past earnings without first predicting future earnings. To do this, we divided the CWHS sample into two subsamples, using the 1950–1952 cohorts to train the models and then the 1953–1954 cohorts to test and predict the benefit. We found that for younger Statement recipients, these models tended to overestimate the PIA in the middle of the distribution (not shown).
Next, because none of the models consistently outperformed the accuracy of the current Statement method of estimating benefits, we split the sample based on observed work attachment and ran the same static individual-level, group-level, and direct-PIA regression models. We separately analyzed workers with high labor force attachment (defined as those who worked all 5 years prior to the Statement receipt and worked at least 80 percent of the years since their first nonzero earnings year) and with low labor force attachment (all others). Table 10 shows the results for a plus or minus 10 percent accuracy threshold.
| Statement age | Current Statement method | Individual linear model | Group linear model | PIA model |
|---|---|---|---|---|
| High labor market attachment | ||||
| 25 | 8 | 13 | 12 | 21 |
| 30 | 15 | 21 | 21 | 29 |
| 35 | 28 | 29 | 28 | 39 |
| 40 | 47 | 40 | 40 | 47 |
| 45 | 71 | 55 | 54 | 57 |
| 50 | 87 | 71 | 71 | 67 |
| 55 | 96 | 91 | 91 | 74 |
| Low labor market attachment | ||||
| 25 | 10 | 7 | 13 | 10 |
| 30 | 18 | 13 | 19 | 11 |
| 35 | 27 | 20 | 27 | 14 |
| 40 | 39 | 28 | 35 | 19 |
| 45 | 54 | 37 | 46 | 26 |
| 50 | 70 | 49 | 57 | 34 |
| 55 | 86 | 67 | 76 | 45 |
| Source: 2015 CWHS (1950–1954 birth cohorts). | ||||
| Note: Includes workers in insured and non-insured status as of Statement age. | ||||
We found that for younger recipients, the PIA regression model is more accurate for workers with high labor force attachment and the group-level linear regression model is more accurate for workers with low labor force attachment. We concluded that none of these methods provided more accurate benefit estimates than the current method. However, these results suggest that different estimation methods for different subgroups of workers based on age and labor force attachment might improve the current estimates.
Conclusion
This paper addresses one of SSA's Strategic Plan objectives: to increase public understanding of the Social Security program by improving the accuracy of the retirement benefit estimates in the Social Security Statement. Based on the prior literature and our analysis that workers with 2 consecutive years of zero earnings often have future earnings, we attempted to find an alternative projection methodology that would improve the accuracy of the retirement benefit estimates in the Statement. We found that none of the methods we tested—looking back more than 2 years in the earnings record, assuming no future earnings, using scaled-worker earnings profiles, using machine-learning computer models, or using regression models—consistently outperformed the Statement's current estimation method.
The results suggest that a combination of methods might improve the benefit estimates for certain subgroups of workers. However, the extent of the possible improvement is insufficient in our judgment to recommend replacing the Statement's current benefit estimation methodology with one or more of these complex methods. One challenging aspect of such a change would be to convey to the public how future earnings are projected and how benefits are estimated under these methods.
Kim, Tamborini, and Sakamoto (2018) concluded that a worker's prior year's earnings, the basis of the current method of estimating future benefits, is as good or better as a predictor of future earnings than other methods that control for other characteristics. This may explain our finding that the current Statement estimation method performed at least as well as the alternative methods overall. Predicting future earnings is challenging, especially for younger workers, where the range of divergent possibilities is widest. Another complicating factor may be that the progressive benefit formula and its use of the average of the highest 35 years of indexed earnings means that not all earnings have the same effect on benefits. Depending on the earnings history, projected earnings may or may not be included in the benefit formula and may or may not have a noticeable effect on benefits.
This paper has shown that SSA's benefit estimates may not be accurate for many workers. We recommend enhancements to the benefit-estimating tools available online via the my Social Security portal, including permitting uninsured workers' access to the portal, and increased capability for existing interactive calculators.26 Providing access to a benefit estimate for uninsured workers based on future covered work would allow workers with less than 40 credits to see the impact of continued covered work on becoming fully insured for benefits in the future. Expanding the flexibility of the interactive benefit calculators may improve the accuracy of the benefit estimates for workers whose knowledge of their current and future work situations may be better than SSA's assumptions and so may be best suited to enter accurate expected future earnings and claiming-age variables. Taking these steps in improving the presentation of benefit estimates in the Statement could address the Agency Strategic Plan objective and better inform the American public of their expected level of Social Security benefits and of the Social Security program in general.
Appendix A
2020 sample Social Security Statement
Appendix B
| Statement age | Current Statement method | Scaled-worker methods | |||
|---|---|---|---|---|---|
| Scaled | Two zero | Three zero | Average three | ||
| 25 | 10 | 2 | 3 | 3 | 2 |
| 30 | 18 | 2 | 2 | 2 | 2 |
| 35 | 27 | 5 | 4 | 4 | 3 |
| 40 | 32 | 8 | 8 | 8 | 5 |
| 45 | 41 | 13 | 13 | 12 | 8 |
| 50 | 55 | 23 | 23 | 23 | 16 |
| 55 | 76 | 63 | 62 | 62 | 53 |
| Source: 2015 CWHS (1940–1946 birth cohorts). | |||||
| Note: Includes workers in insured status as of Statement age. | |||||
| Statement age | Current Statement method | Scaled-worker methods | |||
|---|---|---|---|---|---|
| Scaled | Two zero | Three zero | Average three | ||
| 25 | 20 | 4 | 5 | 5 | 4 |
| 30 | 35 | 4 | 4 | 4 | 4 |
| 35 | 47 | 7 | 7 | 7 | 6 |
| 40 | 51 | 14 | 13 | 13 | 10 |
| 45 | 61 | 22 | 22 | 22 | 17 |
| 50 | 75 | 51 | 50 | 50 | 43 |
| 55 | 90 | 86 | 85 | 85 | 77 |
| Source: 2015 CWHS (1940–1946 birth cohorts). | |||||
| Note: Includes workers in insured status as of Statement age. | |||||
Notes
1 See Appendix A for a facsimile Social Security Statement.
2 The taxable maximum amount is adjusted annually by the percentage increase in the national average wage. For more information on the taxable maximum, see https://www.ssa.gov/benefits/retirement/planner/maxtax.html.
3 For more information on credits, see https://www.ssa.gov/planners/credits.html.
4 For more information on how SSA indexes earnings, see https://www.ssa.gov/oact/cola/AWI.html.
5 For more information on the PIA formula, see https://www.ssa.gov/OACT/COLA/piaformula.html, and for examples of the calculation of benefits, see https://www.ssa.gov/OACT/ProgData/retirebenefit1.html.
6 The Statement provides estimated retired-worker benefits for each of three possible benefit-claiming ages: the earliest eligibility age (62), full retirement age, or age 70 (when delayed retirement credits stop accruing). As such, when estimating retirement benefits for the Statement, SSA projects future earnings until each of these benefit-claiming ages.
7 The CWHS comprises two component files called the active file and the inactive file. The active file contains the earnings records for workers with earnings from any employment (including self-employment), regardless of whether those earnings were covered under Social Security. The inactive file contains records only for workers who have never had covered earnings posted to the MEF. Prior to 1978, the CWHS tracked only covered earnings. For more information on the CWHS, see Smith (1989) and the Privacy Act Notice (https://www.ssa.gov/privacy/sorn.html).
8 In 2015, the taxable maximum was $118,500.
9 For this analysis, we needed earnings through age 62, and as a result, we selected a 21-year birth cohort whose youngest members were aged 62 in 2015 (that is, born in 1953).
10 For ease of computation, we omitted workers whose 2 zero-earnings years straddled two age groups.
11 For brevity, this paper's tables present selected results of our analysis. In the text, we occasionally refer to analyses and findings not shown in the tables.
12 Regardless of the age at which a worker claims his or her retired-worker benefit, Social Security's progressive benefit formula uses the bend points (earnings thresholds used in calculating the PIA) for the year the worker reaches age 62. (The formula also indexes the worker's past earnings using the AWI for the year the worker reached age 60.)
13 In other words, estimated benefits do not attempt to project what the PIA formula bend points will be when the worker reaches age 62. The estimates simply use the bend points for the current year (that is, the year of Statement receipt).
14 The same deflation was used in Springstead, Weaver, and Fichtner (2008).
15 We selected the 1940 to 1946 birth cohort for this analysis to be comparable to Springstead, Weaver, and Fichtner (2008).
16 We replicated this analysis using the MINT microsimulation model and produced the same general results. MINT did not offer any advantages over the CWHS because we limited the MINT population to the same 1940–1946 cohort and used only historical earnings data from the same source as those in the CWHS. In addition, we excluded disabled workers and MINT sample sizes are much smaller than the CWHS'.
MINT projects future retirement income, marital trends, Social Security benefits, income, and poverty. It allows researchers and policy analysts to simulate future retirement conditions such as income and poverty, the characteristics of future Social Security beneficiaries, and the effects of proposed reforms to the Social Security program, as well as to estimate distributional results of these outcomes to help inform policymakers. MINT was built by linking SSA's administrative records on benefits and earnings to the SIPP (https://www.census.gov/sipp), a detailed Census Bureau survey of households. Other surveys with data incorporated in MINT include the Health and Retirement Study (HRS, https://hrs.isr.umich.edu), the Medical Expenditures Panel Survey (MEPS, https://www.meps.ahrq.gov
This project used MINT version 7 (MINT7), which projects outcomes for a base cohort of individuals born 1926 through 1979. It is calibrated to the projections from the economic, demographic, and programmatic assumptions in the 2012 report of the OASDI trustees (Board of Trustees 2012). For a brief description of MINT7, see Smith and Favreault (2014). SSA's Office of Research, Evaluation, and Statistics (ORES) website also describes MINT and presents a number of MINT projections of Social Security policy options and population profiles (https://www.ssa.gov/policy/subjects/modeling-income-in-near-term.html).
17 The taxable maximum censors the effect of annual earnings variation on the AIME of high earners, thus improving the accuracy of the benefit estimates for high earners. This is not the case for low earners. In addition, the value of the taxable maximum has changed over time, censoring earnings more heavily in earlier years (Whitman and Shoffner 2011). This may contribute to the lower accuracy of benefit estimates for high earners at younger ages.
18 Using a 5 percent accuracy threshold (not shown), the percentages of underestimates and overestimates are higher at all ages than those shown in Table 6, but the general pattern is similar.
19 As with our assessment of the current Statement estimation method, we replicated the analysis in this section using MINT, and as before, we only present the CWHS results because the MINT results were generally similar.
20 For a description of the profiles that were the basis for this approach, see Clingman and Burkhalter (2017). That study includes several scaled earnings patterns (very low, low, medium, and high) which were not used in this analysis.
21 Our Raw Scaled earnings path is the Preliminary Adjusted Scaled Factor in Clingman and Burkhalter (2017). Other scaled worker alternatives developed and evaluated in this project included projecting future earnings by:
- using the scaled-earner profiles which are based on earnings only of those who do work at each age (Scaled);
- looking back 2 years for positive earnings and then using those earnings as the basis for Scaled (Scaled Two Zero);
- looking back 2 years for those aged 50 or older and 3 years for those younger than age 50 for positive earnings and then using those earnings as the basis for Scaled (Scaled Three Zero); and
- if there are no positive earnings in the previous year, using the average of the 3 most recent years of positive earnings as the basis for Scaled (Scaled Average Three).
The results for these alternatives are included in Appendix Tables B-1 and B-2.
22 For these alternative earnings projection methods, at the accuracy threshold of 10 percent, we generally find that at the youngest Statement ages, the inaccurate benefit estimates are underestimates (not shown). The one exception is the Raw Scaled method, which overestimates benefits except at the oldest ages. For the Accrual method, all the inaccurate benefit estimates are underestimates. The pattern of inaccurate estimates for the Three Zero method is similar to the current Statement method; however, the Average Three method generates more overestimates than the current Statement method does. A similar pattern holds at the accuracy threshold of 5 percent.
23 See Altman (1992) and Kotsiantis (2013) for descriptions of some of these methods.
24 This was confirmed by using the original data to calculate the r2 for each input variable against the target of average future earnings in the highest 35 years of earnings. The input variable with the highest r2 was found to be the most recent annual earnings, as is assumed in the current Statement method.
25 In the individual-level regressions, we estimated the parameters of the model by individuals. In the group-level regressions, we estimated the parameters of the model by groups of individuals, for example, by sex and race. The number of groups can be large. The static models do not change by time; the dynamic models do.
26 Other tools, not requiring a my Social Security account, are available at SSA's website; for example, https://www.ssa.gov/OACT/anypia/.
References
Altman, Naomi S. 1992. “An Introduction to Kernel and Nearest-Neighbor Nonparametric Regression.” The American Statistician 46(3): 175–185.
[Board of Trustees] Board of Trustees of the Federal Old-Age and Survivors Insurance and Federal Disability Insurance Trust Funds. 2012. The 2012 Annual Report of the Board of Trustees of the Federal Old-Age and Survivors Insurance and Federal Disability Insurance Trust Funds. Washington, DC: Government Printing Office. https://www.ssa.gov/OACT/TR/2012/index.html.
Clingman, Michael, and Kyle Burkhalter. 2017. “Scaled Factors for Hypothetical Earnings Examples Under the 2017 Trustees Report Assumption.” Actuarial Note No. 2017.3. Baltimore, MD: Office of the Chief Actuary. https://www.ssa.gov/oact/NOTES/ran3/an2017-3.pdf.
[GAO] Government Accountability Office. 2005. Social Security Statements: Social Security Administration Should Better Evaluate Whether Workers Understand Their Statements. GAO-05-192. Washington, DC: GAO. https://www.gao.gov/assets/250/245914.pdf.
Guvenen, Fatih, Fatih Karahan, Serdar Ozkan, and Jae Song. 2019. “What Do Data on Millions of U.S. Workers Reveal About Life-Cycle Earnings Risk?” Federal Reserve Bank of New York Staff Report No. 710. New York, NY: Federal Reserve Bank of New York. https://www.newyorkfed.org/medialibrary/media/research/staff_reports/sr710.pdf.
Kim, ChangHwan, Christopher R. Tamborini, and Arthur Sakamoto. 2018. “The Sources of Life Chances: Does Education, Class Category, Occupation, or Short-Term Earnings Predict 20-Year Long-Term Earnings?” Sociological Science 5: 206–233. https://www.sociologicalscience.com/download/vol-5/march/SocSci_v5_206to233.pdf.
Kotsiantis, Sotiris B. 2013. “Decision Trees: A Recent Overview.” Artificial Intelligence Review 39(4): 261–283.
Smith, Barbara A., and Kenneth A. Couch. 2014. “The Social Security Statement: Background, Implementation, and Recent Developments.” Social Security Bulletin 74(2): 1–25. https://www.ssa.gov/policy/docs/ssb/v74n2/v74n2p1.html.
Smith, Creston M. 1989. “The Social Security Administration's Continuous Work History Sample.” Social Security Bulletin 52(10): 20–28. https://www.ssa.gov/policy/docs/ssb/v52n10/v52n10p20.pdf.
Smith, Karen E., and Melissa M. Favreault. 2014. A Primer on Modeling Income in the Near Term, Version 7 (MINT7). Washington, DC: The Urban Institute. https://www.urban.org/research/publication/primer-modeling-income-near-term-version-7-mint7.
Social Security Administration. 2018. Social Security Administration Fiscal Years 2018–2022 Agency Strategic Plan. Baltimore, MD: SSA.
Social Security Advisory Board. 2009. The Social Security Statement: How It Can Be Improved. Washington, DC: SSAB. https://www.ssab.gov/research/the-social-security-statement-how-it-can-be-improved/.
Springstead, Glenn R., David A. Weaver, and Jason J. Fichtner. 2008. “Estimated Retirement Benefits in the Social Security Statement.” Research and Statistics Note No. 2008-05. Washington, DC: SSA. https://www.ssa.gov/policy/docs/rsnotes/rsn2008-05.html.
SSA. See Social Security Administration.
SSAB. See Social Security Advisory Board.
Whitman, Kevin, and Dave Shoffner. 2011. “The Evolution of Social Security's Taxable Maximum.” Policy Brief No. 2011-02. Washington, DC: SSA. https://www.ssa.gov/policy/docs/policybriefs/pb2011-02.html.